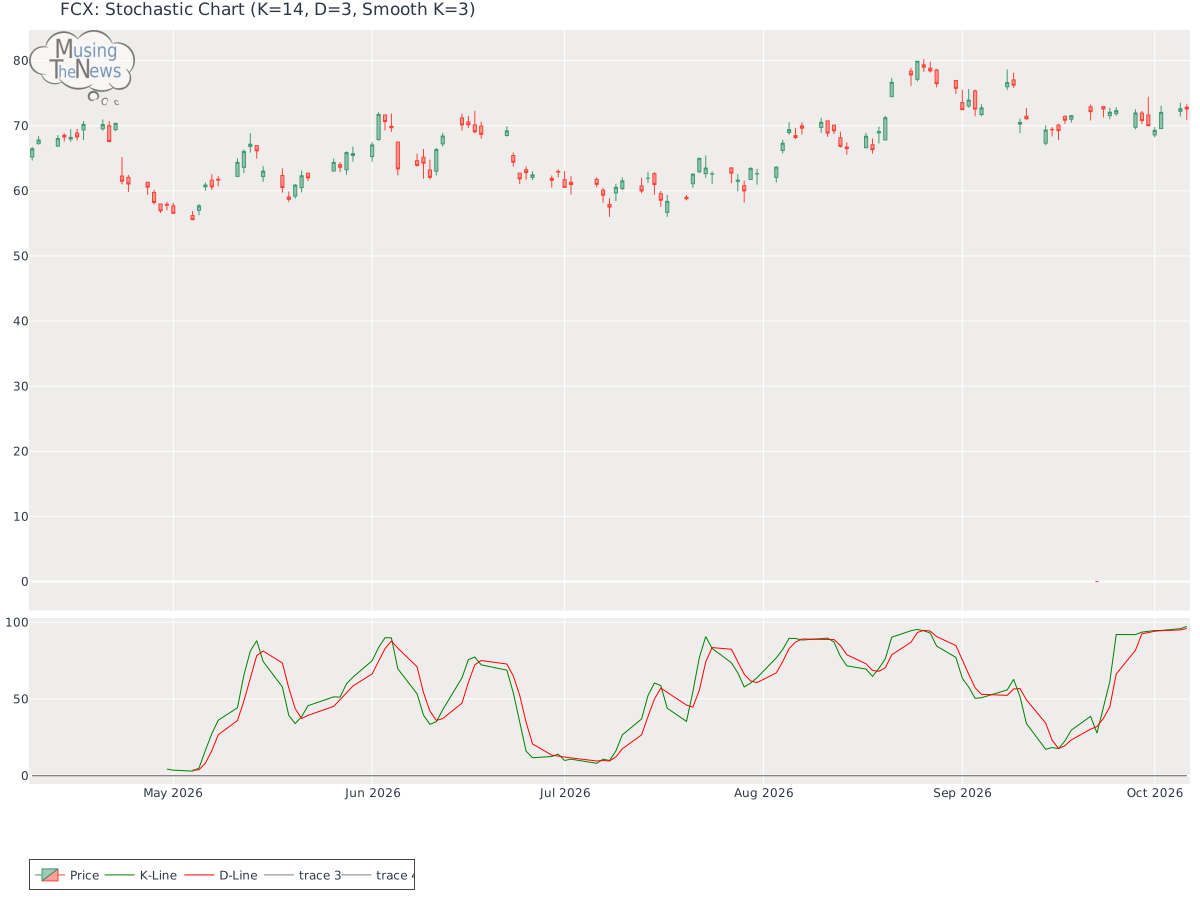
The stochastic indicator shows a bullish sentiment, with the K-line above both the D-line and the 80 level. This configuration indicates strong upward momentum, suggesting ...
By MusingTheNews
Updated 2026-10-07 23:26:18
Overall Technical outlook
Price Summary
Freeport-McMoRan Inc.'s stock started the year at 72.84, climbed to a high of 73.29, fell to 70.89, and closed -0.38% lower at 72.56, with 9178500 shares traded on 2026-10-06. Over the previous 52 weeks, the stock reached a high of 79.91 and a low of 0.0.
Technicals
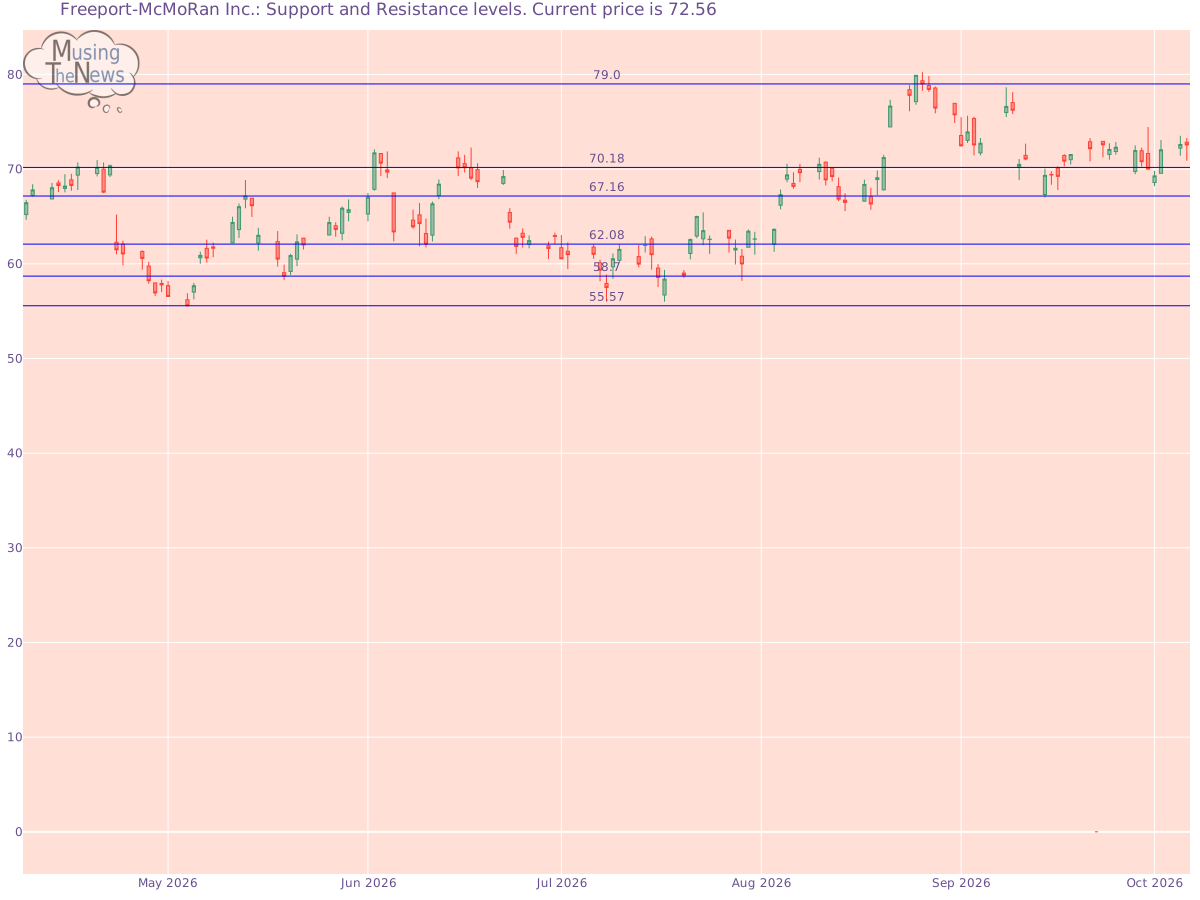
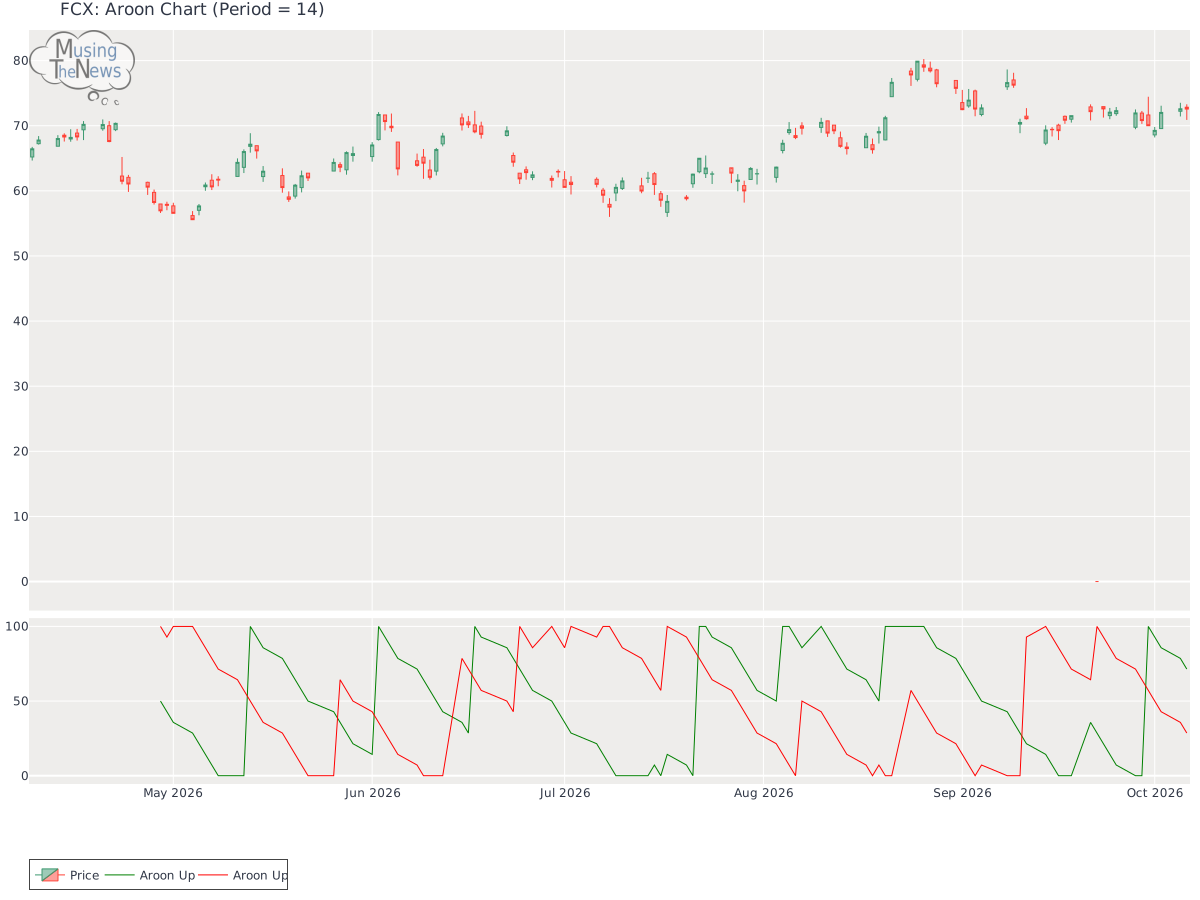
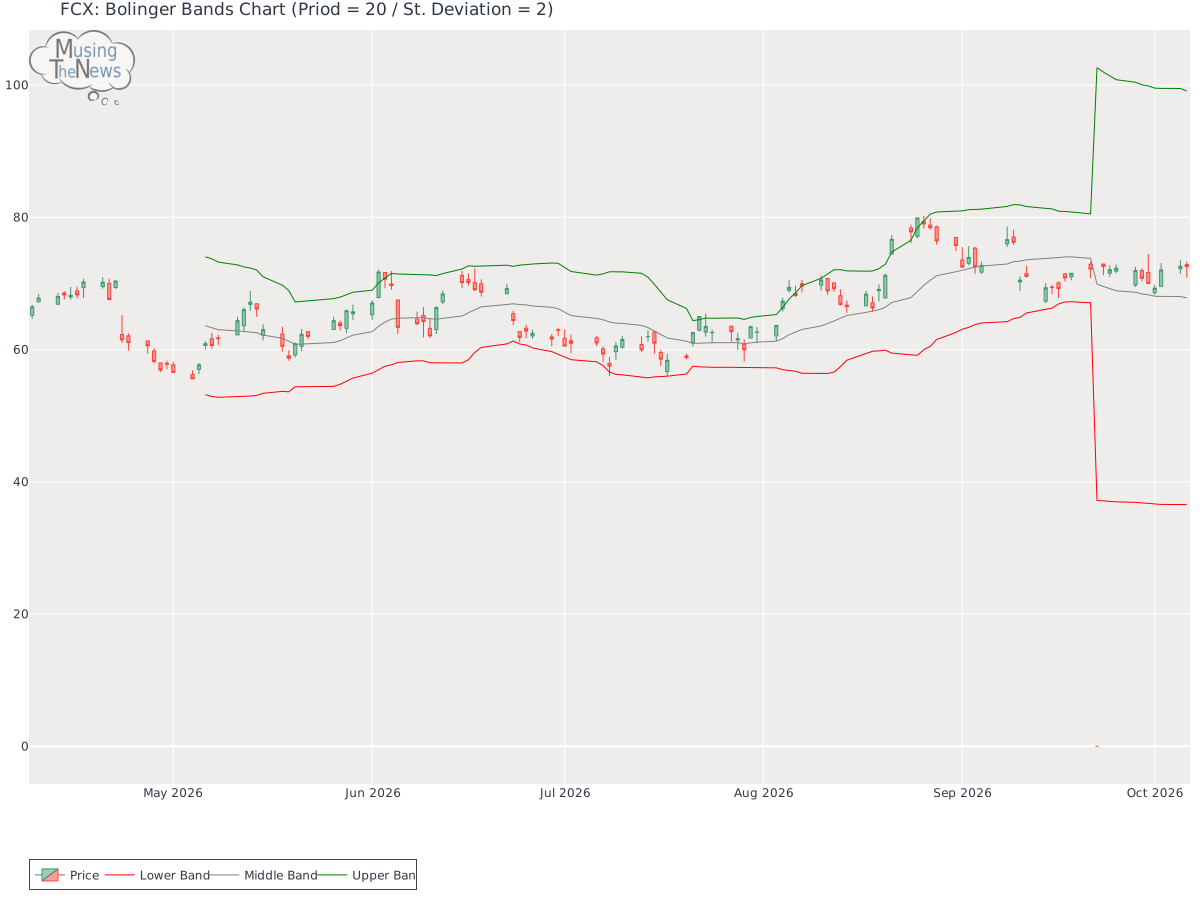
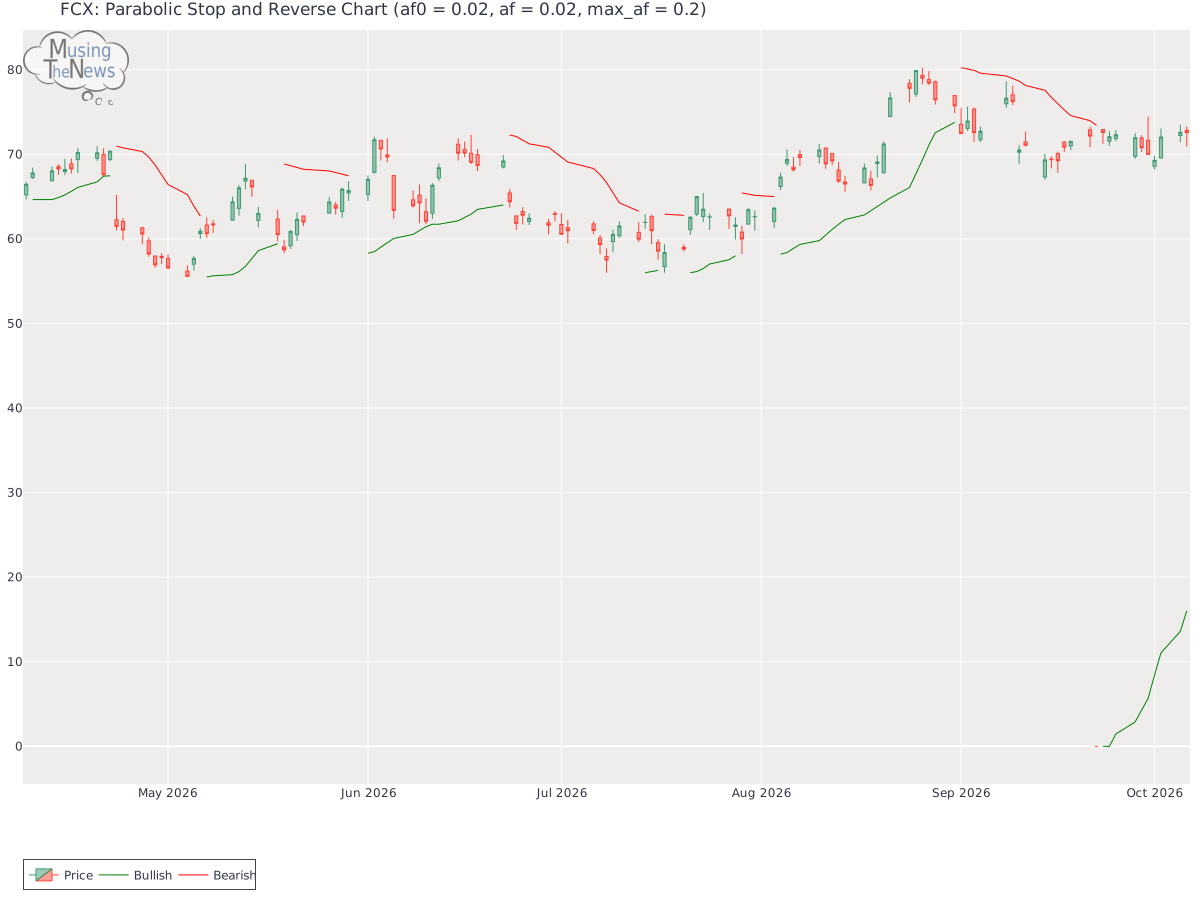
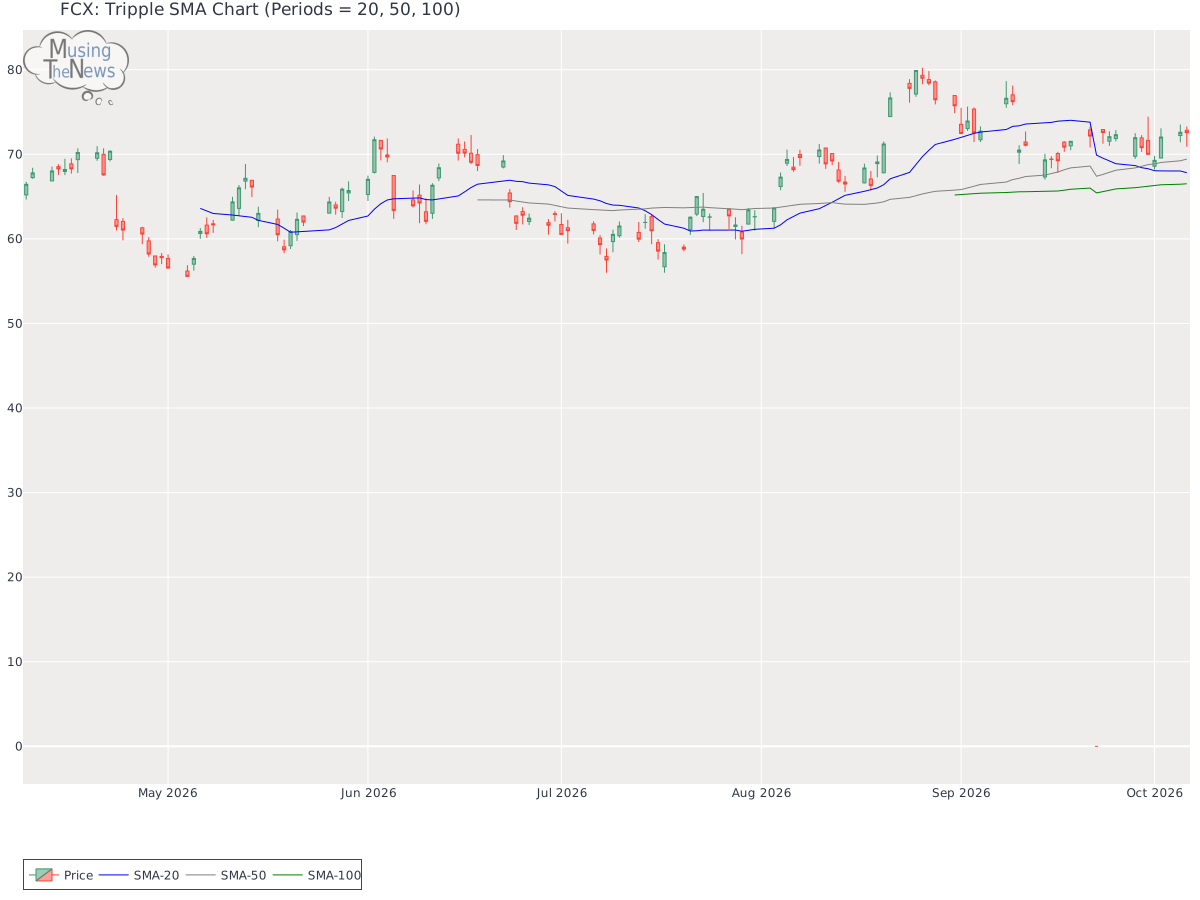
Support and Resistance: The price for FCX at 72.56 is supported by the 70.18 level and faces resistance at 79.0. This range indicates key levels where the price may find buyers near 70.18 and sellers near 79.0, defining a trading range.Support/Resistance for FCXAroon: The AROON is neutral, showing no definitive signals of a trend either upward or downward. This neutral stance indicates a period of market indecision, where the direction is unclear.Aroon chart for Freeport-McMoRan Inc.Bol. Bands: The BOLL BANDS is neutral, showing no definitive signals of a trend either upward or downward. This neutral stance indicates a period of market indecision, where the direction is unclear.Bolinger Bands chart for Freeport-McMoRan Inc.Parabolic SAR: The PSAR remains bullish in its outlook, setting a key support level that could sustain the ongoing upward trend. This strong support indicates that the market may continue to rise, with the bullish momentum likely to persist for FCX.Parabolic Stop and Reverse chart for Freeport-McMoRan Inc.Stochastic: The stochastic indicator shows a bullish sentiment, with the K-line above both the D-line and the 80 level. This configuration indicates strong upward momentum, suggesting that FCX may continue its upward trend. Traders might view this as a sign of sustained strength.Stochastic chart for Freeport-McMoRan Inc.Tripple Moving Agerage: The current state of the Tripple MOVING AVG is neutral, offering no clear signals of movement in either direction. This suggests a potential pause in market activity, with no strong trend emerging at the moment.Tripple SMA chart for Freeport-McMoRan Inc. In order to draw meaningful inferences from a company's technical data, it is essential to first consider its fundamentals. This includes reviewing financial metrics like revenue, profit margins, and debt-to-equity ratios. Additionally, understanding the broader industry landscape, including market trends and competitive pressures, is crucial. By integrating these insights with the company's technical performance, such as stock price fluctuations and trading volume, one can make more informed investment decisions.