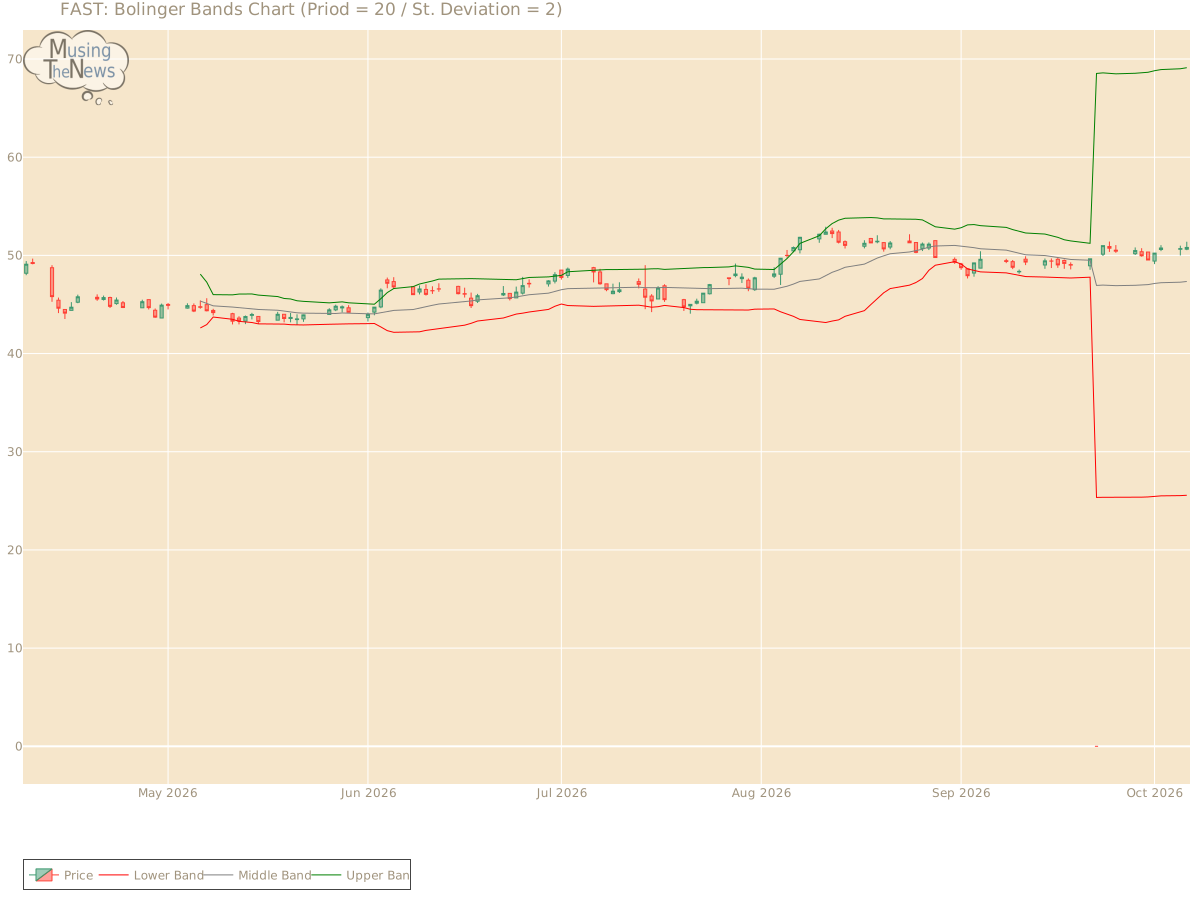
The BOLL BANDS is showing a neutral stance, not indicating a clear upward or downward trend for Fastenal Company. This suggests a period of market balance, where neither si...
By MusingTheNews
Updated 2026-10-07 23:26:15
Overall Technical outlook
Price Summary
On 2026-10-06, Fastenal Company's stock opened at 50.63, reached 51.39, hit a low of 50.53, and rose 0.36% to close at 50.81, with 4706300 shares traded. Throughout the 52-week period, the stock hit a high of 52.38 and a low of 0.0.
Technicals
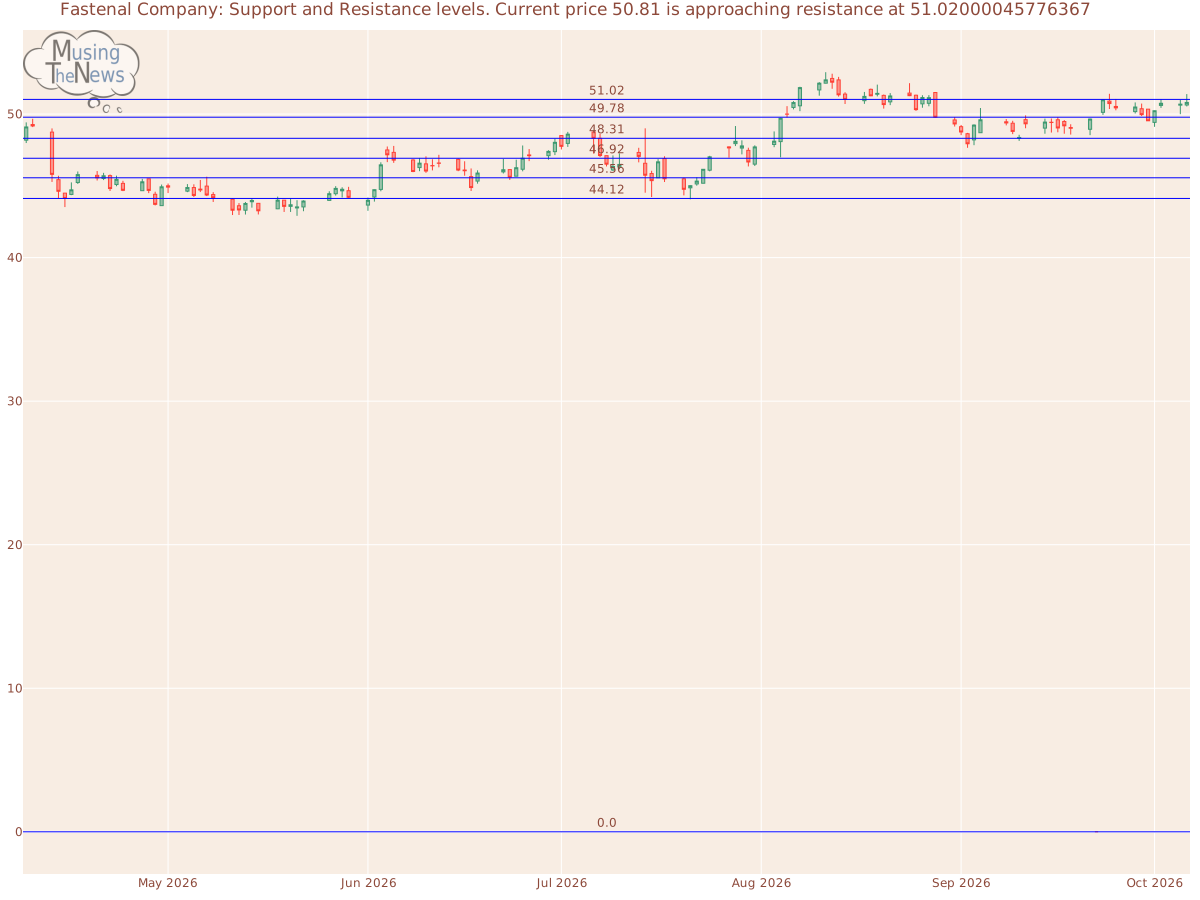
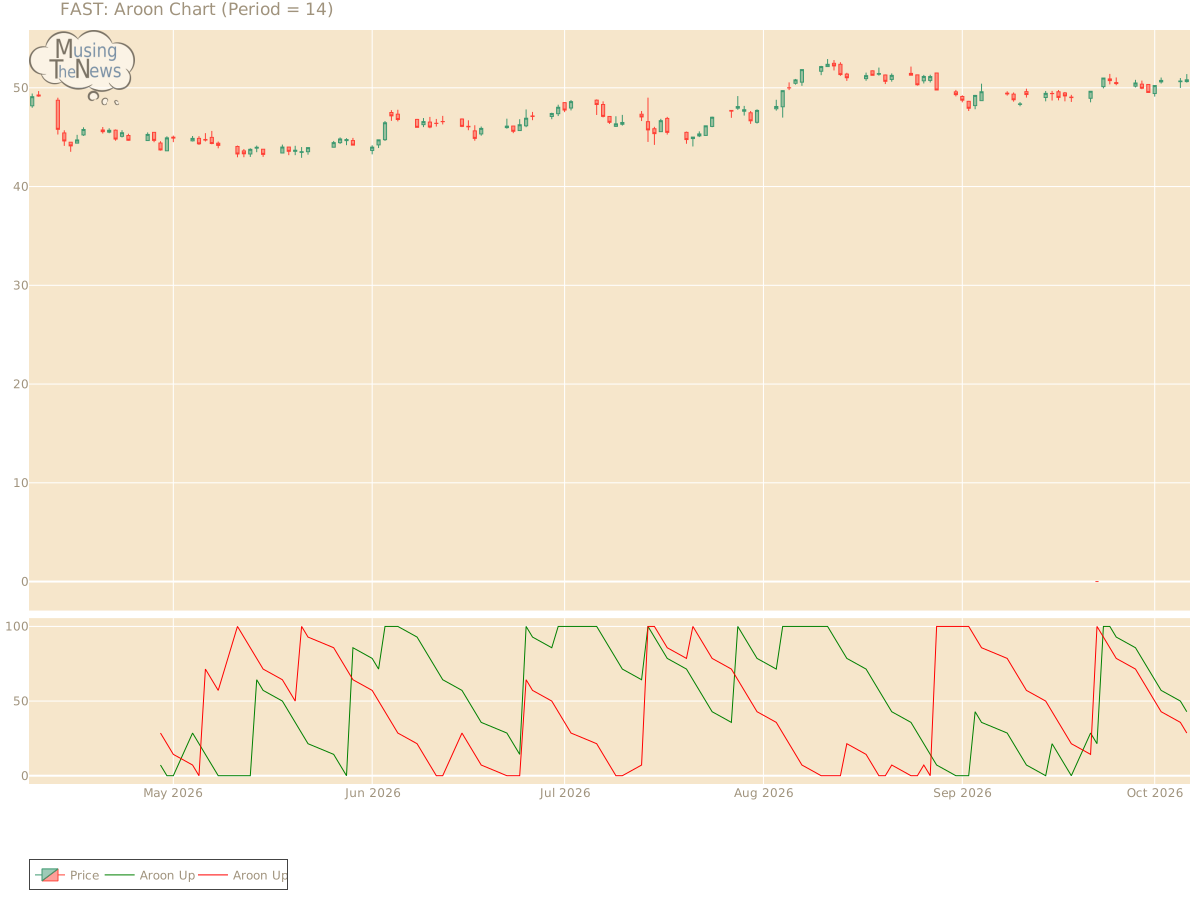
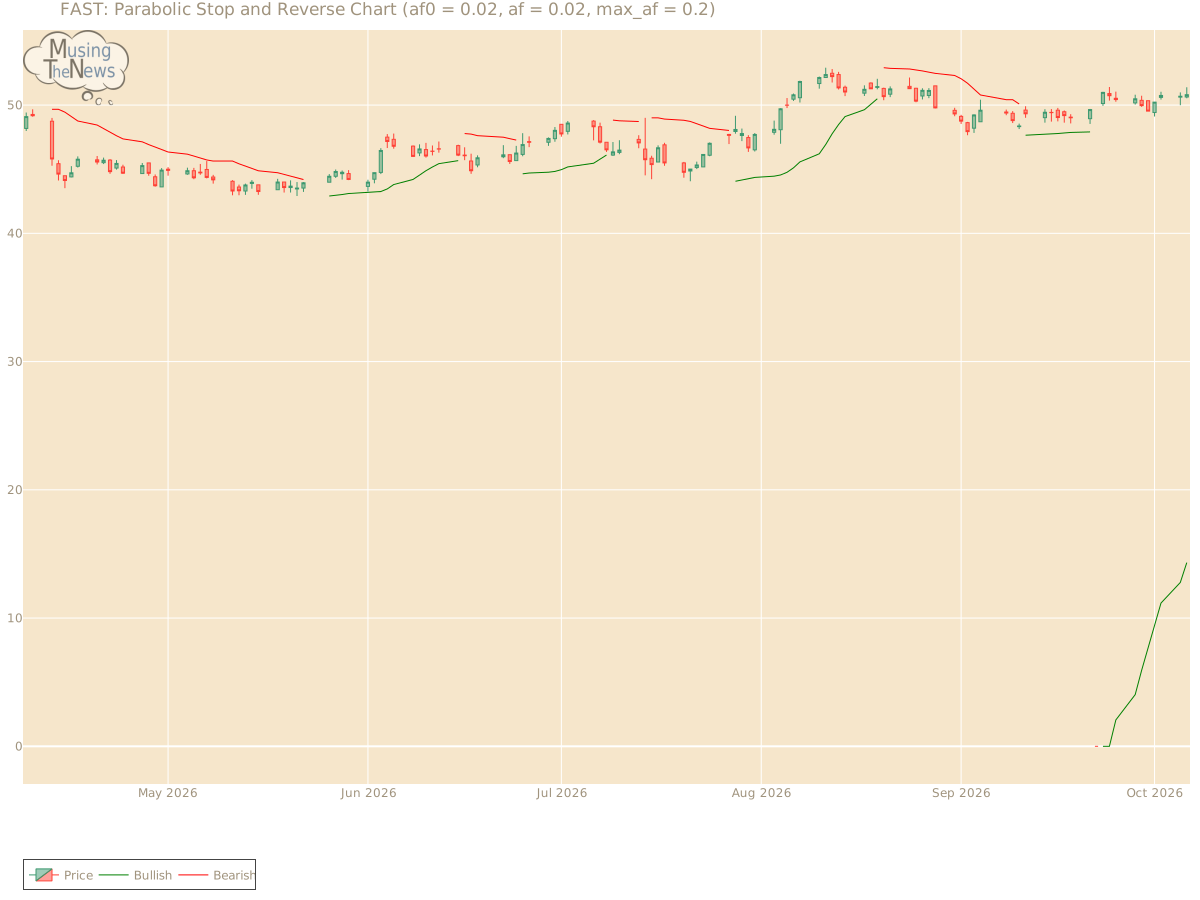
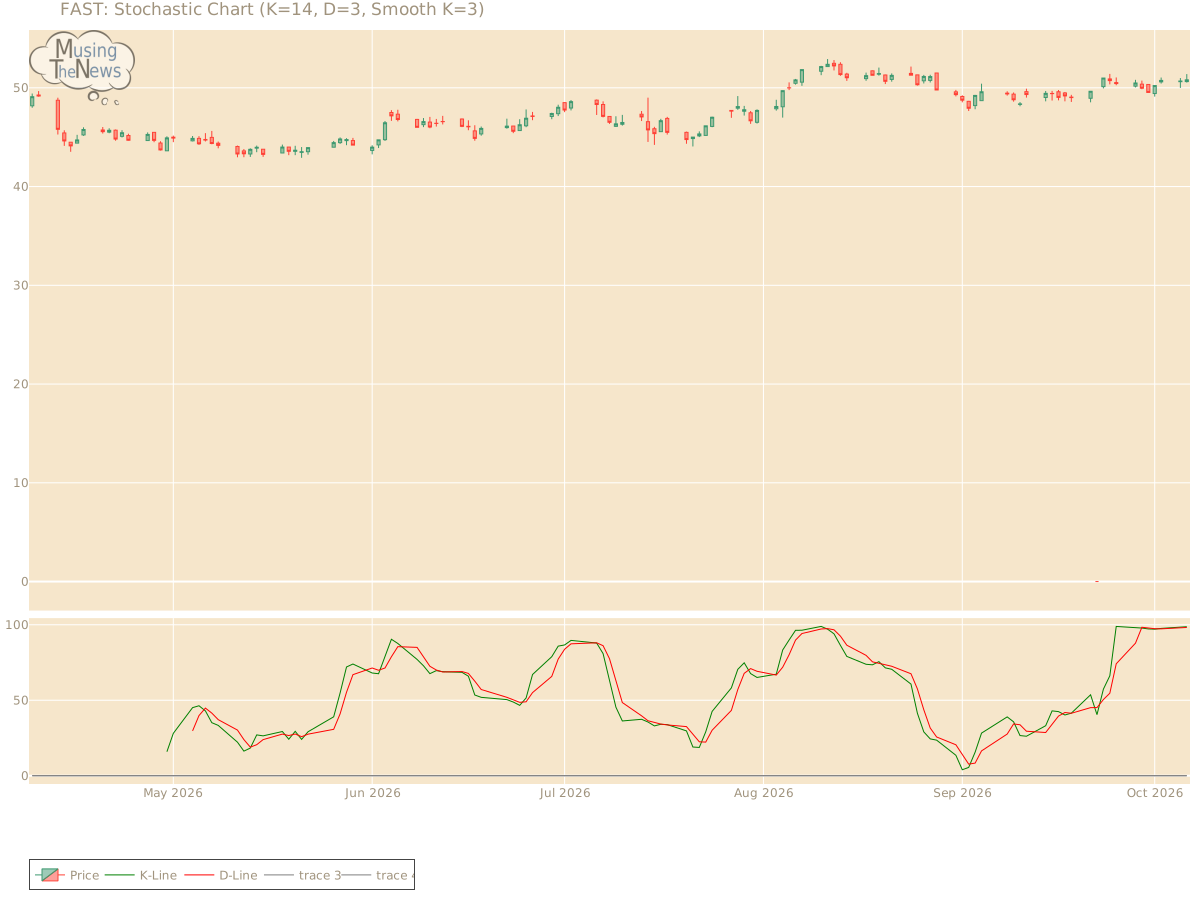
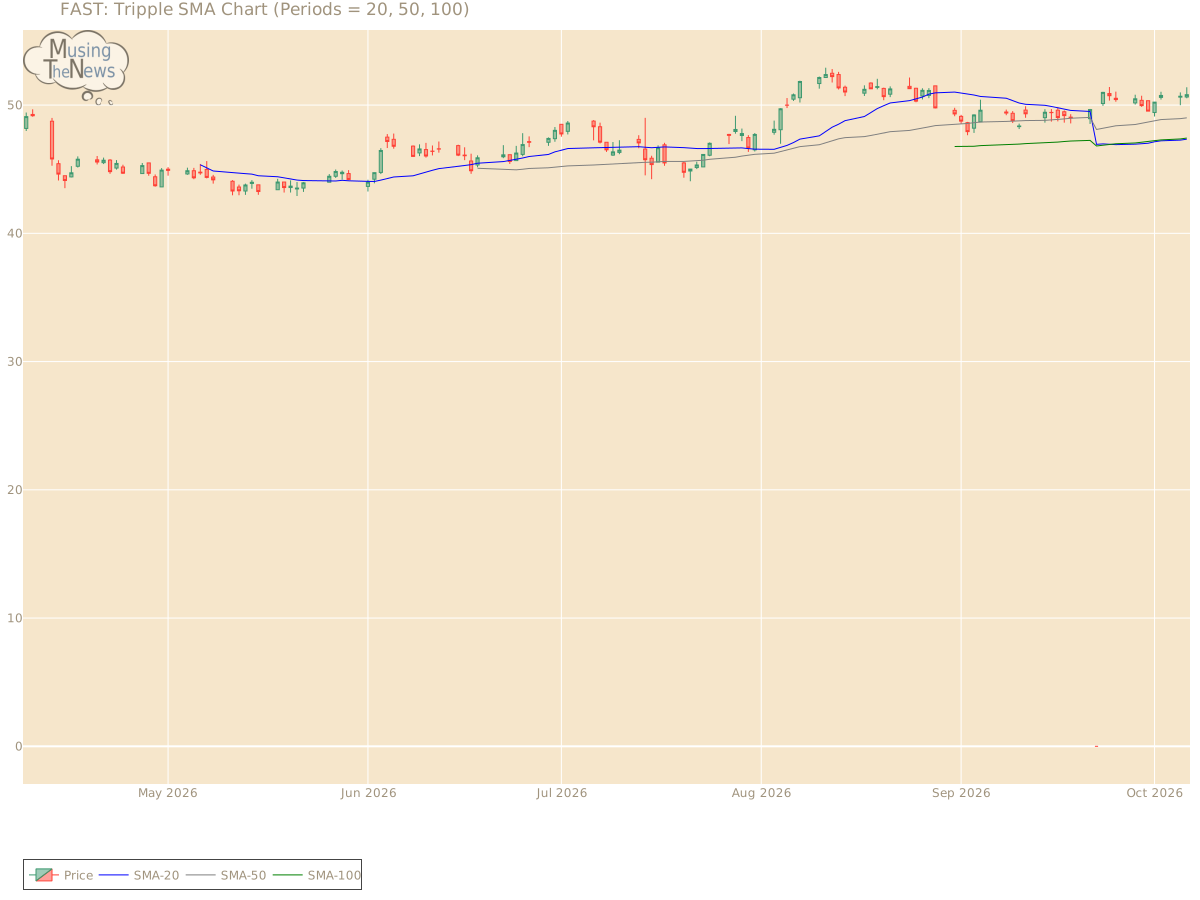
Support and Resistance: The price for FAST at 50.81 finds support at 49.78 and resistance at 51.02. This suggests a trading range, where 49.78 serves as a support level and 51.02 acts as a resistance point, potentially capping further gains.Support/Resistance for FASTAroon: The AROON is in a neutral stance, not pointing to a clear trend in either direction. This suggests that the market may be lacking strong momentum, making it difficult to predict the next move.Aroon chart for Fastenal CompanyBol. Bands: The BOLL BANDS is showing a neutral stance, not indicating a clear upward or downward trend for Fastenal Company. This suggests a period of market balance, where neither side is showing dominance.Bolinger Bands chart for Fastenal CompanyParabolic SAR: The PSAR remains bullish, setting a critical support level that may help sustain the market's upward trend. This persistent bullish outlook suggests that the market is likely to continue climbing, with the support level offering a foundation for further growth.Parabolic Stop and Reverse chart for Fastenal CompanyStochastic: The stochastic indicator is in a bullish mode, with the K-line crossing above the D-line and the 80 level for FAST. This alignment suggests strong upward momentum, indicating that the market may continue to trend higher. Investors could interpret this as a positive sign of sustained market growth.Stochastic chart for Fastenal CompanyTripple Moving Agerage: The current state of the Tripple MOVING AVG is neutral, providing no clear signals for either an upward or downward movement. This indicates that the market may be in a state of equilibrium, with no strong momentum in either direction.Tripple SMA chart for Fastenal Company To accurately interpret a company's technical data, it is important to first examine its fundamentals. These include financial performance, management quality, and growth prospects. In addition, understanding the dynamics of the industry in which the company operates—such as competition, market trends, and regulatory factors—provides further insights. This combined analysis helps create a fuller picture, allowing for more precise conclusions to be drawn from the company's technical performance and stock behavior.