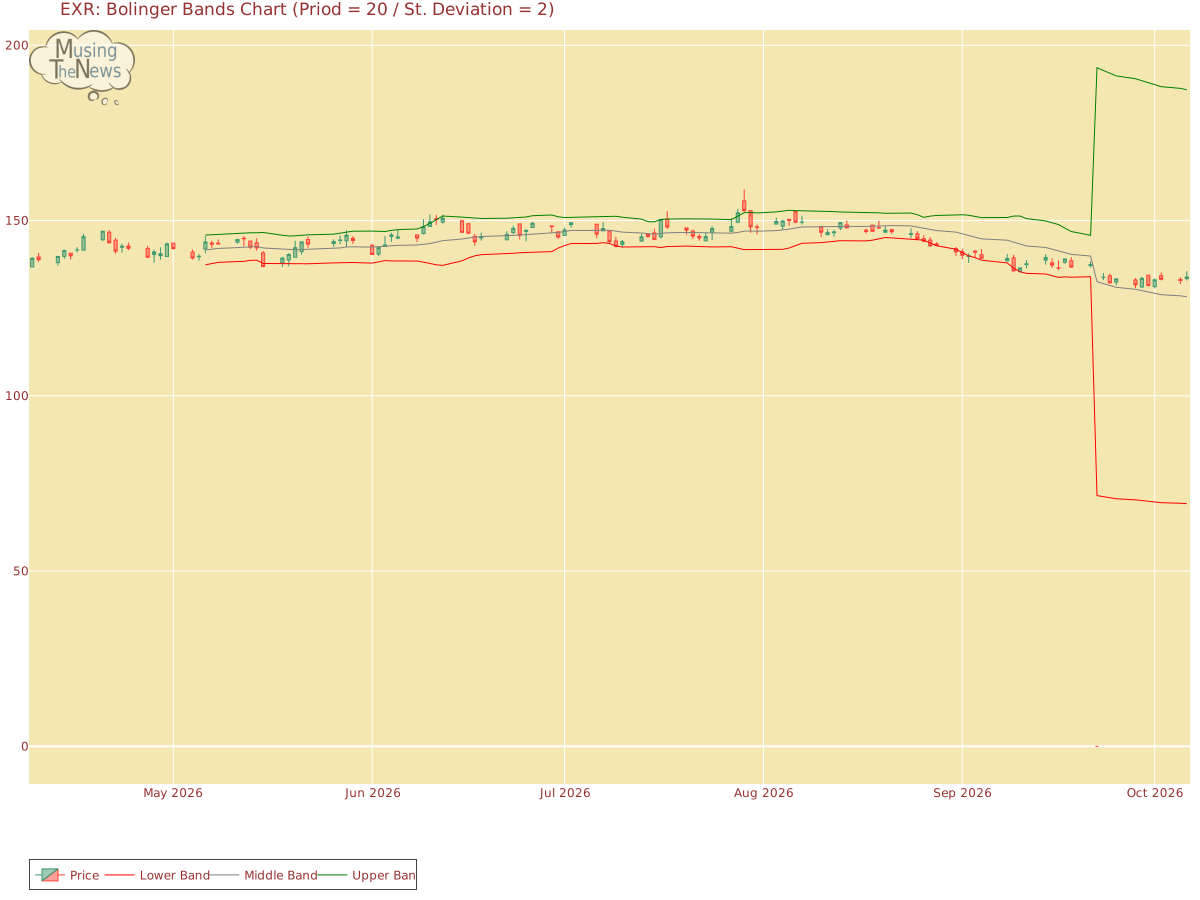
The BOLL BANDS is currently neutral, offering no clear guidance on market direction. This suggests that the market may be in a state of pause, with no strong trend emerging...
By MusingTheNews
Updated 2026-10-07 23:26:14
Overall Technical outlook
Price Summary
On 2026-10-06, Extra Space Storage Inc.'s stock opened at 133.45, reached a high of 135.54, dropped to a low of 132.91, and closed higher 0.33% at 133.89, with a trading volume of 1688800 shares. In the past year, the highest stock price was 152.85, and the lowest was 0.0.
Technicals
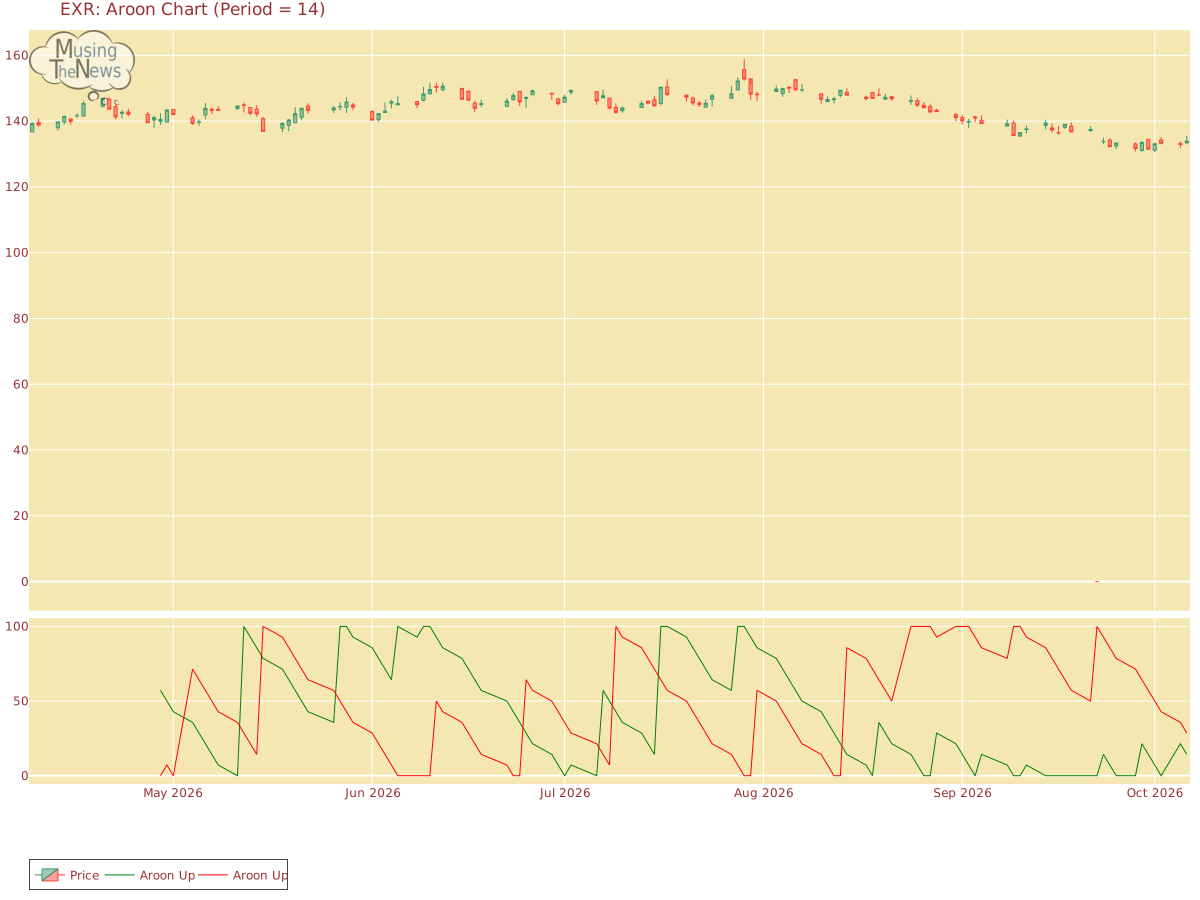
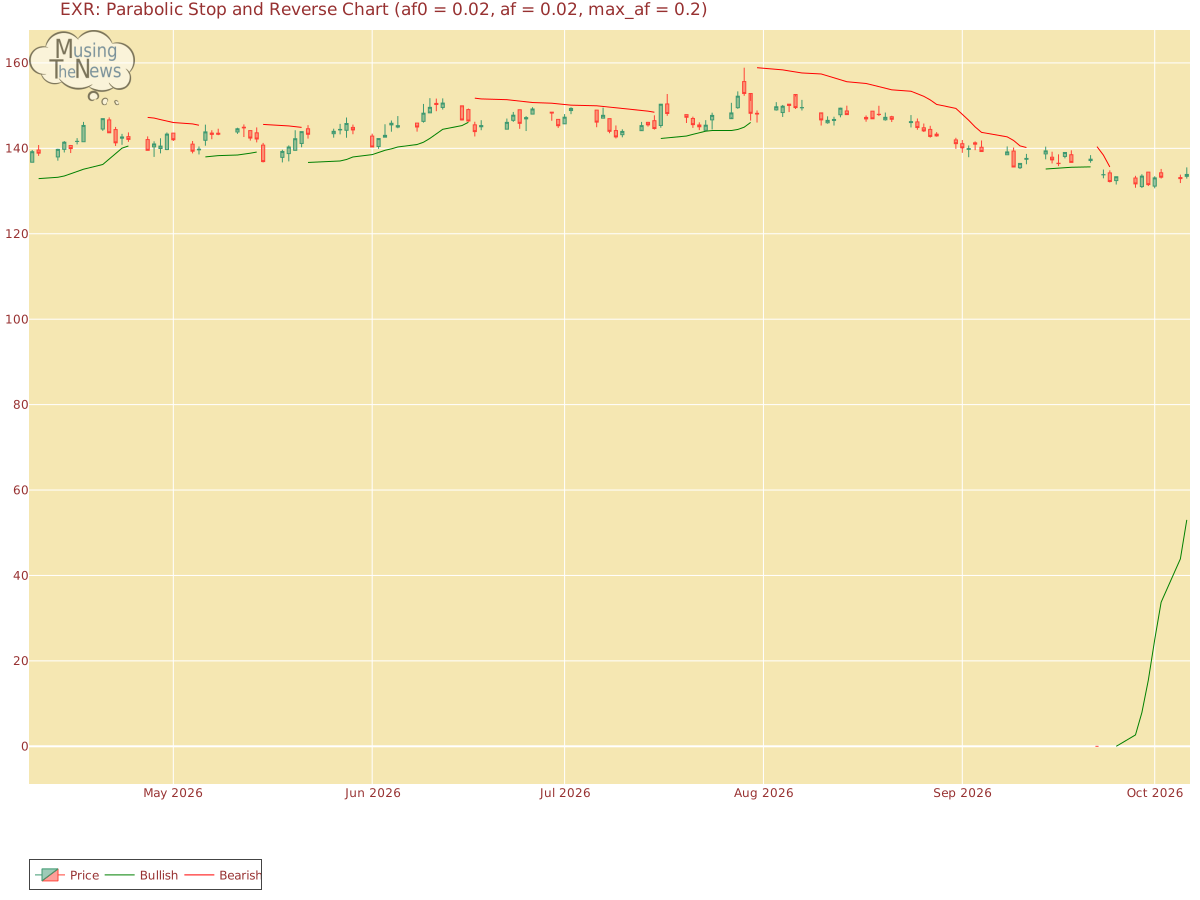
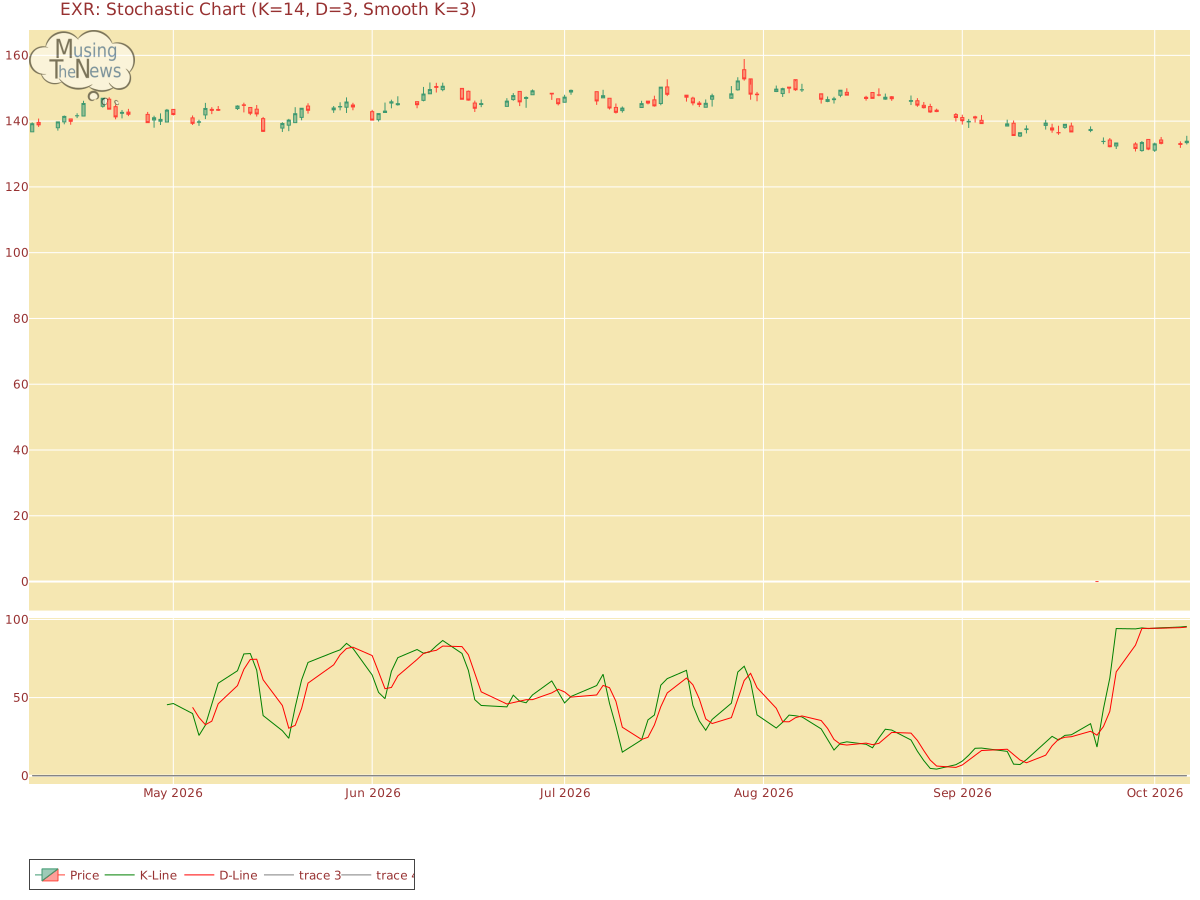
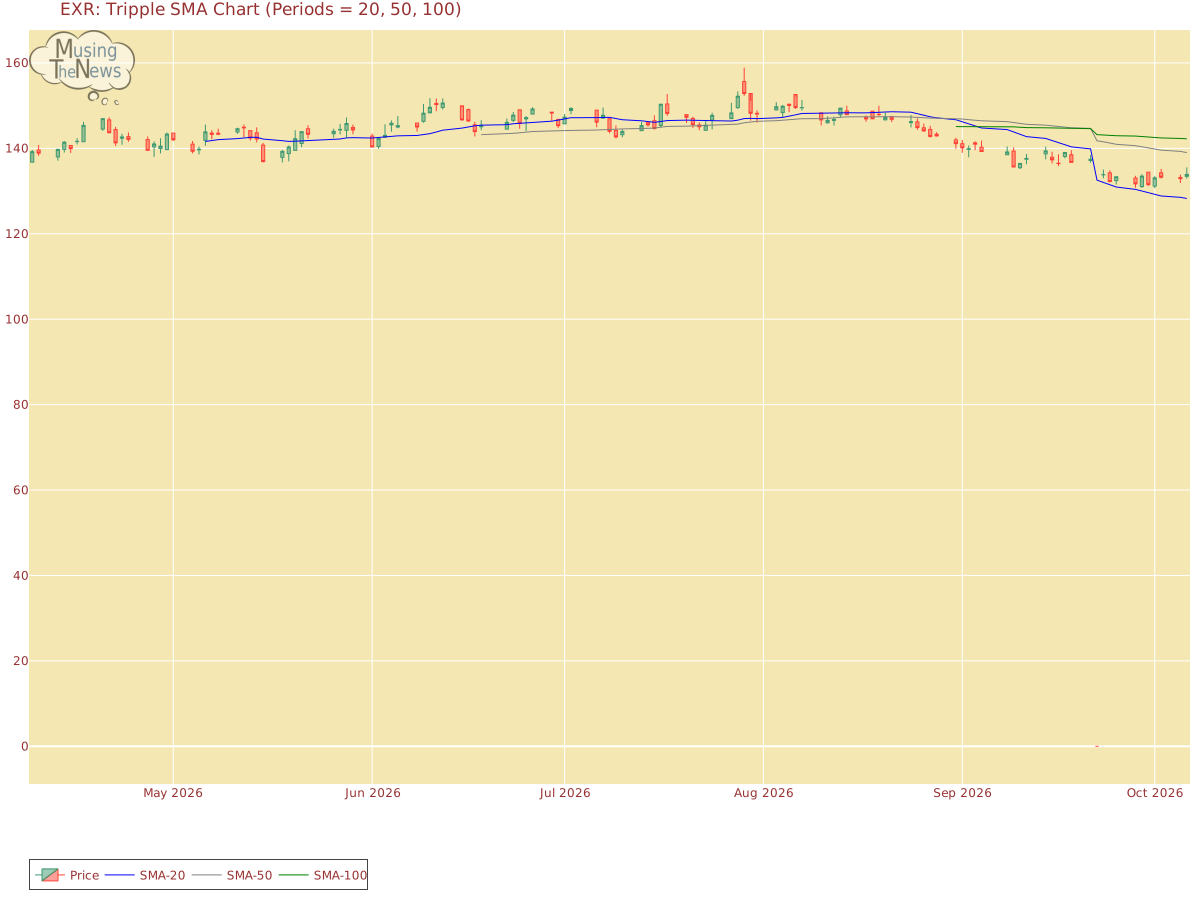
Aroon: The AROON is in a neutral stance, with no clear direction indicated for the market. This lack of clarity suggests that the market may be in a state of equilibrium for EXR, with no strong trend emerging.Aroon chart for Extra Space Storage Inc.Bol. Bands: The BOLL BANDS is currently neutral, offering no clear guidance on market direction. This suggests that the market may be in a state of pause, with no strong trend emerging.Bolinger Bands chart for Extra Space Storage Inc.Parabolic SAR: The PSAR for EXR maintains its bullish outlook, setting a strong support level that could underpin further gains. This suggests that the market is likely to continue its upward trajectory, with the established support providing a safety net for ongoing bullish momentum.Parabolic Stop and Reverse chart for Extra Space Storage Inc.Stochastic: The stochastic indicator shows a bullish signal, with the K-line exceeding both the D-line and the 80 mark. This setup suggests strong upward momentum, implying that the market may continue to rise. Investors could consider this a favorable sign for continued market growth for Extra Space Storage Inc..Stochastic chart for Extra Space Storage Inc.Tripple Moving Agerage: A bullish trend is reflected in the alignment of the 20-50-100 period moving averages, though the slopes of the faster averages hint at a possible reversal. This weakening momentum suggests that while the overall trend is still upward, traders should be cautious of a potential shift in the near future.Tripple SMA chart for Extra Space Storage Inc. A thorough analysis of a company involves looking at both its fundamentals and technical data. The fundamentals, including revenue, profitability, and management quality, offer insight into the company's long-term value. Additionally, understanding the broader industry context, such as market competition and regulatory challenges, helps to better interpret the company's stock performance. By combining both fundamental and technical analysis, you can derive more meaningful inferences about the company's future prospects.