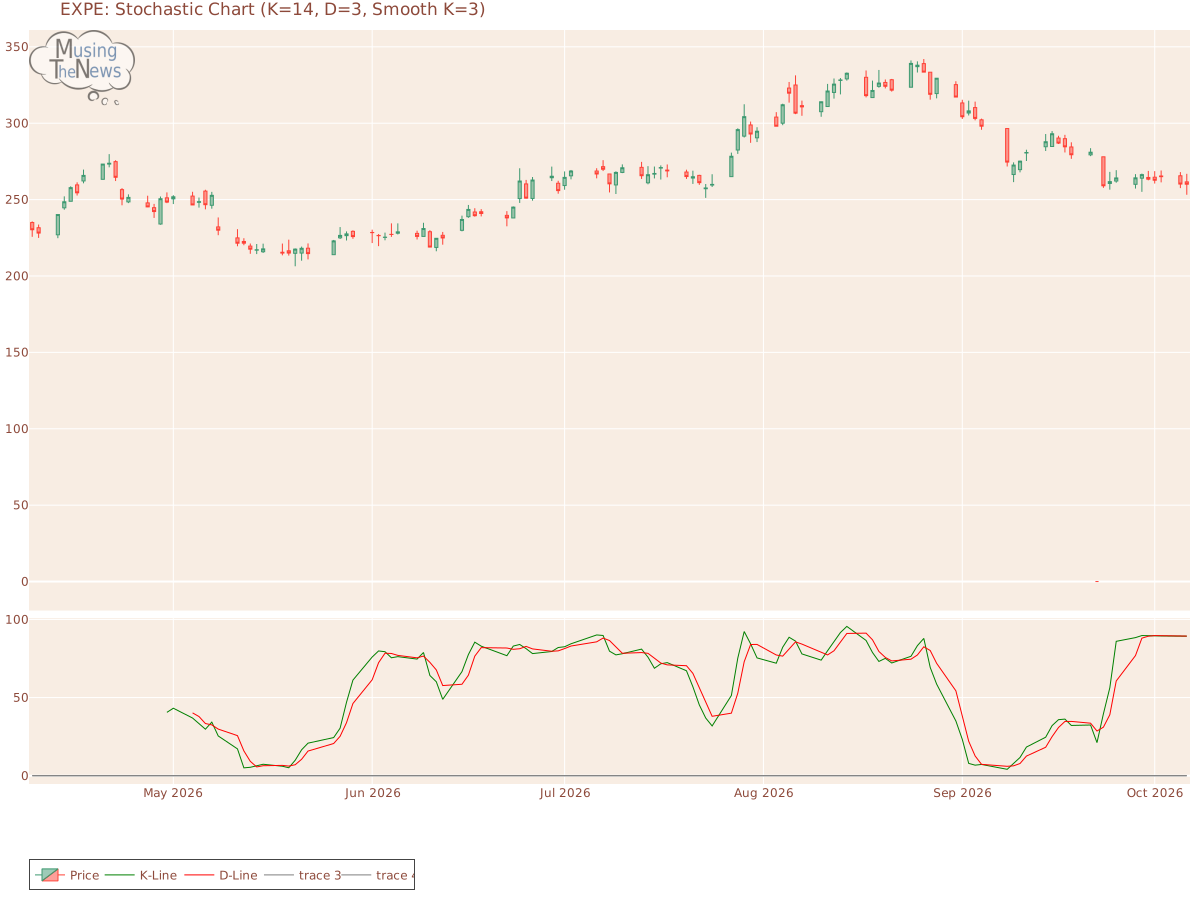
The stochastic indicator for EXPE shows the K-line falling below the D-line, while remaining above 80, suggesting a possible beginning of a bearish price move. This configu...
By MusingTheNews
Updated 2026-10-07 23:26:14
Overall Technical outlook
Price Summary
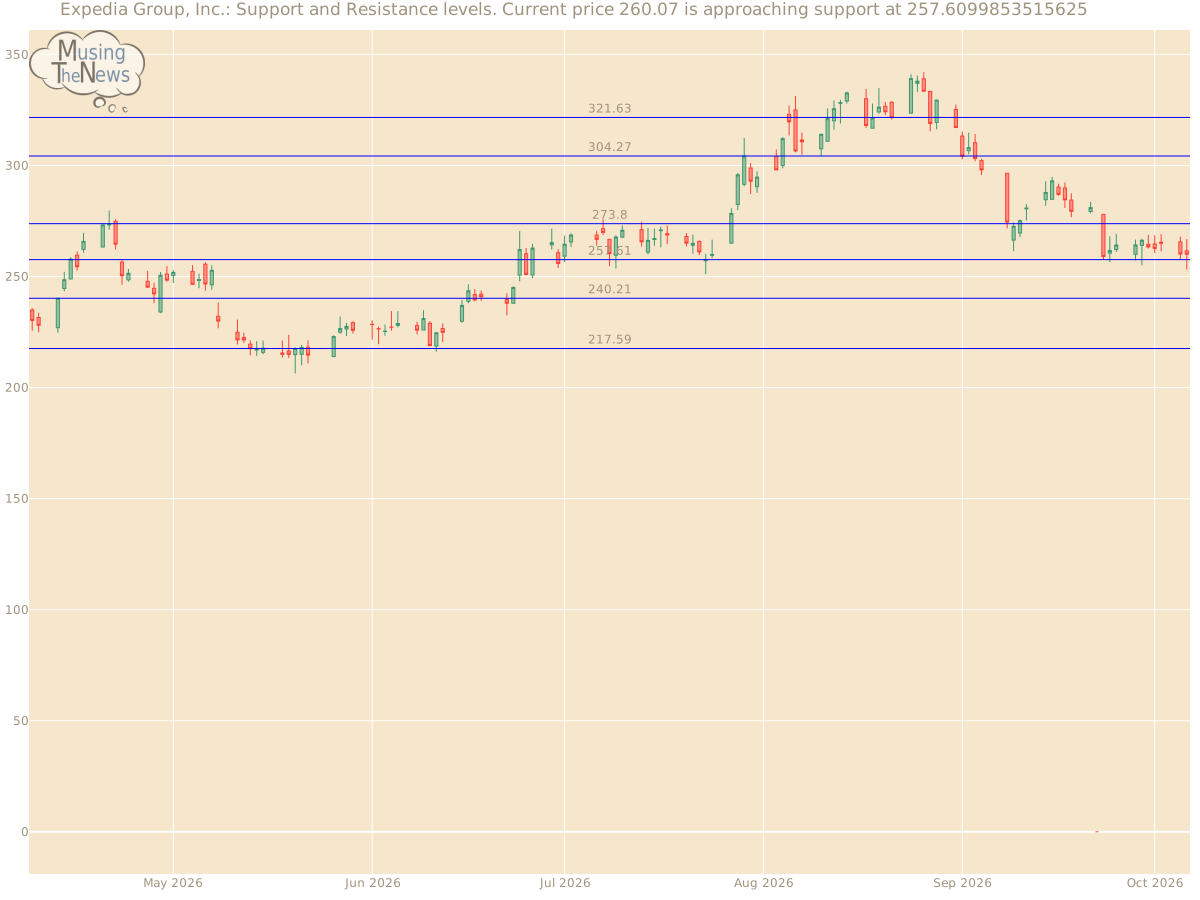
Expedia Group, Inc.'s stock started the year at 261.6, climbed to a high of 266.88, fell to 253.16, and closed -0.58% lower at 260.07, with 1662500 shares traded on 2026-10-06. The stock's highest price over the 52-week span is 339.13, while the lowest price is 0.0.
Technicals
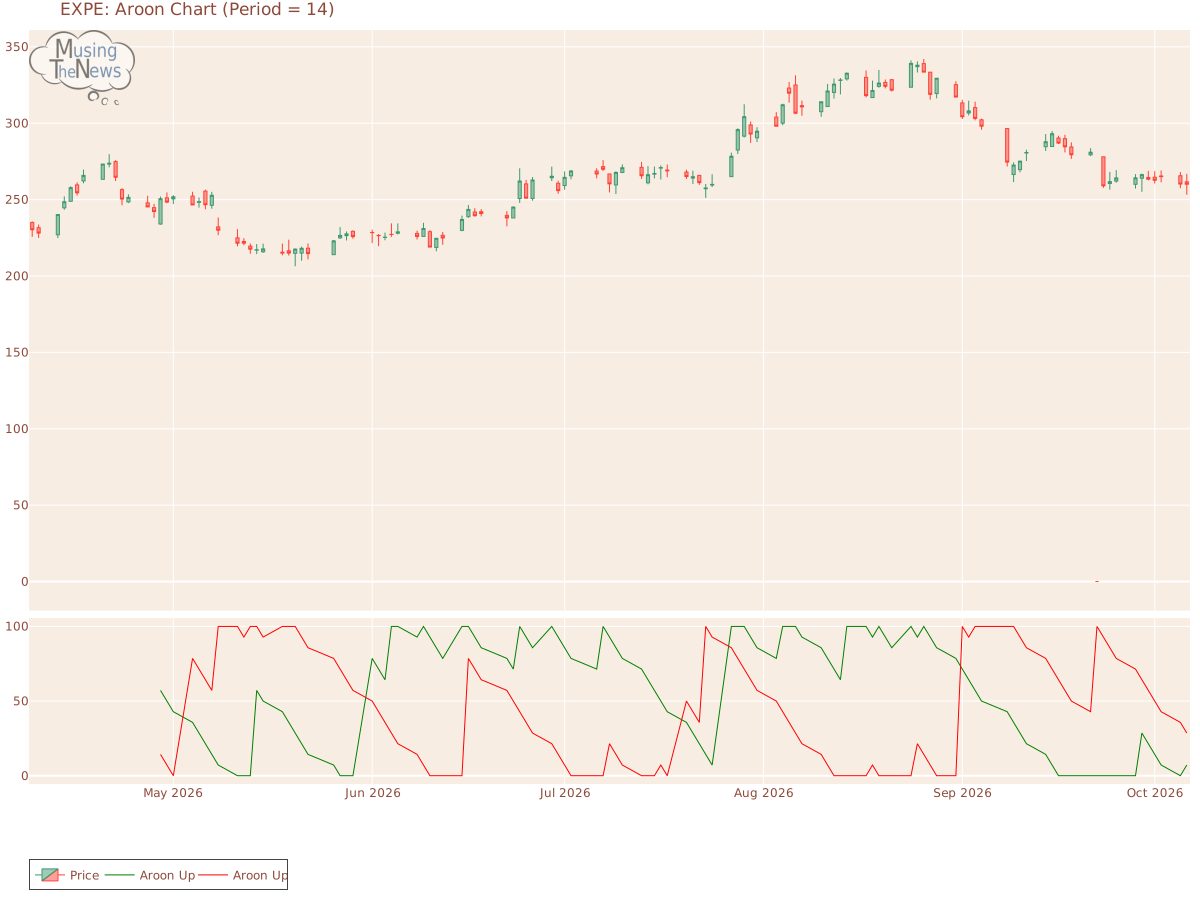
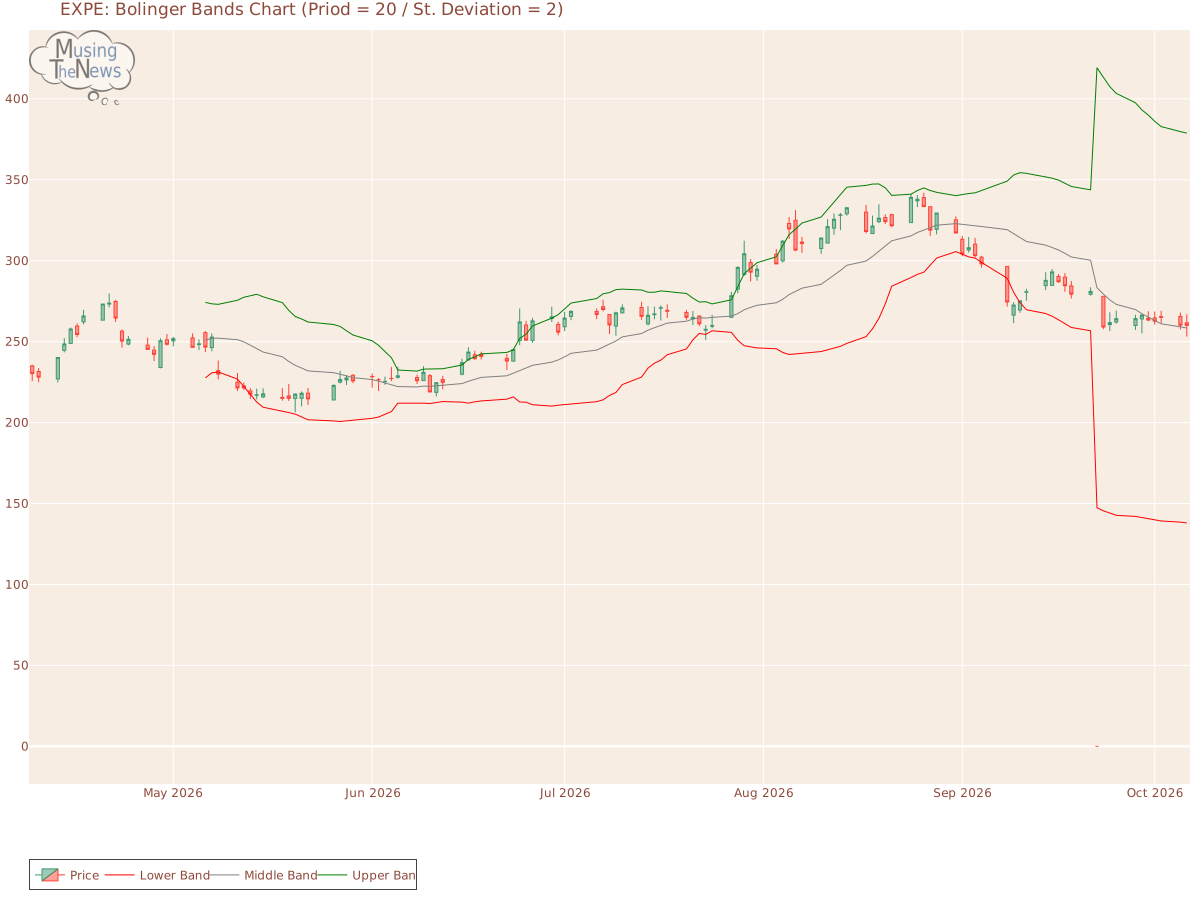
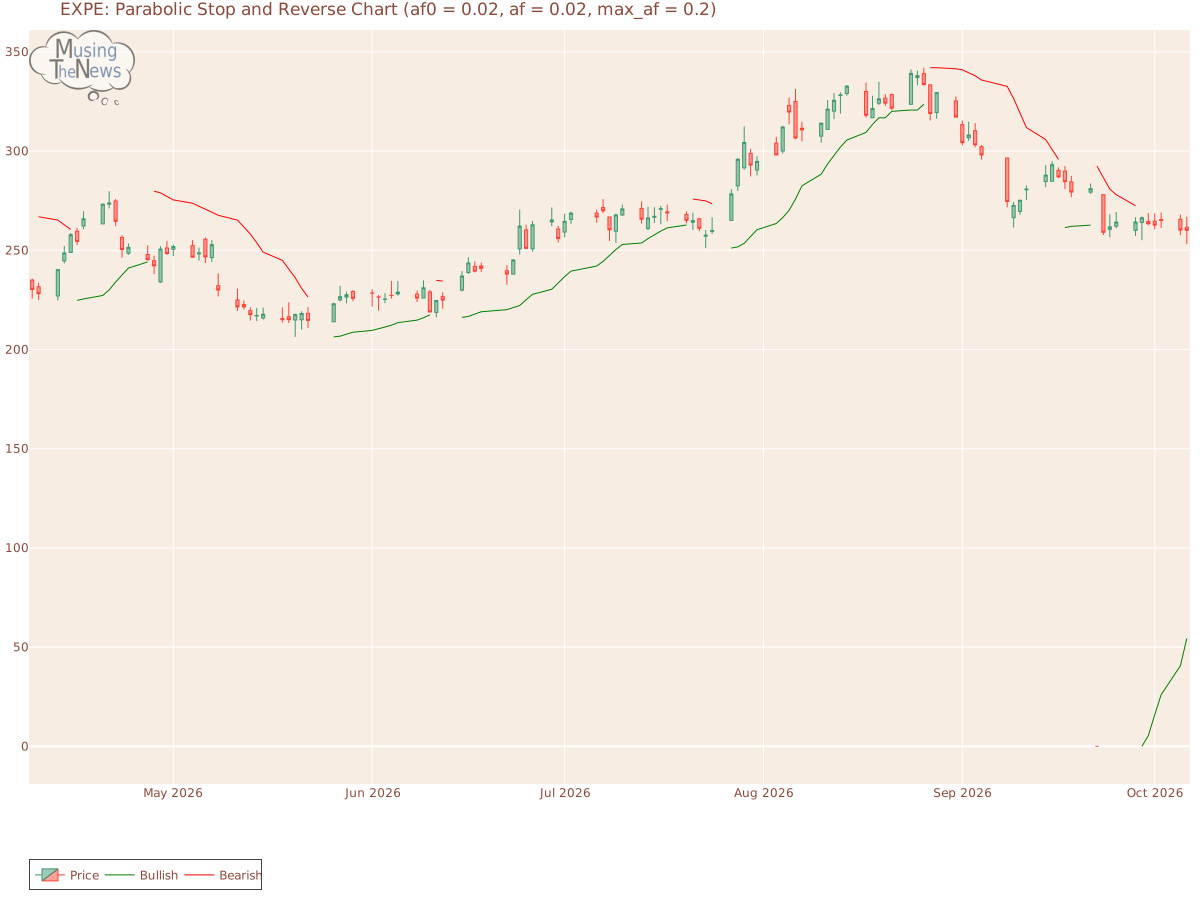
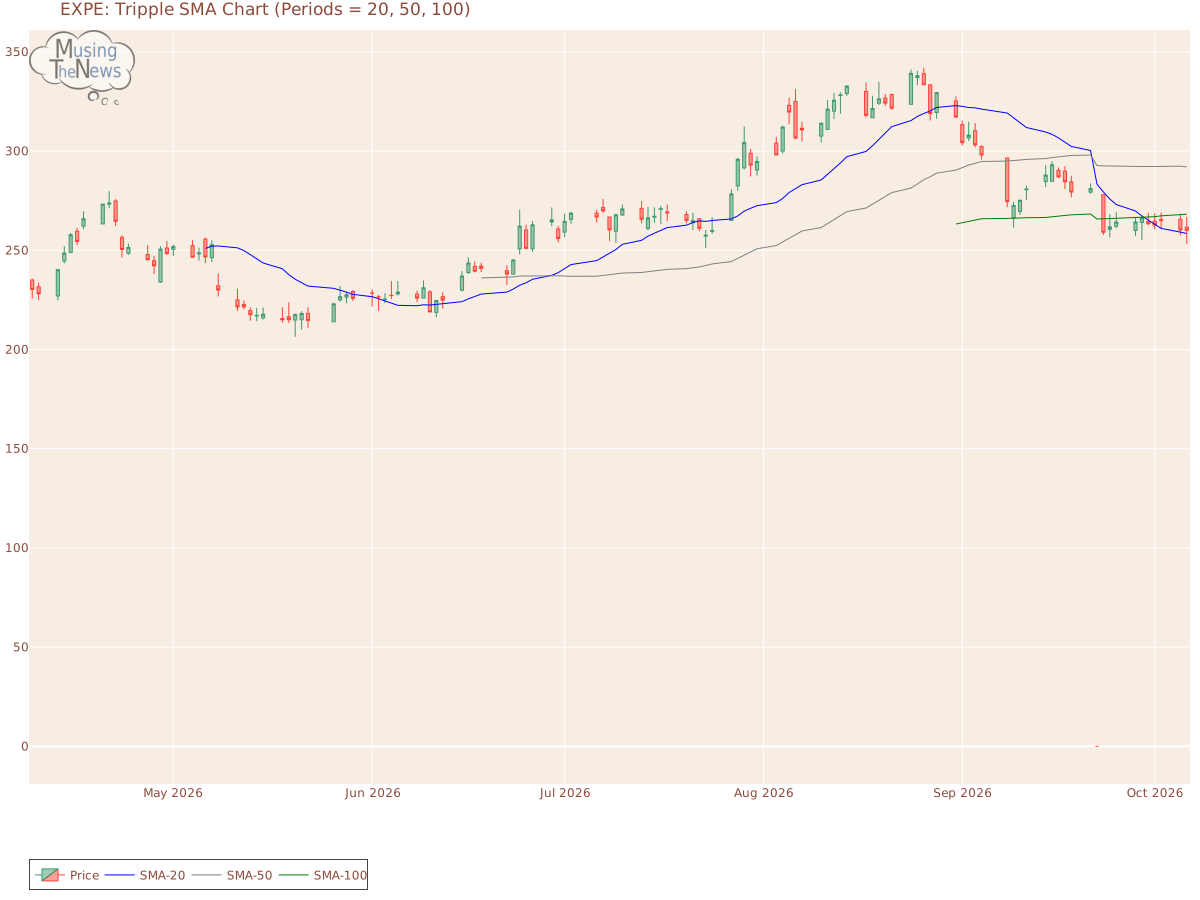
Support and Resistance: At 260.07, the price is supported at 257.61 and faces resistance at 273.8. This range suggests that the price for EXPE might stay between these levels, with 257.61 acting as a floor and 273.8 as a ceiling.Support/Resistance for EXPEAroon: The current state of the AROON is neutral, offering no clear signals of movement in either direction. This suggests a potential pause in market activity, with no strong trend emerging at the moment.Aroon chart for Expedia Group, Inc.Bol. Bands: The current state of the BOLL BANDS is neutral, offering no clear signals of movement in either direction. This suggests a potential pause in market activity, with no strong trend emerging at the moment.Bolinger Bands chart for Expedia Group, Inc.Parabolic SAR: The PSAR remains bullish, reinforcing a significant support level. This steady support suggests that the market's upward trend may continue, providing a solid foundation for potential gains for EXPE. Investors might see this as an opportunity to capitalize on the ongoing bullish sentiment.Parabolic Stop and Reverse chart for Expedia Group, Inc.Stochastic: The stochastic indicator for EXPE shows the K-line falling below the D-line, while remaining above 80, suggesting a possible beginning of a bearish price move. This configuration may indicate that the market's upward momentum is losing steam, potentially leading to a downward trend. Traders should watch closely for further confirmation of this shift.Stochastic chart for Expedia Group, Inc.Tripple Moving Agerage: The Tripple MOVING AVG is in a neutral stance, with no clear signals for movement up or down. This neutral position indicates a potential period of consolidation or uncertainty in the market.Tripple SMA chart for Expedia Group, Inc. To properly assess the technical data of a company, it's important to first look at its fundamentals, such as its earnings, growth potential, and management effectiveness. Equally, understanding the industry trends, competition, and external economic factors that influence the company is vital. This holistic view helps draw meaningful conclusions about the company's technical performance, allowing investors to better gauge its stock price behavior, volatility, and market trends.