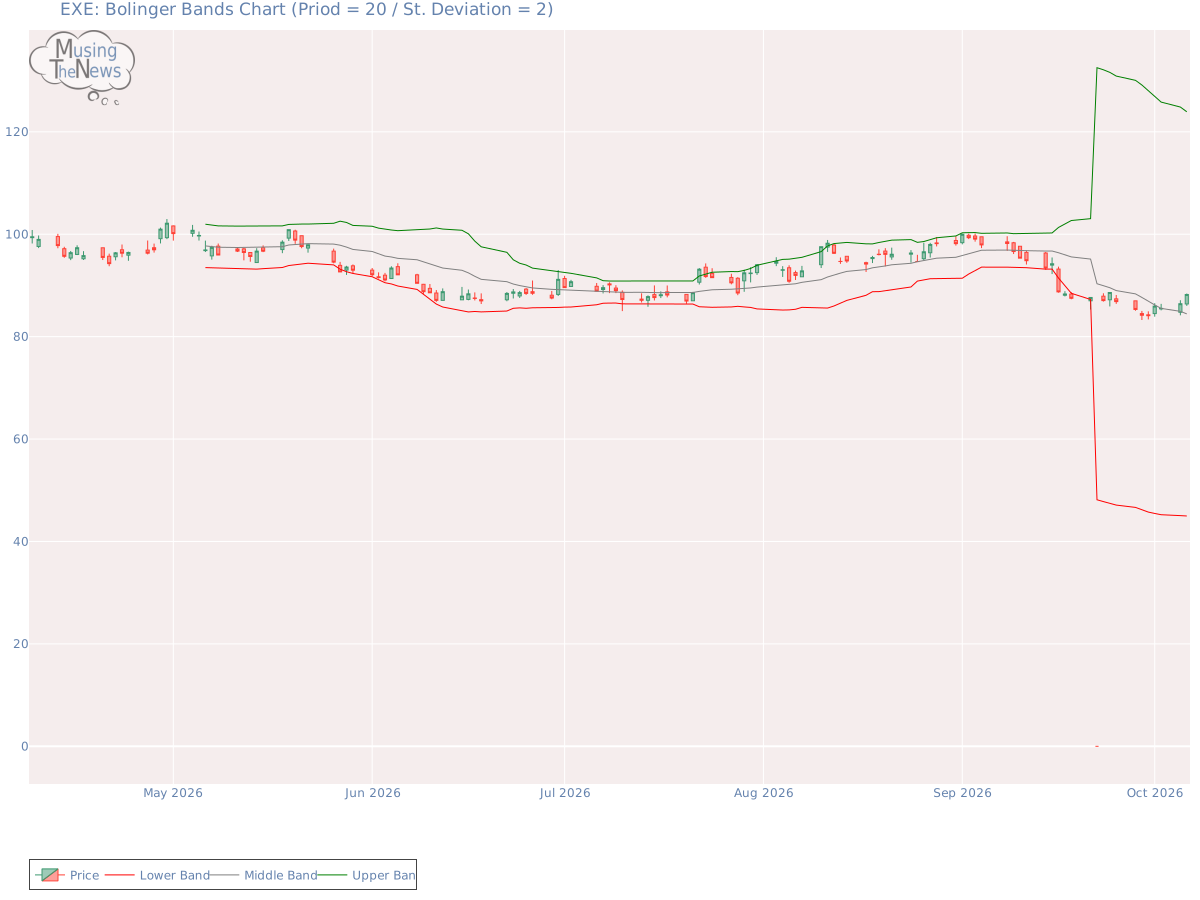
The BOLL BANDS is in a neutral stance, with no clear direction indicated for the market. This lack of clarity suggests that the market may be in a state of equilibrium for ...
By MusingTheNews
Updated 2026-10-07 23:26:14
Overall Technical outlook
Price Summary
EXE's shares experienced a significant 2.14% rise, indicating a stellar market performance. On 2026-10-06, Expand Energy Corporation's stock began at 86.38, peaked at 88.42, bottomed at 86.0, and closed 2.14% higher at 88.23, with a volume of 2173100 shares. The stock's peak price over the last 52 weeks is 122.89, with the lowest being 0.0.
Technicals
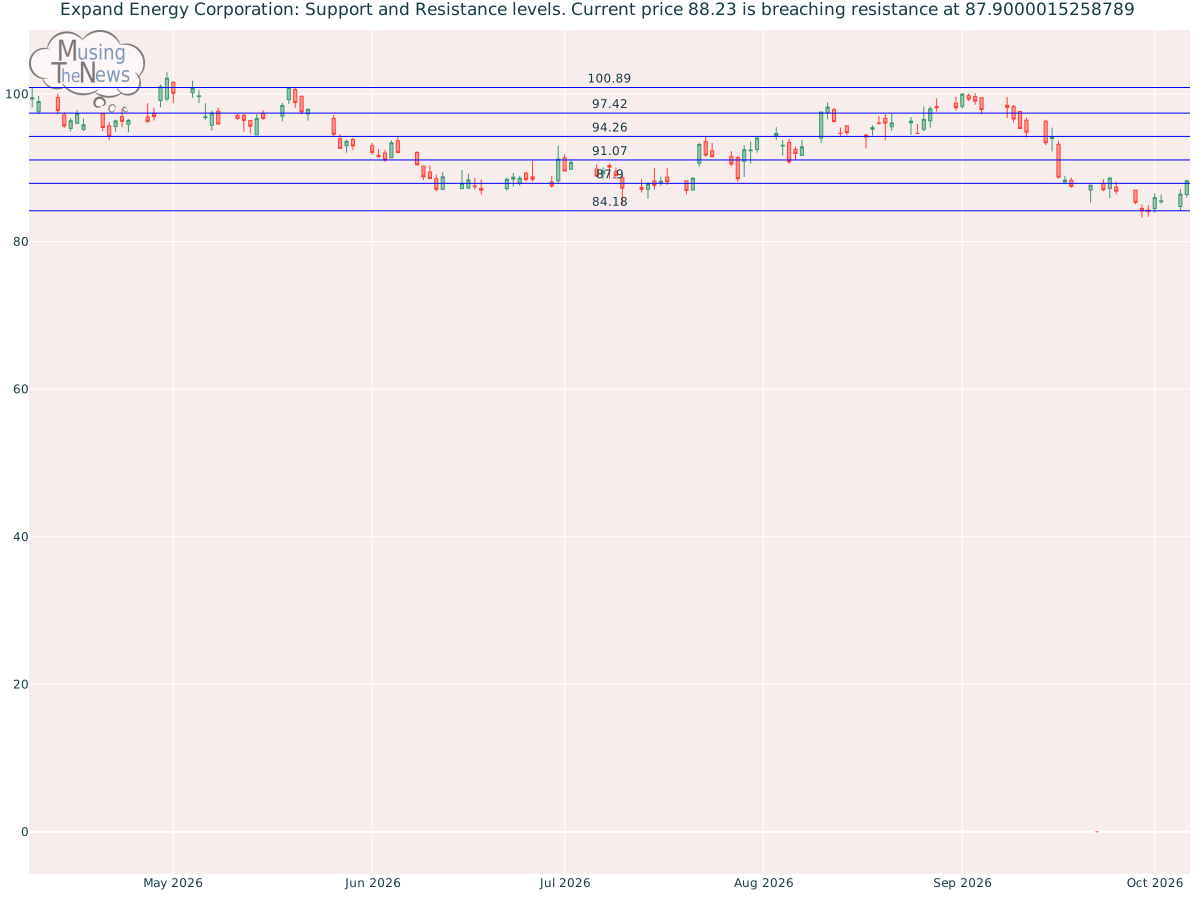
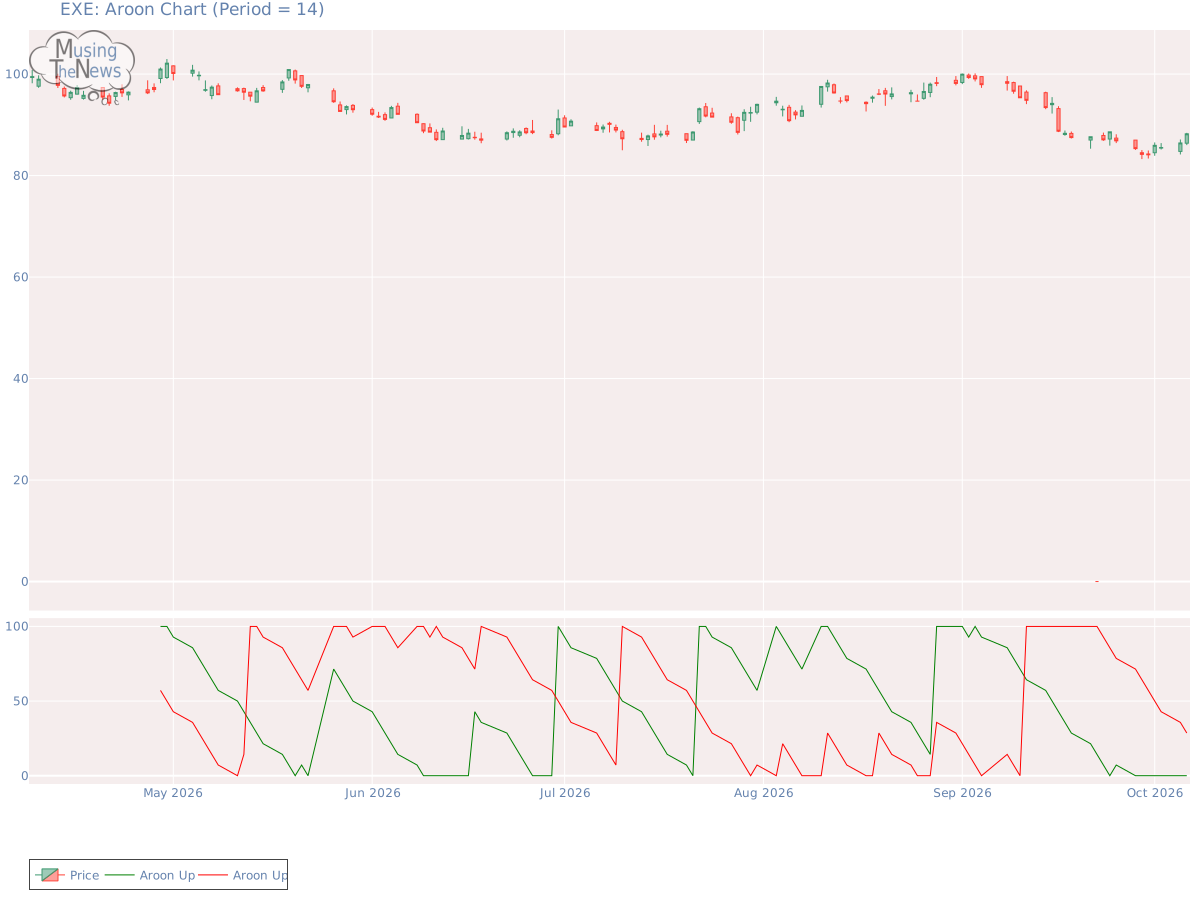
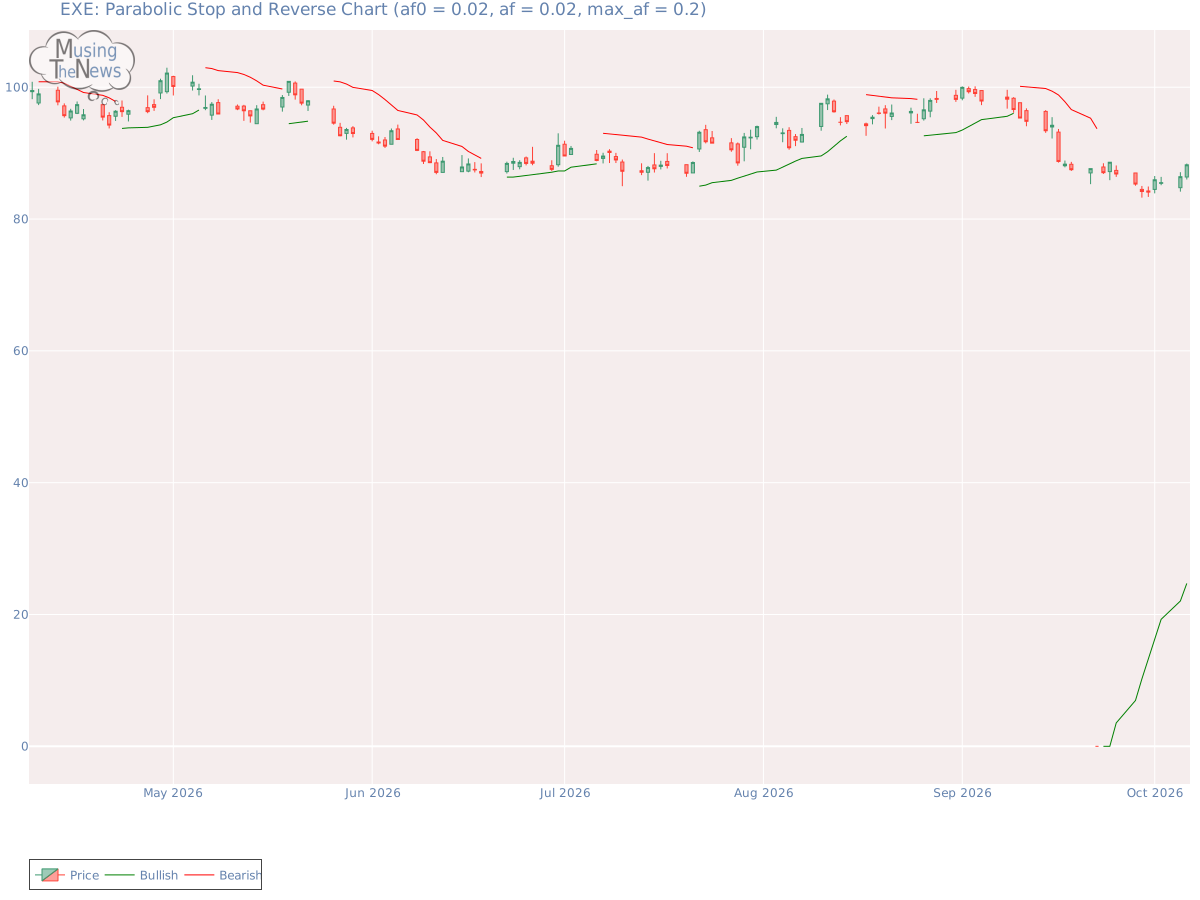
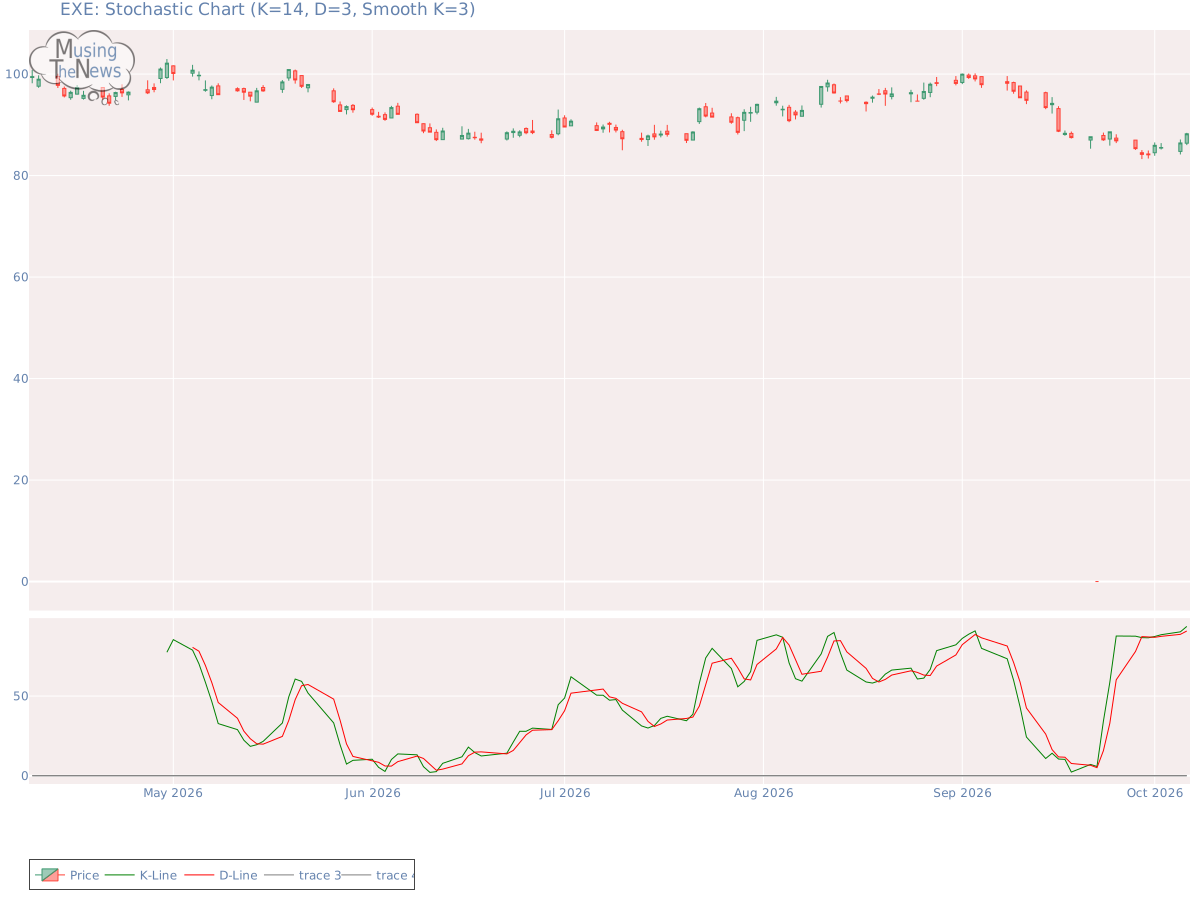
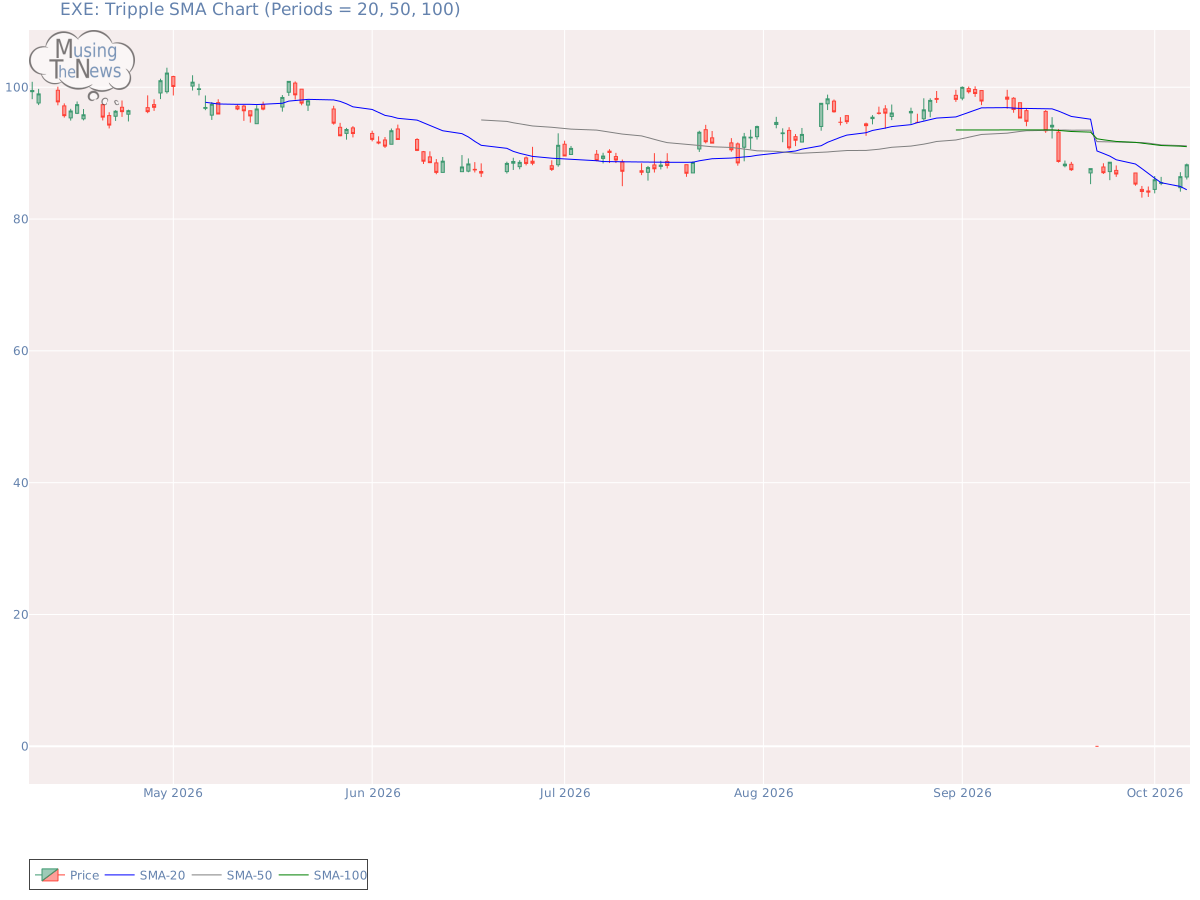
Support and Resistance: The current price of 88.23 is supported at 87.9, with resistance at 91.07. This suggests that the price for EXE might remain between these levels, where 87.9 acts as a floor and 91.07 as a ceiling in the market.Support/Resistance for EXEAroon: The AROON is currently in a neutral position, offering no clear indication of movement up or down. This suggests that the market may be experiencing a period of equilibrium, with no strong trend in play.Aroon chart for Expand Energy CorporationBol. Bands: The BOLL BANDS is in a neutral stance, with no clear direction indicated for the market. This lack of clarity suggests that the market may be in a state of equilibrium for EXE, with no strong trend emerging.Bolinger Bands chart for Expand Energy CorporationParabolic SAR: The PSAR maintains its bullish stance, setting a significant support level that could help sustain the market's upward movement. This strong support suggests that Expand Energy Corporation is likely to continue trending higher, providing investors with confidence in the ongoing bullish momentum.Parabolic Stop and Reverse chart for Expand Energy CorporationStochastic: The stochastic indicator for Expand Energy Corporation reflects a bullish sentiment, as the K-line is above both the D-line and the 80 threshold. This setup points to strong upward momentum, implying that the market may continue to rise. Traders could consider this as an indication of sustained bullish activity.Stochastic chart for Expand Energy CorporationTripple Moving Agerage: The current state of the Tripple MOVING AVG is neutral, providing no clear signals for either an upward or downward movement. This indicates that the market may be in a state of equilibrium, with no strong momentum in either direction.Tripple SMA chart for Expand Energy Corporation To make the most of a company's technical analysis, it's important to start with an understanding of its fundamentals. These include profitability, cash flow, and competitive positioning. Additionally, the industry in which the company operates plays a critical role, as trends and external factors can influence its market performance. By considering both the company's internal fundamentals and the external industry environment, more meaningful and accurate conclusions can be drawn from the technical data.