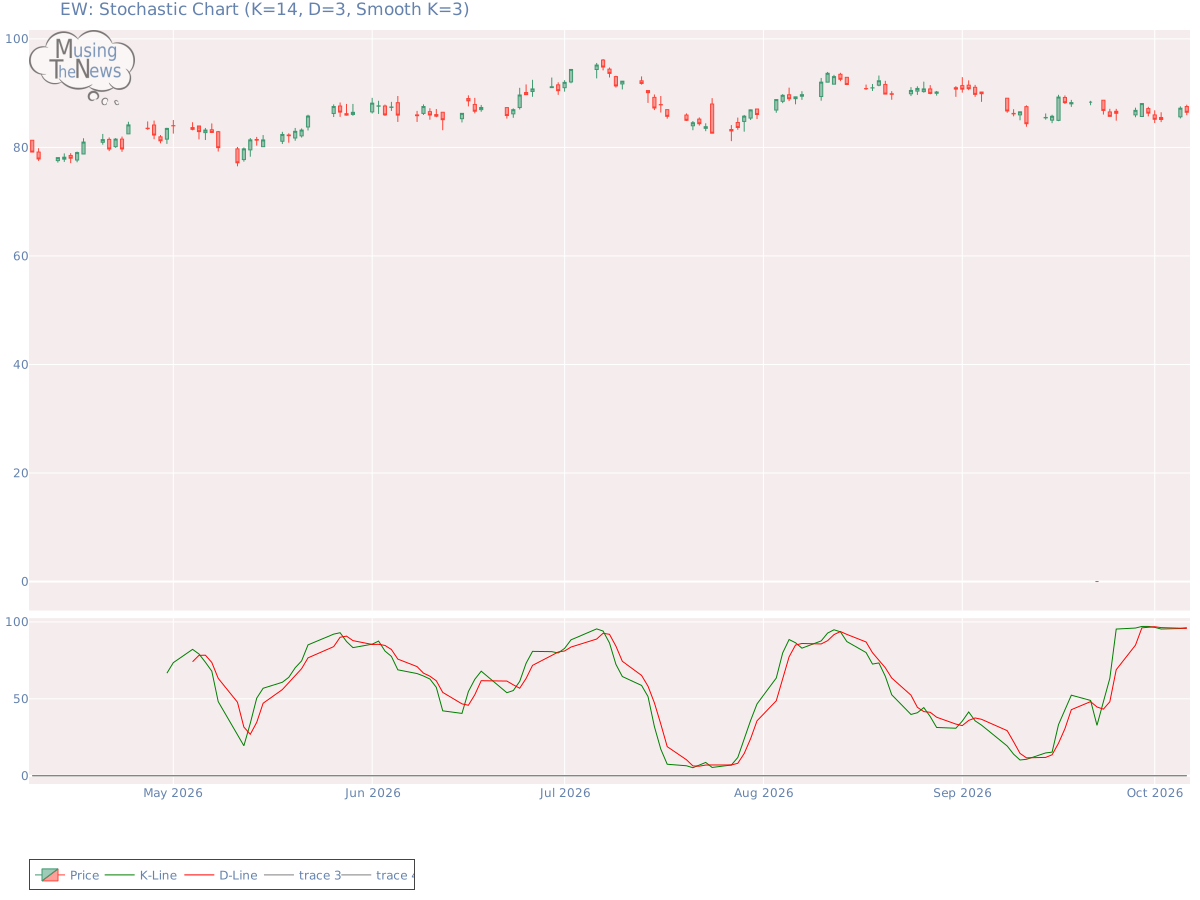
The stochastic indicator for EW shows a bullish signal, with the K-line positioned above the D-line and also above the 80 mark. This suggests strong upward momentum, indica...
By MusingTheNews
Updated 2026-10-07 23:26:10
Overall Technical outlook
Price Summary
Edwards Lifesciences Corporation's stock began trading at 87.54 on 2026-10-06, soared to 87.88, dipped to 85.94, and finished the day -1.21% down at 86.48, with 3383200 shares exchanged. The highest price the stock achieved in the past 52 weeks is 95.18, while the lowest price it saw is 0.0.
Technicals
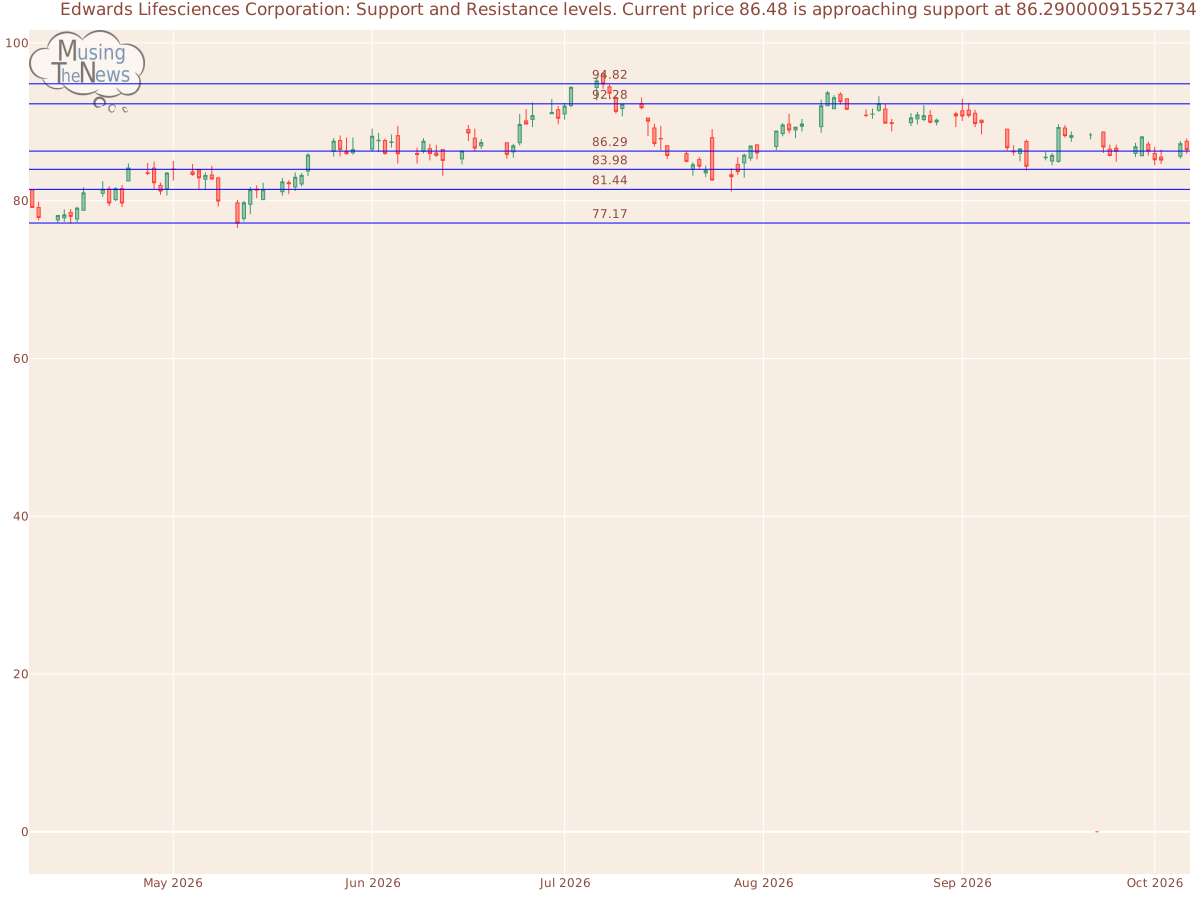
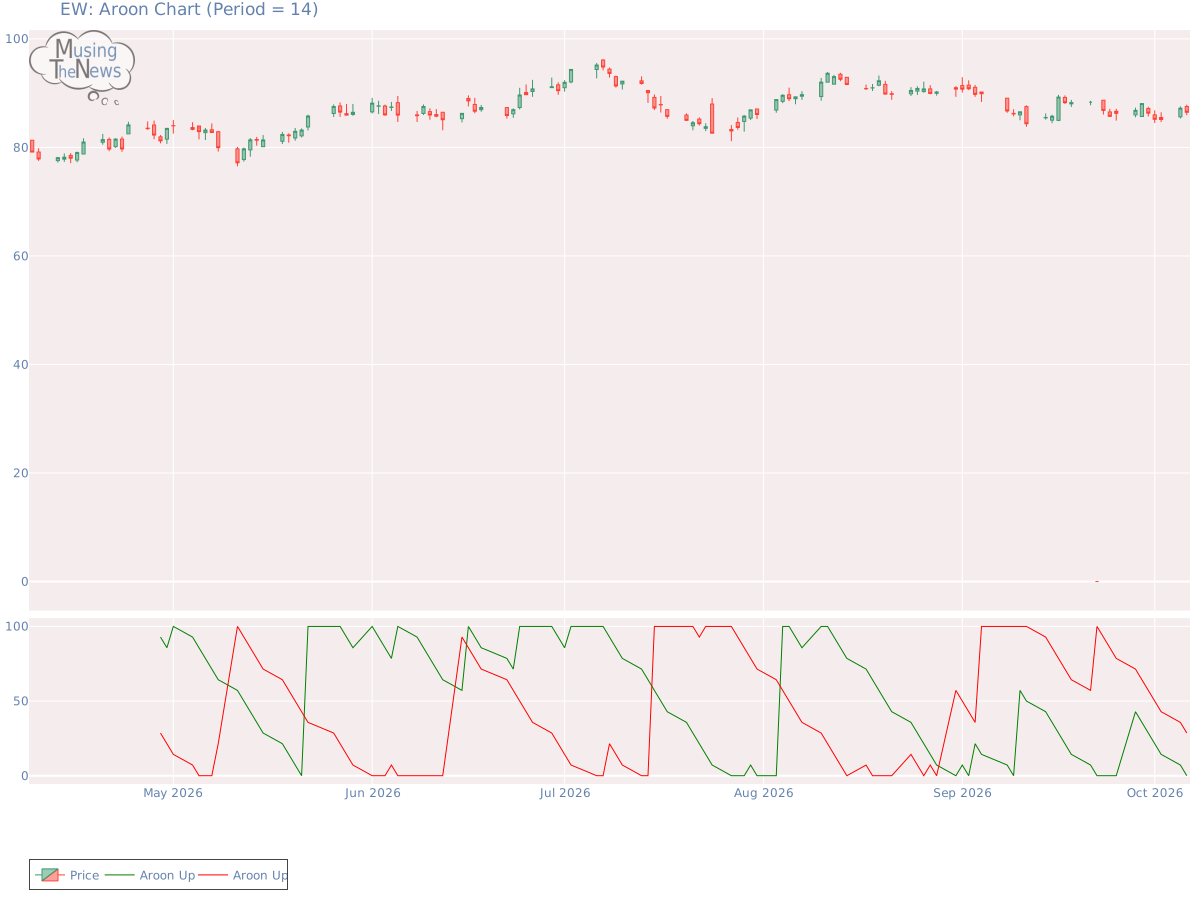
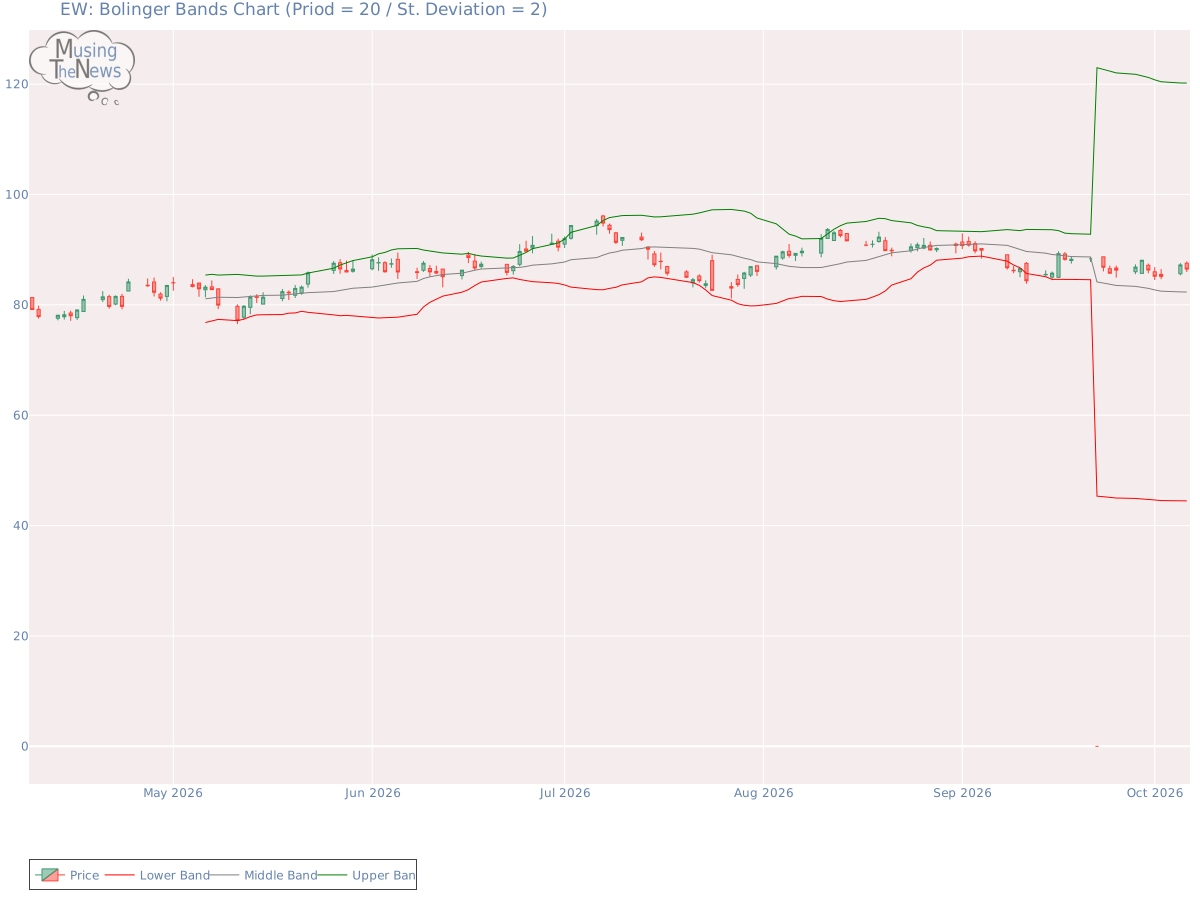
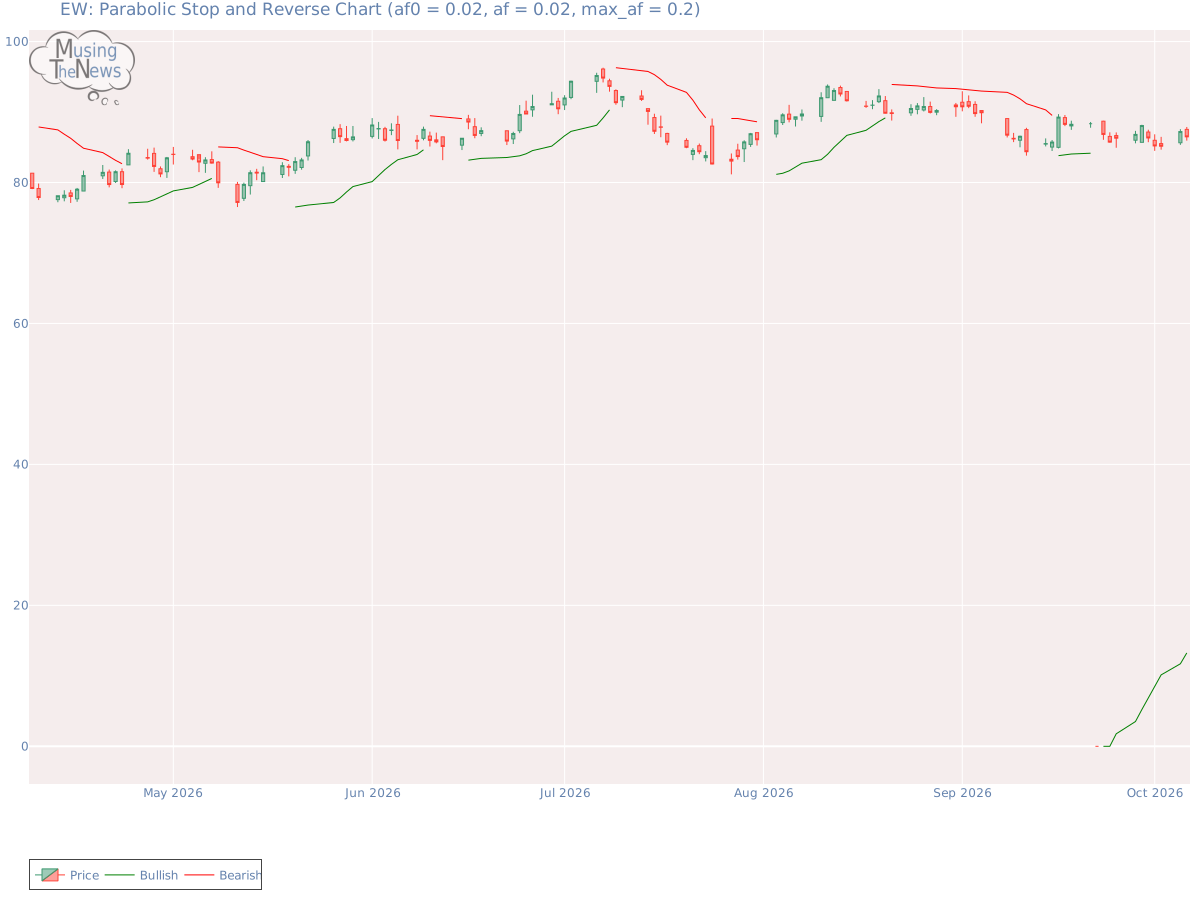
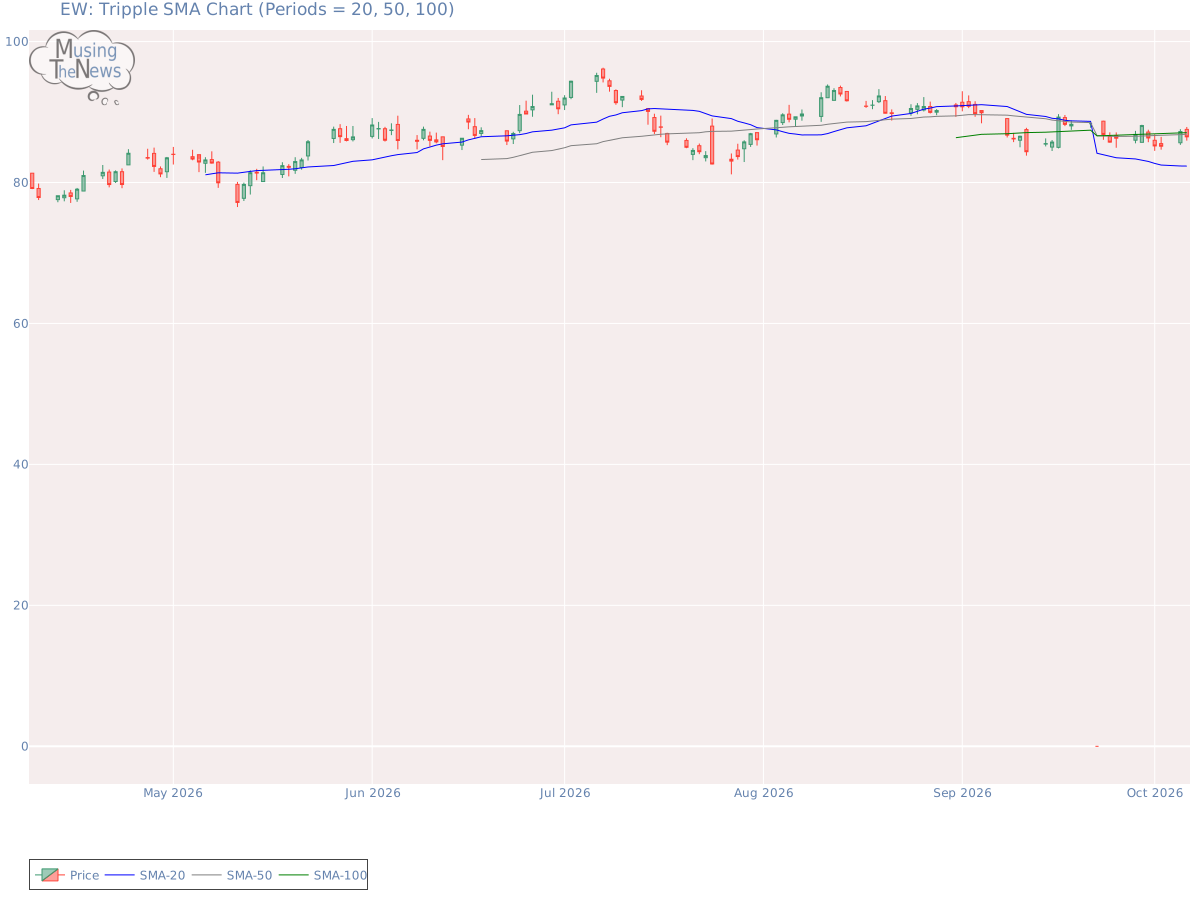
Support and Resistance: With the current price at 86.48, support is found at 86.29 and resistance at 92.28. These levels indicate where buyers might step in at 86.29, while sellers could limit gains at 92.28, defining a trading boundary for Edwards Lifesciences Corporation.Support/Resistance for EWAroon: The current reading of the AROON is neutral for EW, with no clear signals for an upward or downward trend. This indicates that the market may be in a state of uncertainty, with no dominant force driving the direction.Aroon chart for Edwards Lifesciences CorporationBol. Bands: The BOLL BANDS is in a neutral stance for EW, not indicating a clear upward or downward trend. This suggests a period of market indecision, where neither bulls nor bears have the upper hand.Bolinger Bands chart for Edwards Lifesciences CorporationParabolic SAR: The PSAR continues its bullish outlook, establishing a support level that could help sustain the current upward trend. This level of support may act as a cushion against potential downturns, indicating continued strength in the market's bullish momentum for EW.Parabolic Stop and Reverse chart for Edwards Lifesciences CorporationStochastic: The stochastic indicator for EW shows a bullish signal, with the K-line positioned above the D-line and also above the 80 mark. This suggests strong upward momentum, indicating that the market may continue to trend higher. Traders might view this as a sign of continued strength and potential buying opportunities.Stochastic chart for Edwards Lifesciences CorporationTripple Moving Agerage: The current reading of the Tripple MOVING AVG is neutral for EW, with no clear signals for an upward or downward trend. This indicates that the market may be in a state of uncertainty, with no dominant force driving the direction.Tripple SMA chart for Edwards Lifesciences Corporation The technical analysis of a company's stock performance is valuable, but only when considered in conjunction with the company's fundamentals. These fundamentals, including financial strength, earnings growth, and leadership, provide a foundation for understanding market movements. Additionally, industry trends and competitive pressures play an important role. By integrating both fundamental and technical analysis, one can better evaluate the company's true potential and make more informed investment decisions.