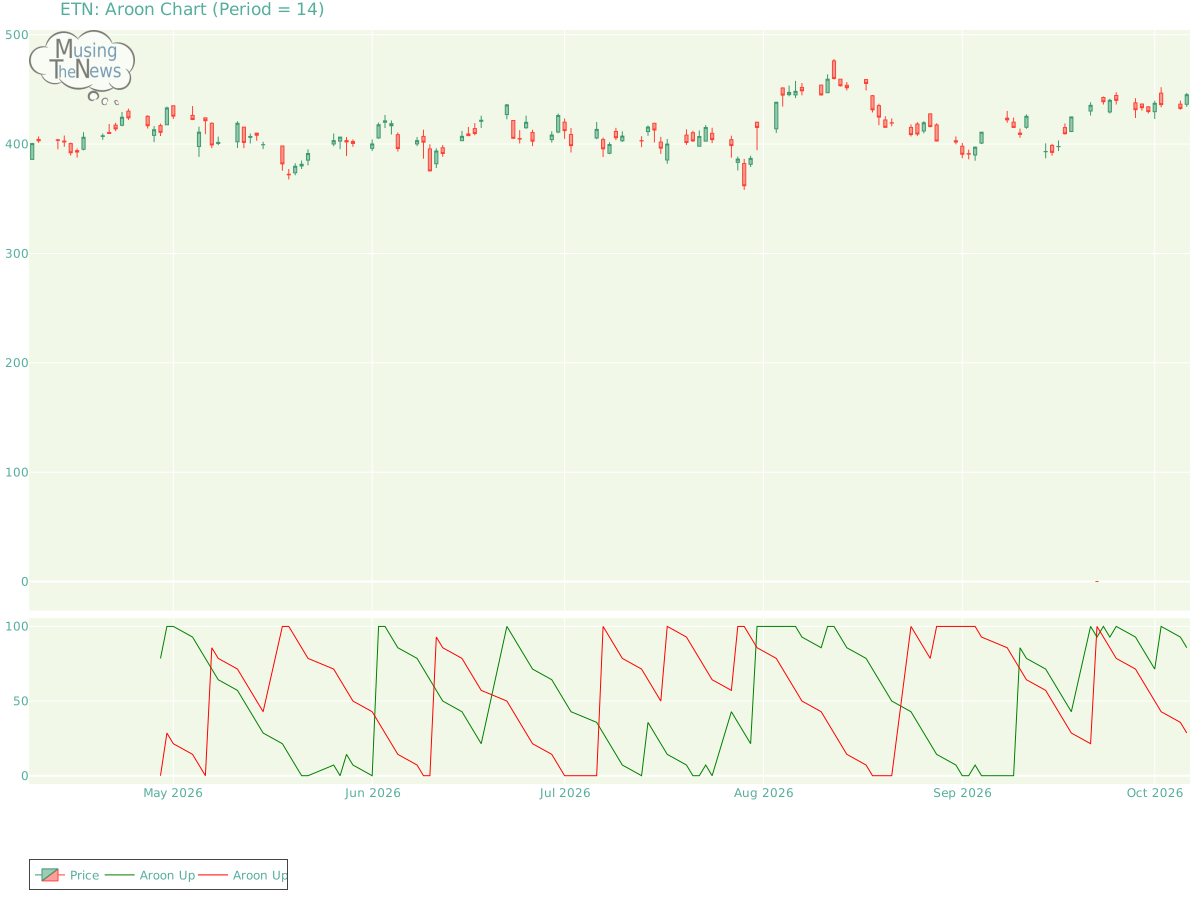
The AROON is currently neutral, showing no clear bias toward an upward or downward trend. This suggests that the market may be in a phase of indecision or consolidation.
By MusingTheNews
Updated 2026-10-07 23:26:10
Overall Technical outlook
Price Summary
Eaton Corporation plc's stock started the year at 436.4, climbed to a high of 446.73, fell to 434.02, and closed 1.99% up at 445.09, with 1592900 shares traded on 2026-10-06. The top price for the stock in the last 52 weeks is 459.96, with the bottom price being 0.0.
Technicals
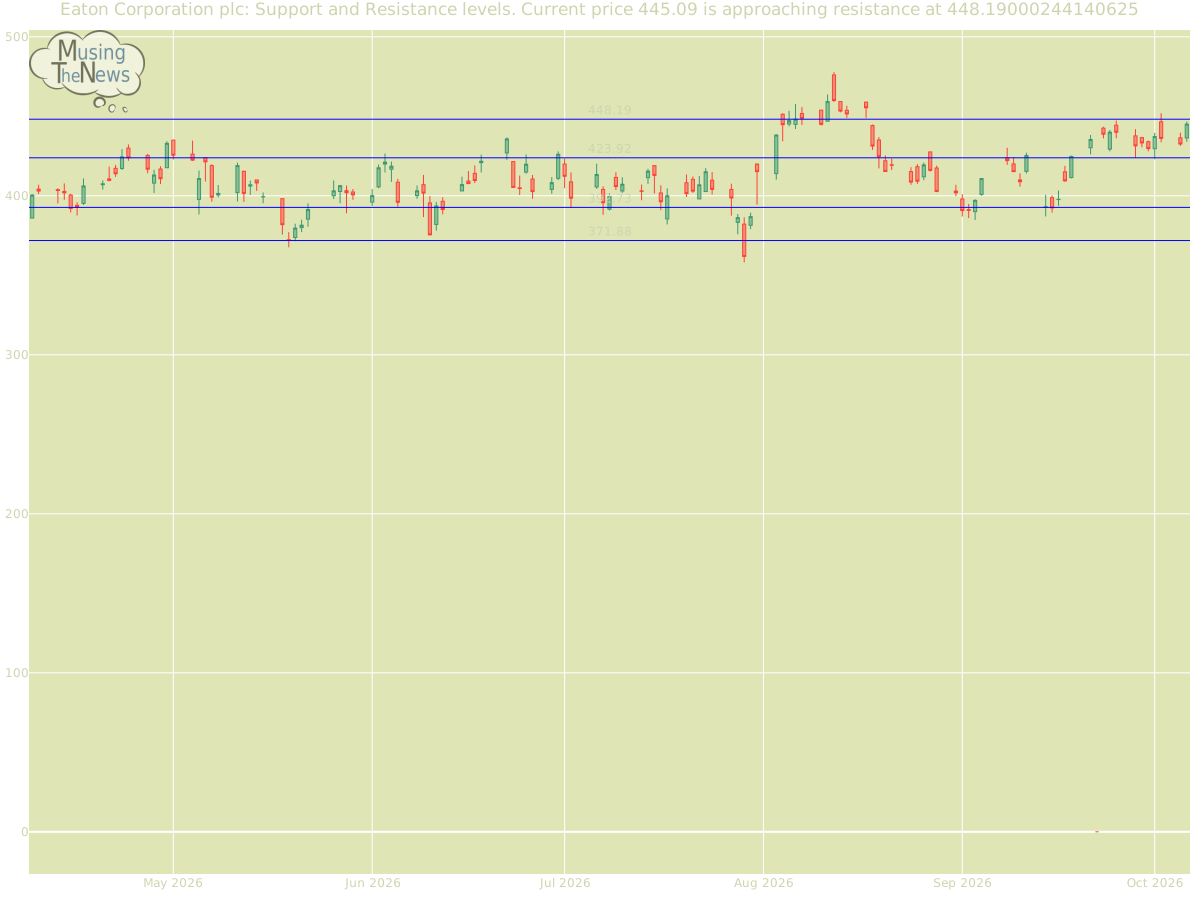
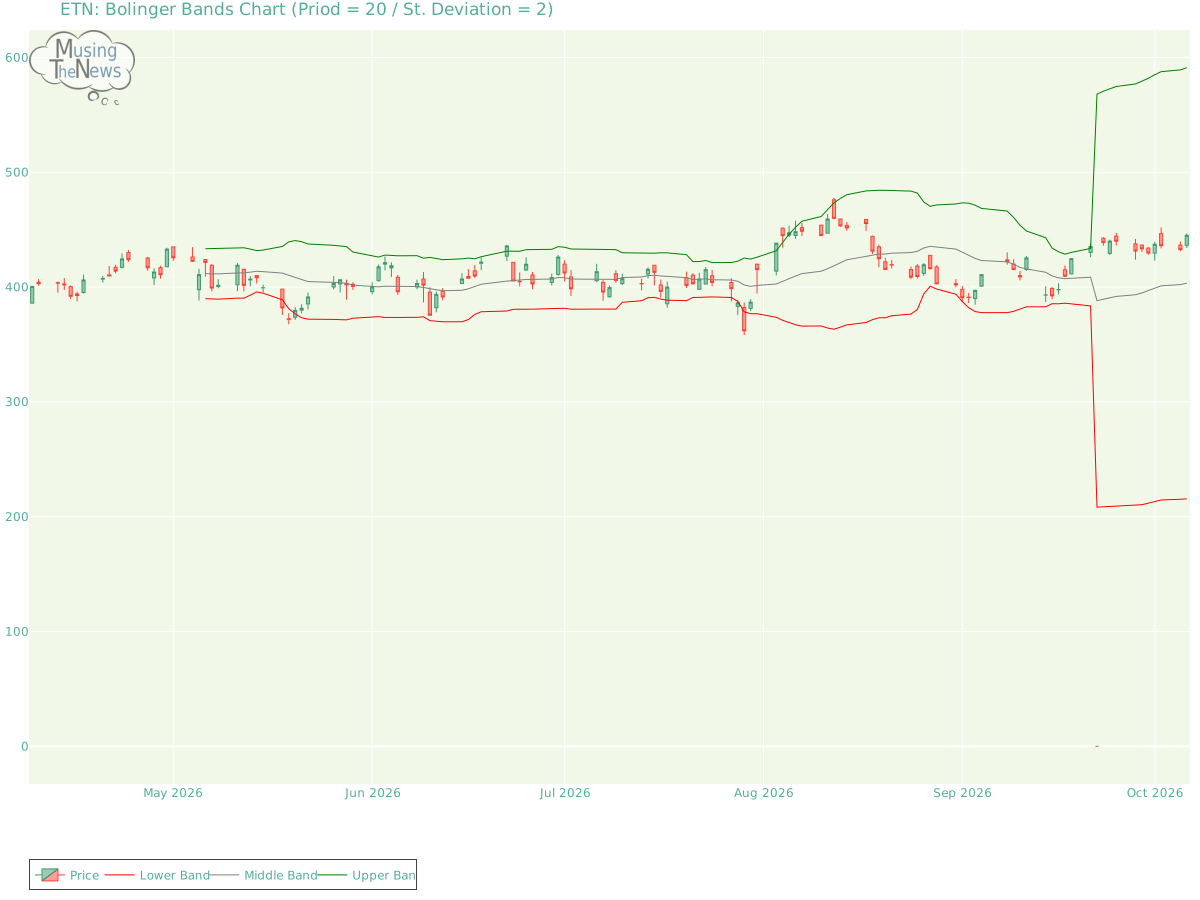
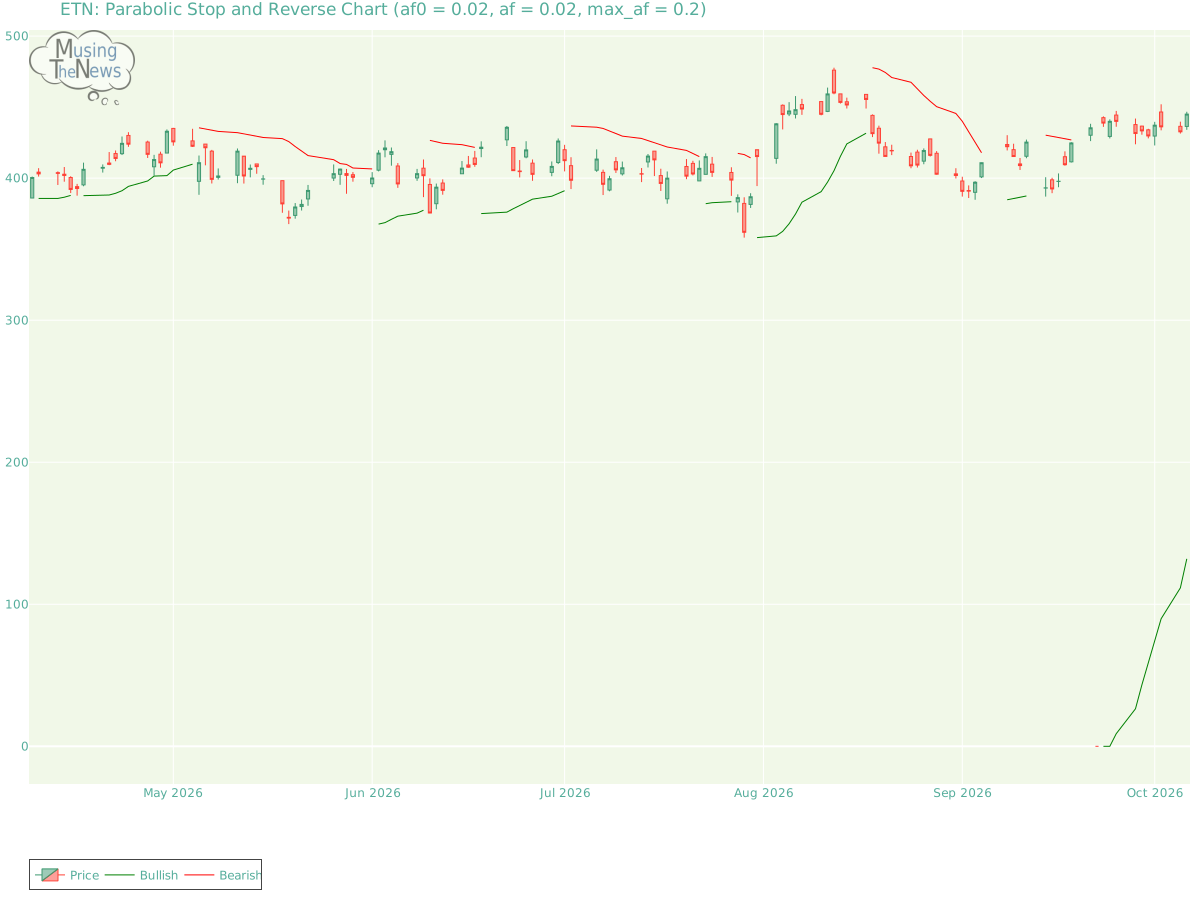
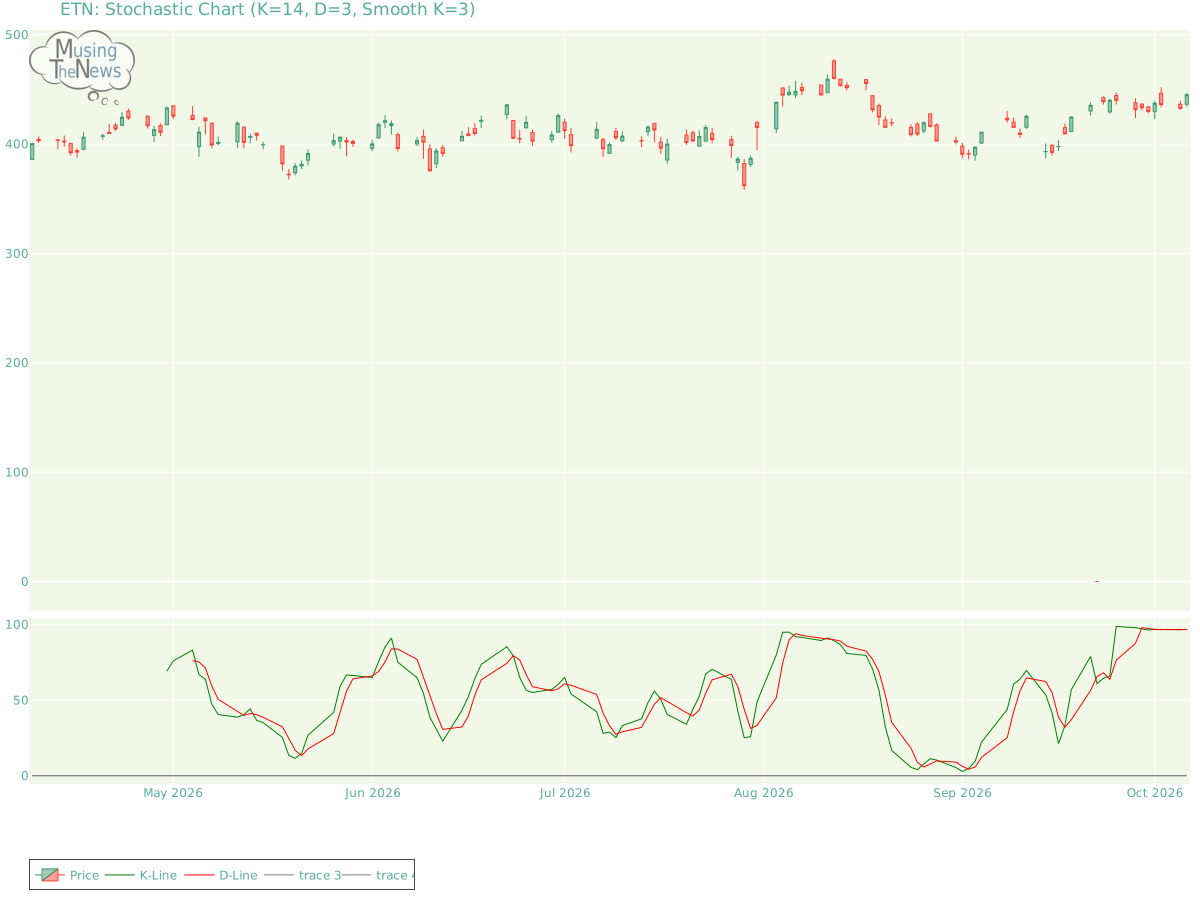
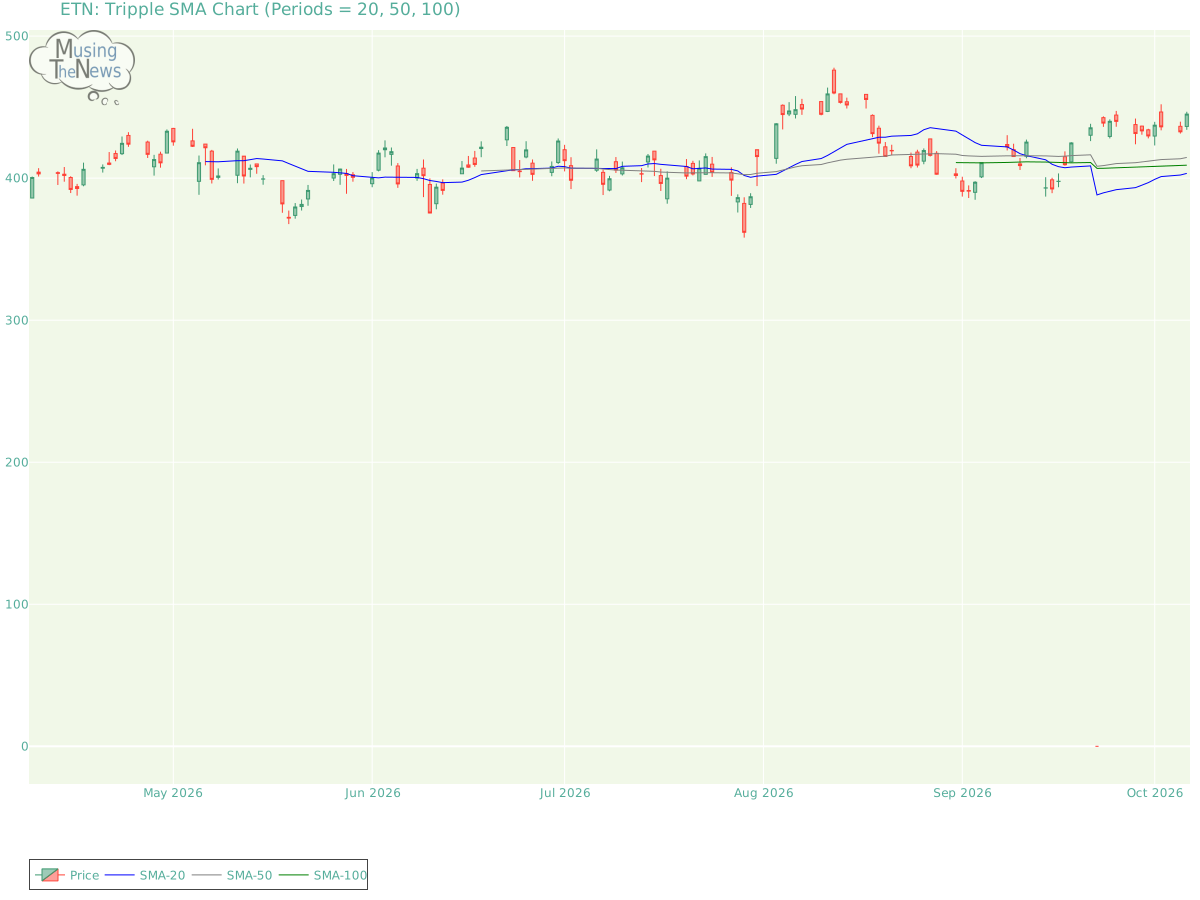
Support and Resistance: The price for ETN at 445.09 finds support at 423.92 and resistance at 448.19. This suggests a trading range, where 423.92 serves as a support level and 448.19 acts as a resistance point, potentially capping further gains.Support/Resistance for ETNAroon: The AROON is currently neutral, showing no clear bias toward an upward or downward trend. This suggests that the market may be in a phase of indecision or consolidation.Aroon chart for Eaton Corporation plcBol. Bands: The current state of the BOLL BANDS is neutral for ETN, providing no clear indication of a trend in either direction. This suggests that the market may be lacking momentum, making it difficult to predict future movements.Bolinger Bands chart for Eaton Corporation plcParabolic SAR: The PSAR remains bullish, reinforcing a significant support level. This steady support suggests that the market's upward trend may continue, providing a solid foundation for potential gains for ETN. Investors might see this as an opportunity to capitalize on the ongoing bullish sentiment.Parabolic Stop and Reverse chart for Eaton Corporation plcStochastic: The stochastic indicator is in a bullish phase, as the K-line is above the D-line and the 80 mark. This setup suggests strong upward momentum, implying that ETN may continue to experience gains. Investors may consider this a positive signal for continued market growth.Stochastic chart for Eaton Corporation plcTripple Moving Agerage: The Tripple MOVING AVG is in a neutral stance for ETN, not indicating a clear upward or downward trend. This suggests a period of market indecision, where neither bulls nor bears have the upper hand.Tripple SMA chart for Eaton Corporation plc In order to draw meaningful inferences from a company's technical data, it is essential to first consider its fundamentals. This includes reviewing financial metrics like revenue, profit margins, and debt-to-equity ratios. Additionally, understanding the broader industry landscape, including market trends and competitive pressures, is crucial. By integrating these insights with the company's technical performance, such as stock price fluctuations and trading volume, one can make more informed investment decisions.