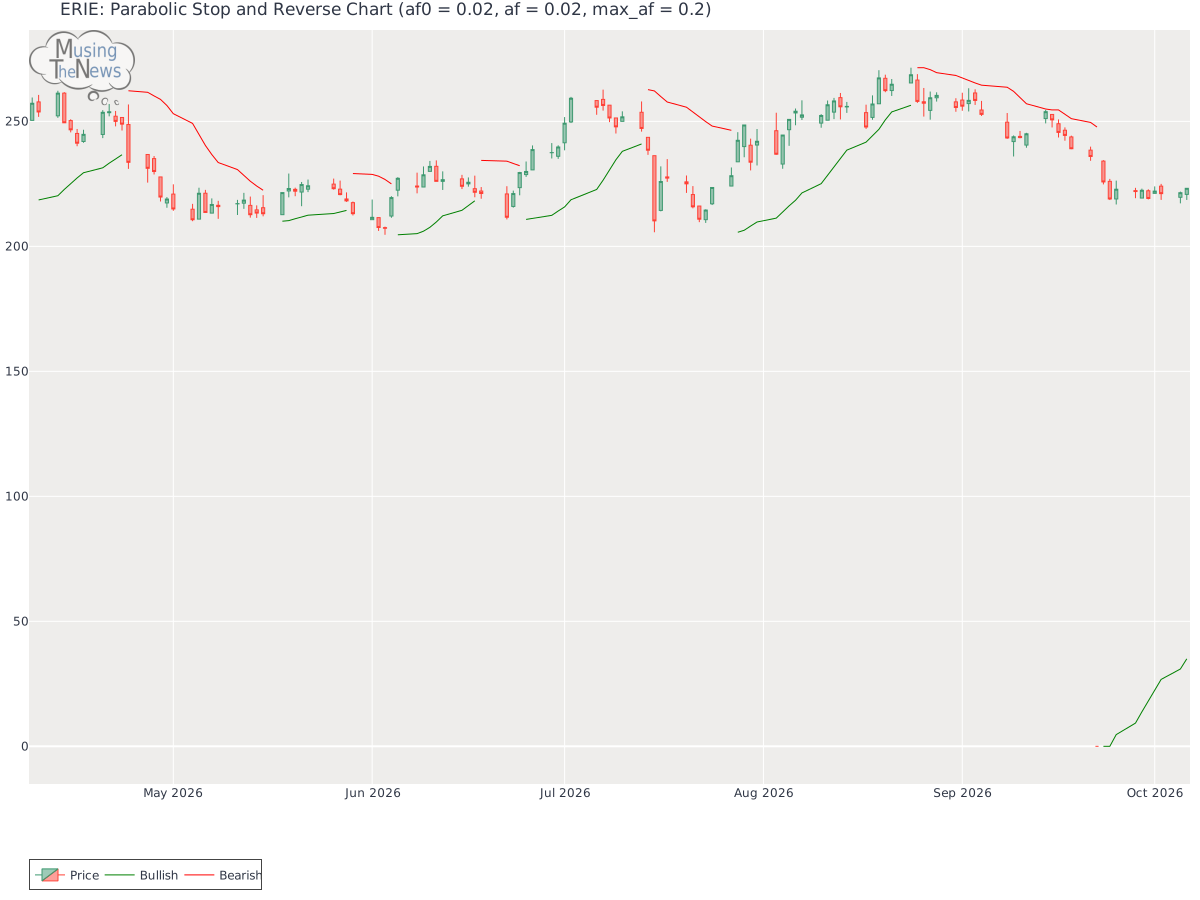
The PSAR continues to indicate a bullish outlook, setting a crucial support level. This strong support could bolster the ongoing upward trend, suggesting that the market ma...
By MusingTheNews
Updated 2026-10-07 23:26:13
Overall Technical outlook
Price Summary
On 2026-10-06, ERIE's stock began at 220.79, peaked at 223.41, dipped to 218.57, and closed up 1.1% at 223.22, with a volume of 117200 shares. The top price for the stock in the last 52 weeks is 329.97, with the bottom price being 0.0.
Technicals
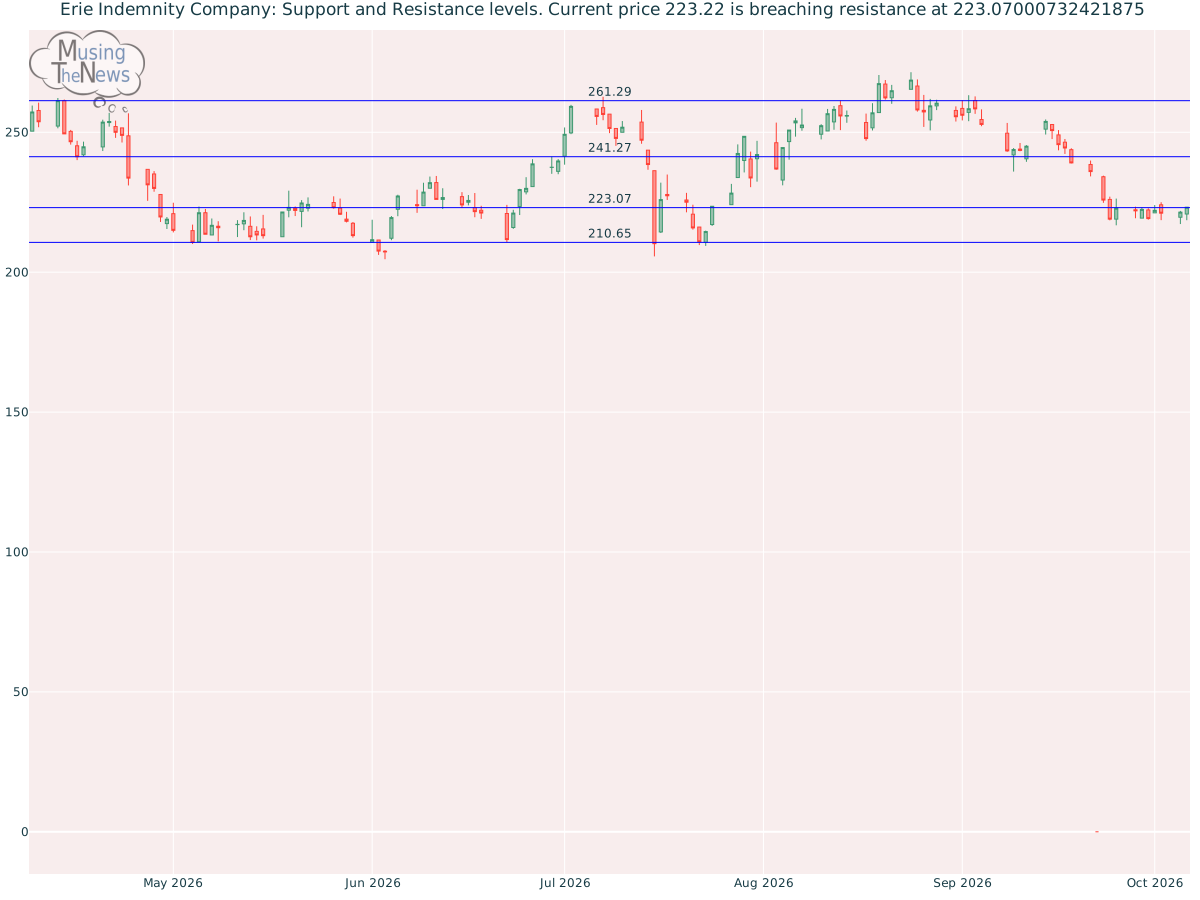
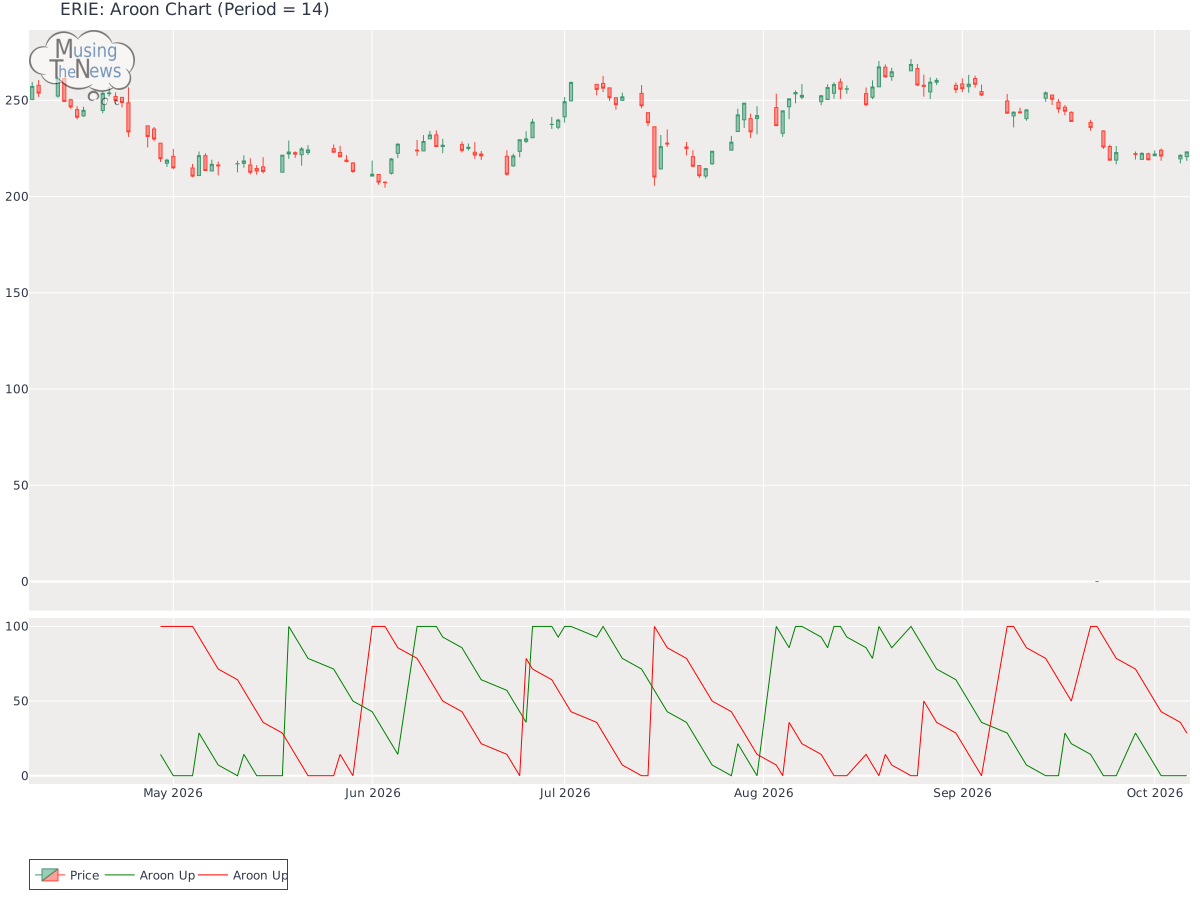
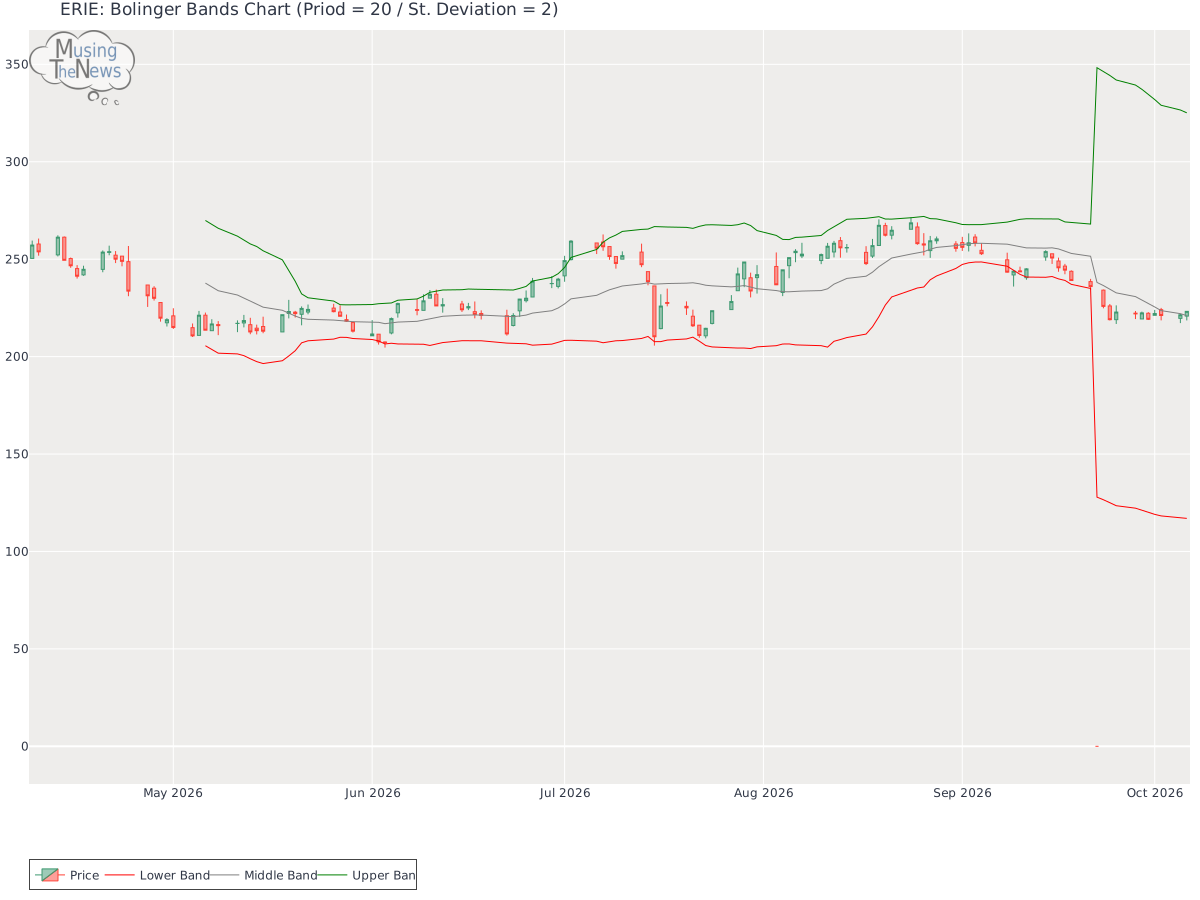
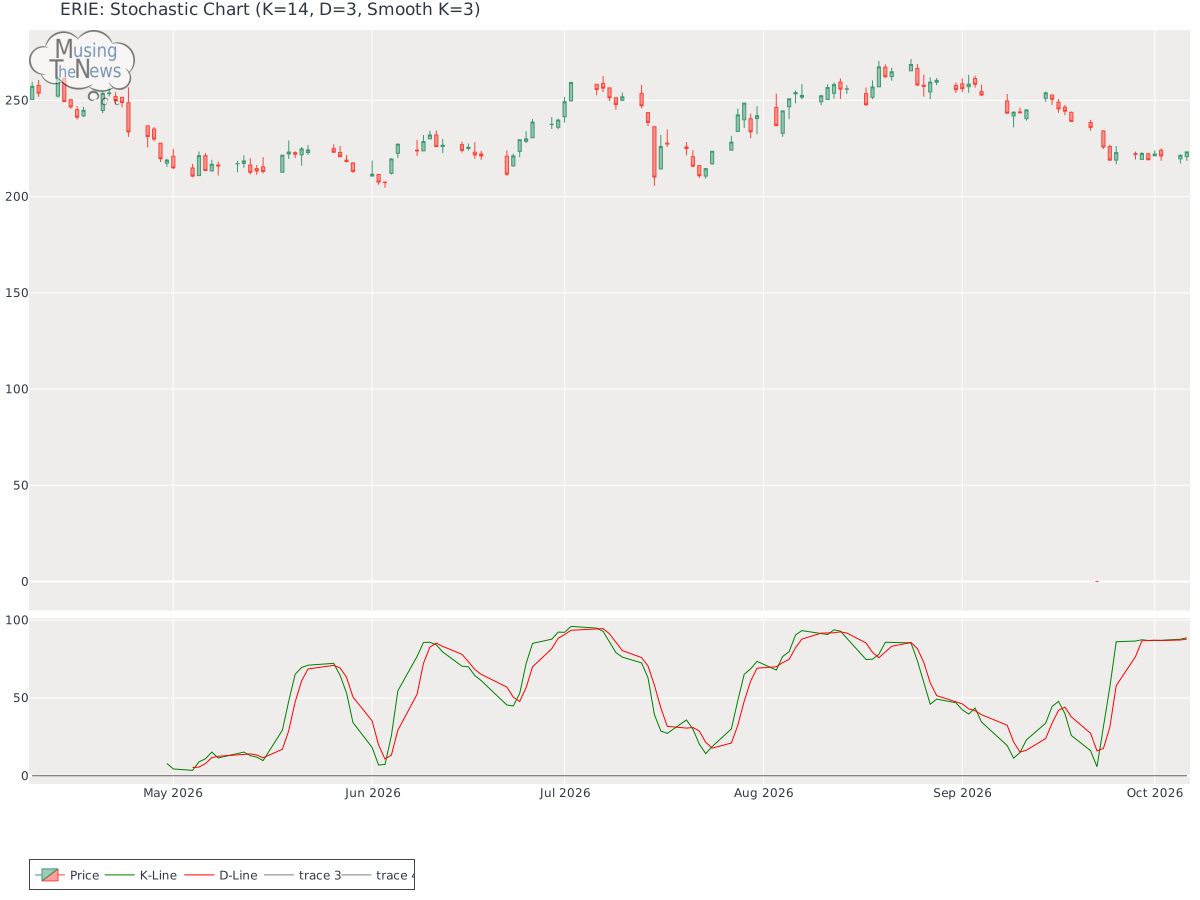
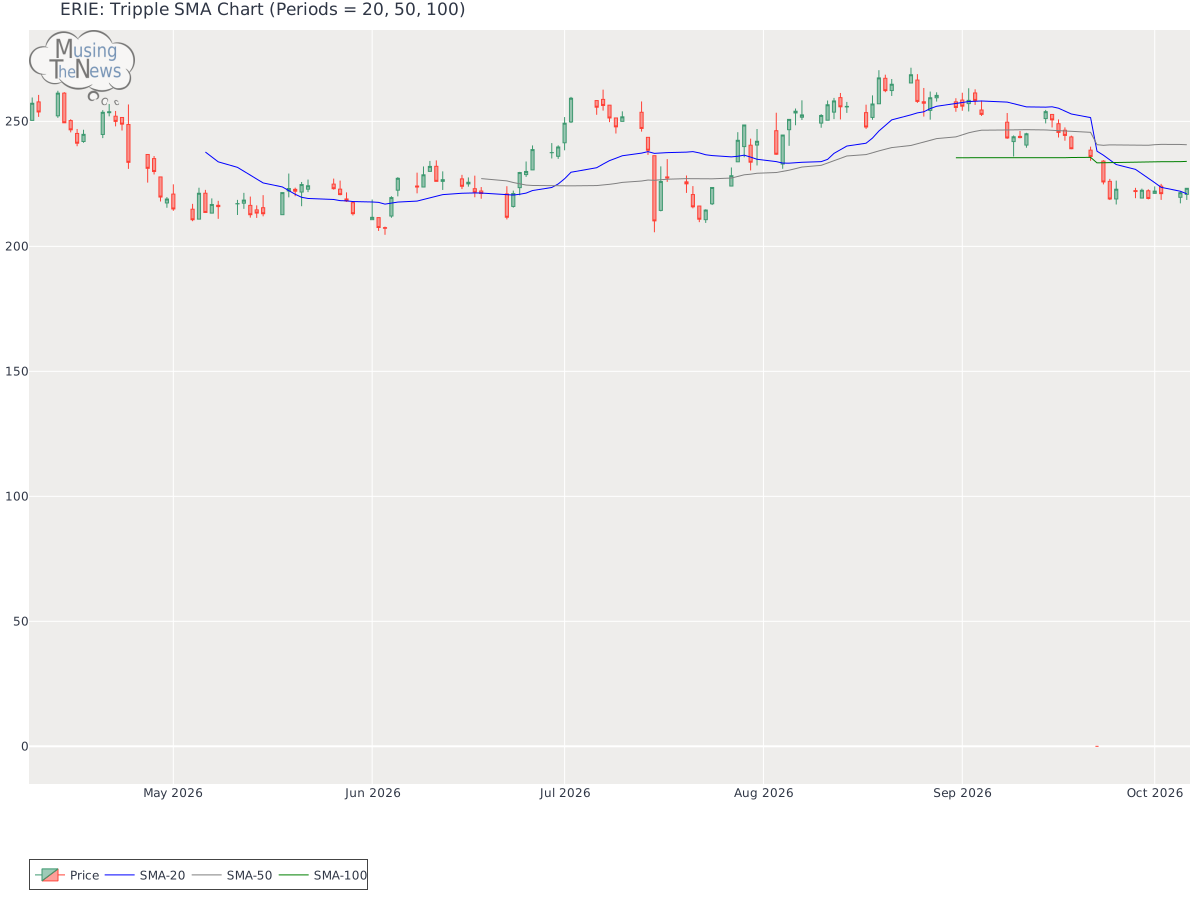
Support and Resistance: The current price sits at 223.22, supported at 223.07 and capped by resistance at 241.27. These levels define a range for ERIE where the price might stabilize, with 223.07 as a floor and 241.27 as a ceiling.Support/Resistance for ERIEAroon: The current state of the AROON is neutral, with no clear trend direction indicated. This lack of directional bias suggests that the market may be in a phase of consolidation or uncertainty.Aroon chart for Erie Indemnity CompanyBol. Bands: The BOLL BANDS is currently in a neutral position for Erie Indemnity Company, offering no clear guidance on whether the market is likely to move up or down. This neutral stance suggests that further observation may be necessary before a trend becomes apparent.Bolinger Bands chart for Erie Indemnity CompanyParabolic SAR: The PSAR continues to indicate a bullish outlook, setting a crucial support level. This strong support could bolster the ongoing upward trend, suggesting that the market may remain in a positive trajectory. Investors may view this as a sign of sustained bullish momentum.Parabolic Stop and Reverse chart for Erie Indemnity CompanyStochastic: The stochastic indicator for Erie Indemnity Company reflects a bullish sentiment, as the K-line is above both the D-line and the 80 threshold. This setup points to strong upward momentum, implying that the market may continue to rise. Traders could consider this as an indication of sustained bullish activity.Stochastic chart for Erie Indemnity CompanyTripple Moving Agerage: The current state of the Tripple MOVING AVG is neutral for ERIE, providing no clear indication of a trend in either direction. This suggests that the market may be lacking momentum, making it difficult to predict future movements.Tripple SMA chart for Erie Indemnity Company Before focusing on a company's technical data, such as stock price movements, it's essential to analyze its fundamentals. These include factors like profitability, cash flow, and debt management. Additionally, considering the broader industry landscape—including market trends, competition, and regulatory changes—offers deeper insights. This comprehensive approach allows for a more meaningful interpretation of the company's technical indicators, providing a clearer picture of its financial health and future prospects.