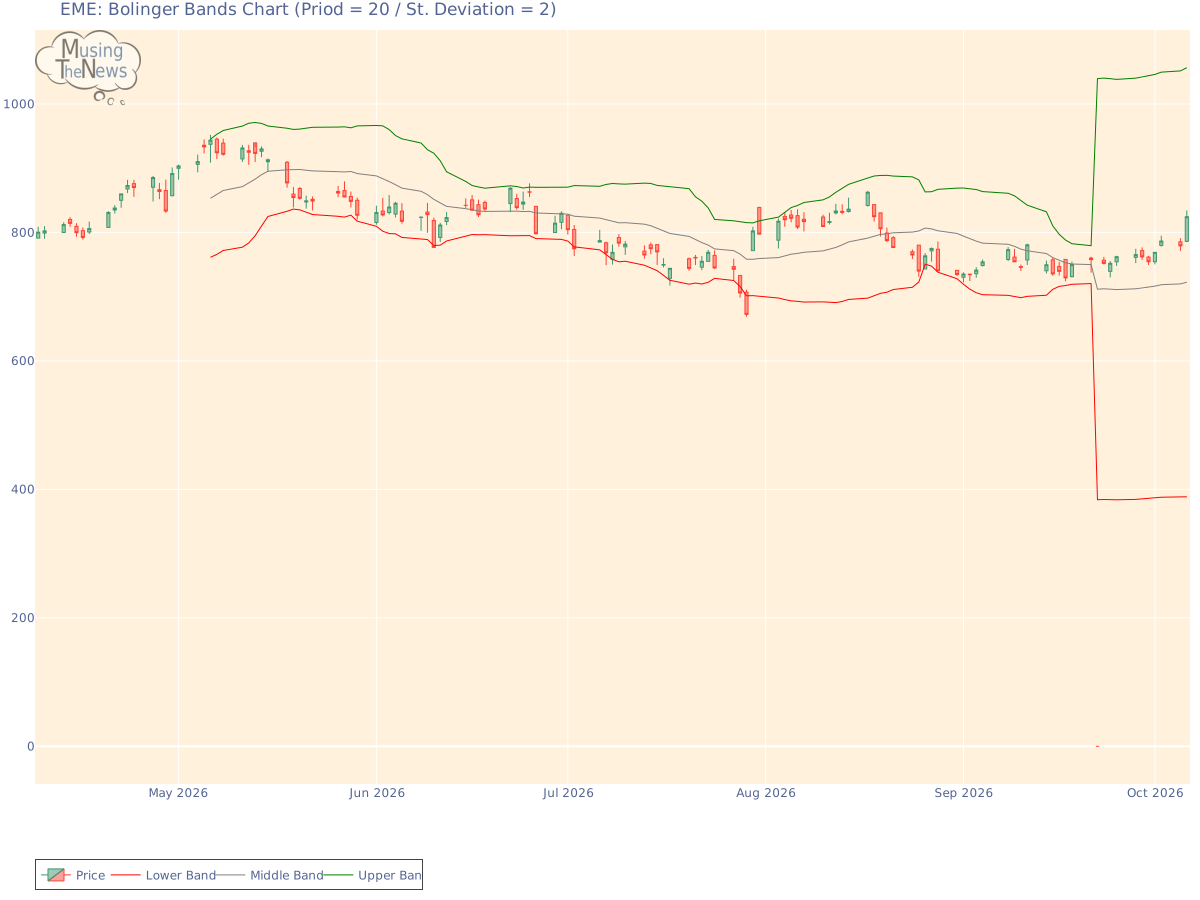
The BOLL BANDS is currently neutral, offering no clear guidance on market direction. This suggests that the market may be in a state of pause, with no strong trend emerging...
By MusingTheNews
Updated 2026-10-07 23:26:11
Overall Technical outlook
Price Summary
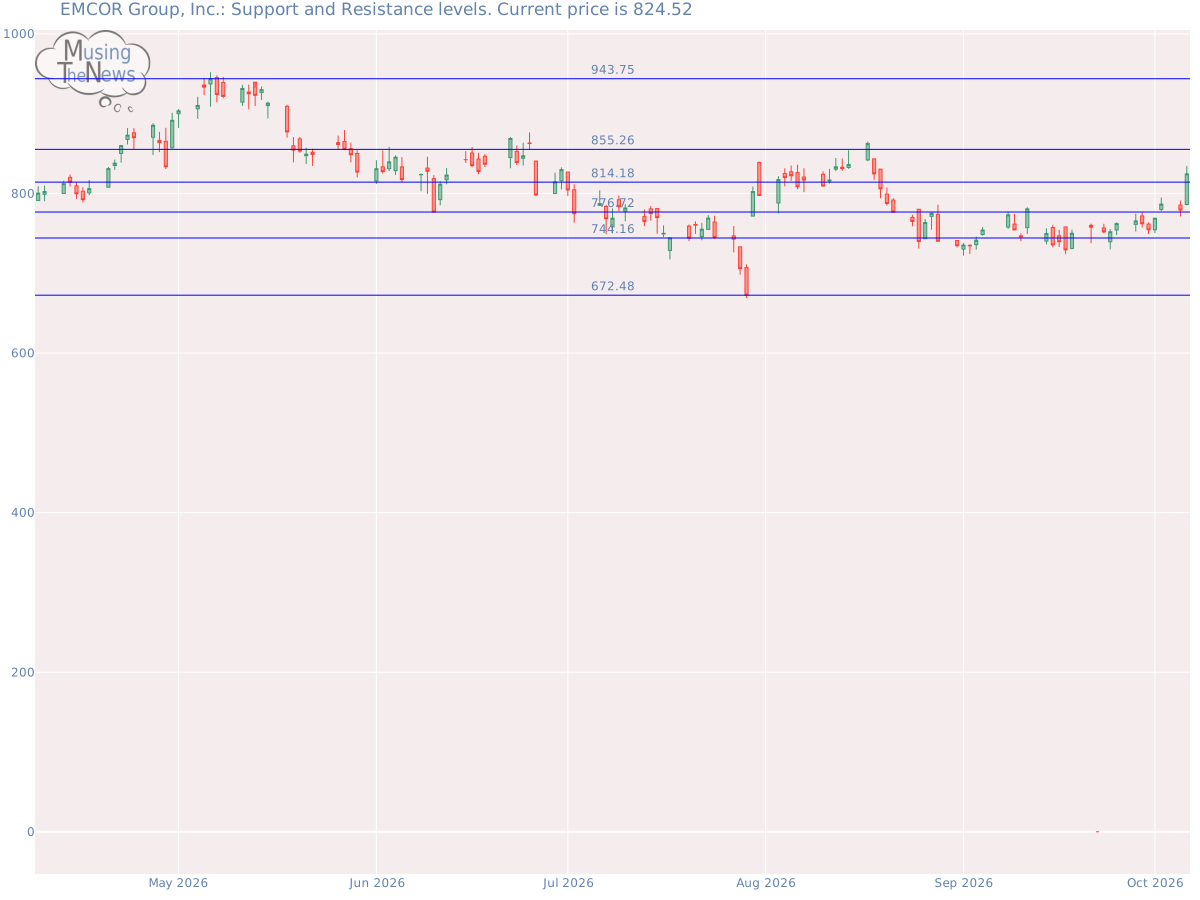
In today's trading session, EME's shares climbed by 4.88%, marking a impressive day. On 2026-10-06, EMCOR Group, Inc.'s shares started at 786.18, peaked at 834.23, bottomed out at 785.0, and ended 4.88% up at 824.52, with 422600 shares traded. Over the past 52 weeks, the stock reached a maximum price of 943.75 and a minimum price of 0.0.
Technicals
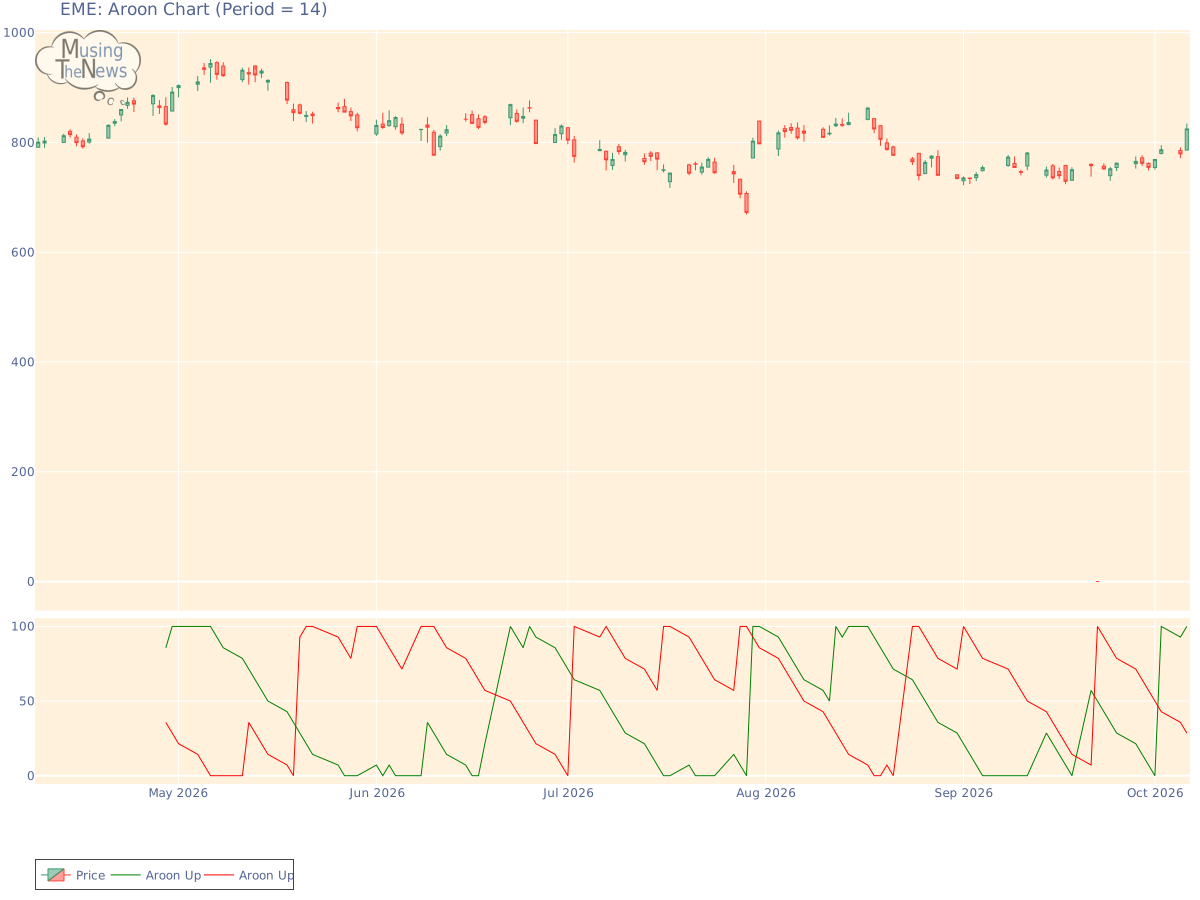
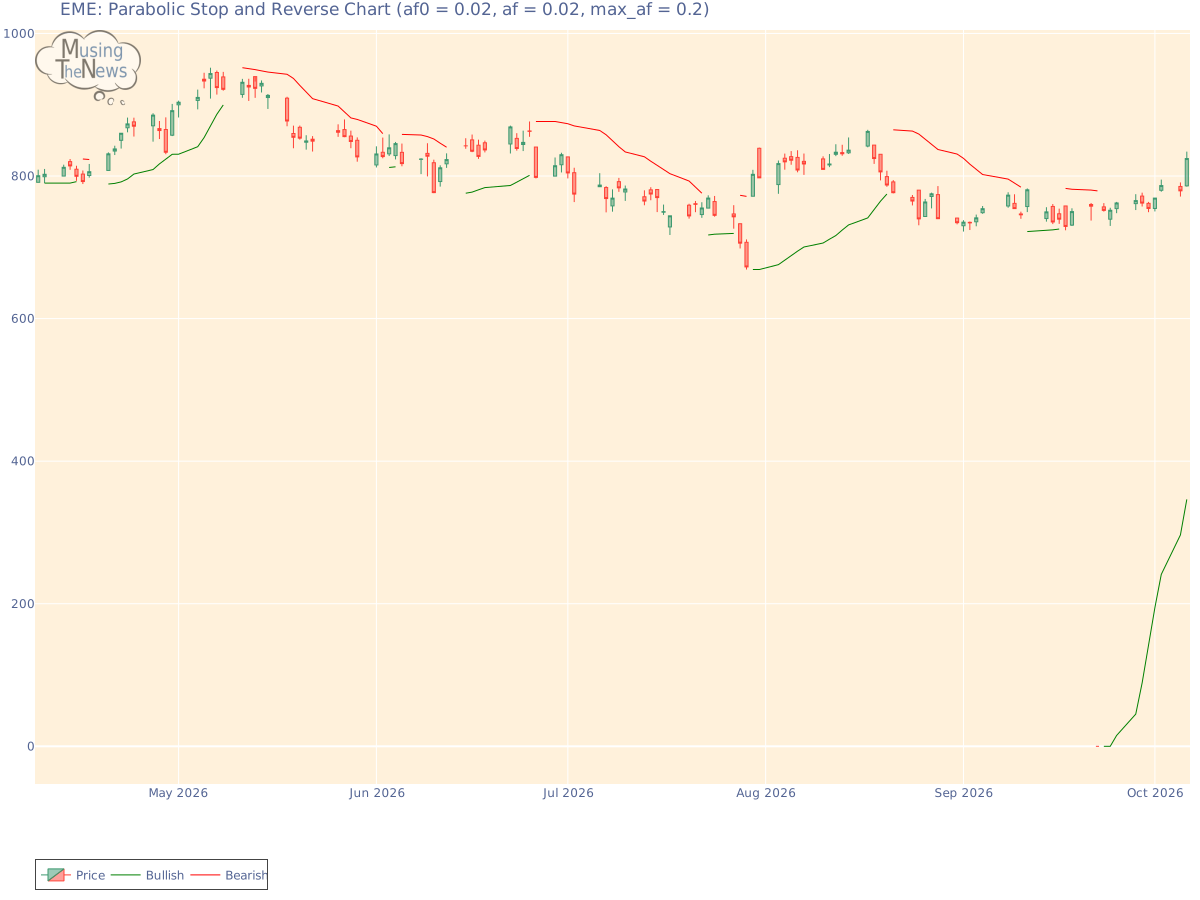
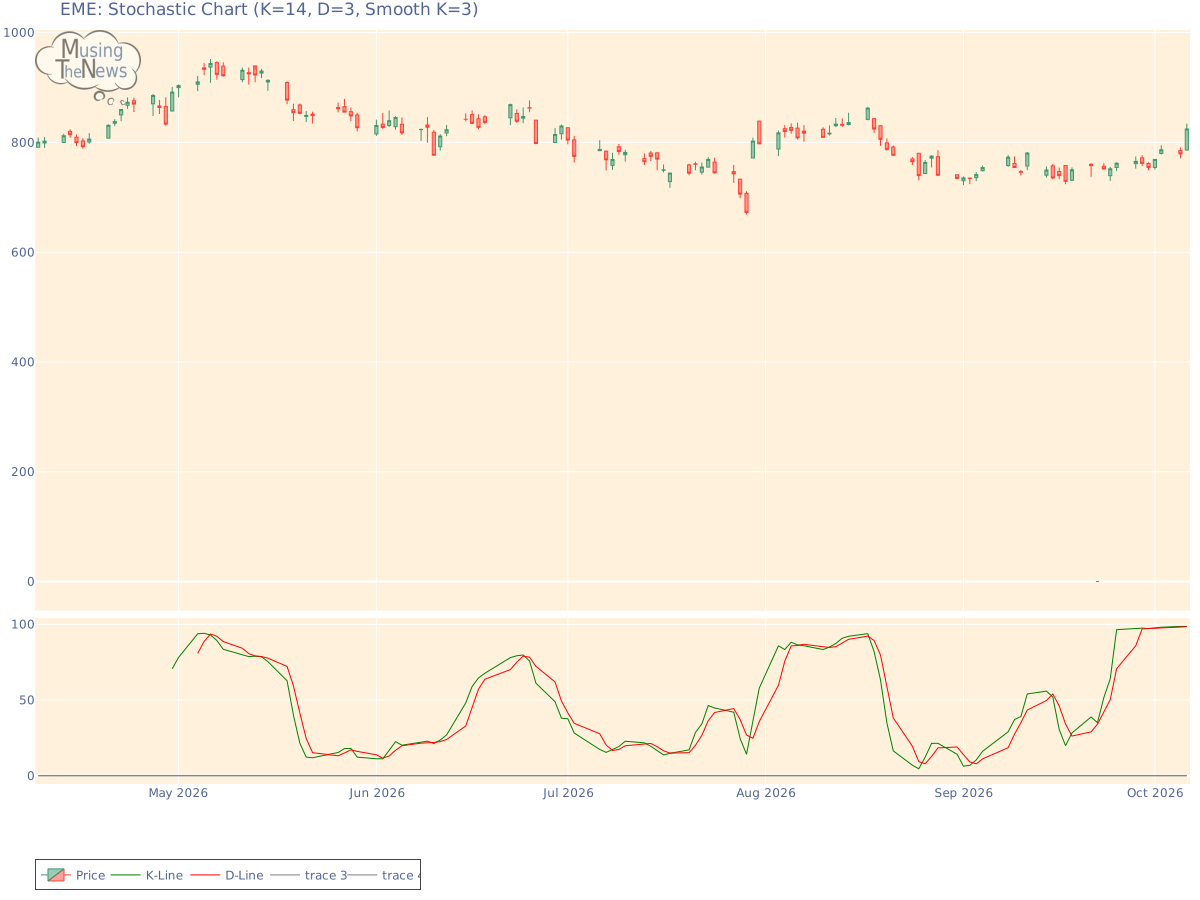
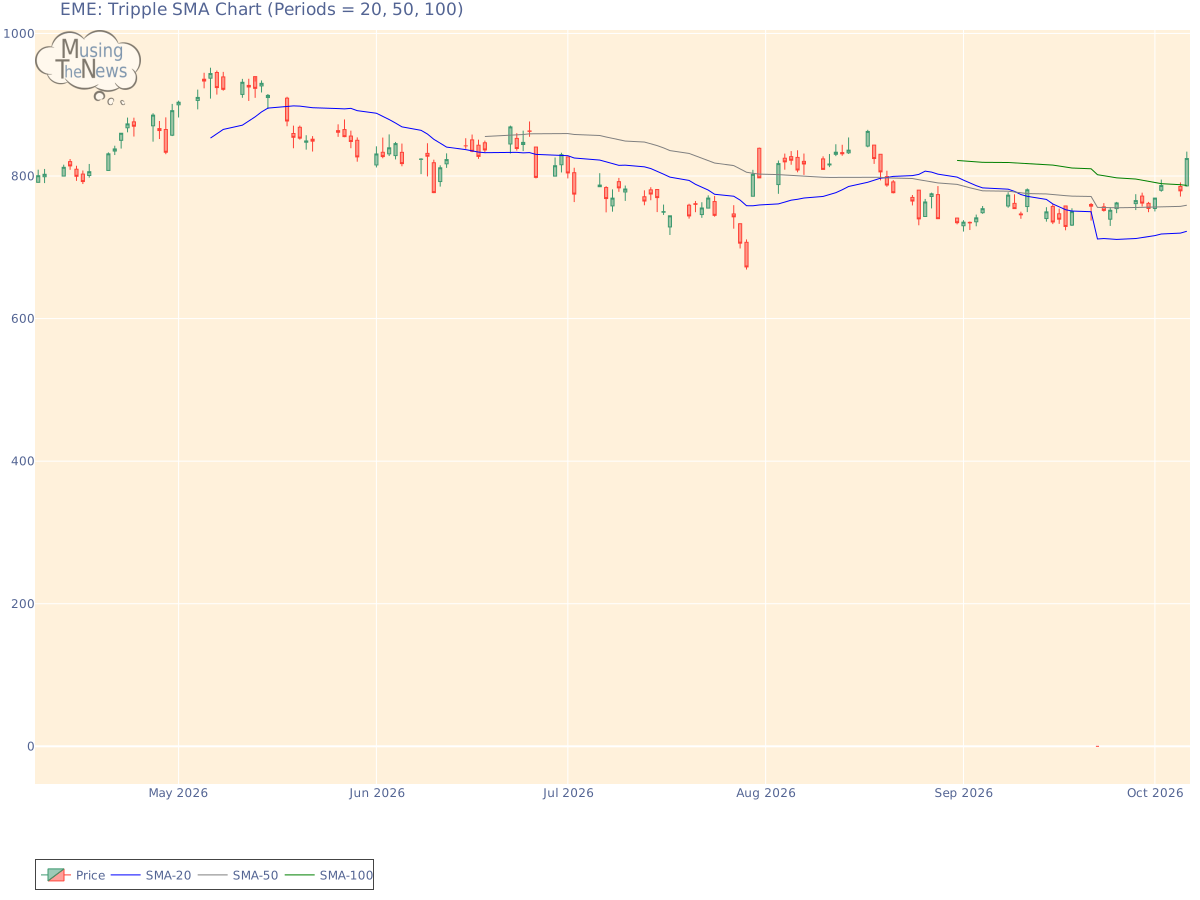
Support and Resistance: With the current price at 824.52, support is found at 814.18 and resistance at 855.26. These levels indicate where buyers might step in at 814.18, while sellers could limit gains at 855.26, defining a trading boundary for EMCOR Group, Inc..Support/Resistance for EMEAroon: Aroon's bullish trend is ongoing, with Aroon Up consistently at the 100 level. While this suggests strong upward momentum for EME, it's important to analyze this trend further with other indicators to gain a comprehensive understanding of the direction.Aroon chart for EMCOR Group, Inc.Bol. Bands: The BOLL BANDS is currently neutral, offering no clear guidance on market direction. This suggests that the market may be in a state of pause, with no strong trend emerging.Bolinger Bands chart for EMCOR Group, Inc.Parabolic SAR: The PSAR remains bullish in its outlook, reinforcing a key support level that could help sustain the market's upward movement for EME. This support suggests that the bullish momentum is likely to persist, offering a foundation for further growth.Parabolic Stop and Reverse chart for EMCOR Group, Inc.Stochastic: The stochastic indicator for EME shows a bullish signal, with the K-line positioned above the D-line and also above the 80 mark. This suggests strong upward momentum, indicating that the market may continue to trend higher. Traders might view this as a sign of continued strength and potential buying opportunities.Stochastic chart for EMCOR Group, Inc.Tripple Moving Agerage: The 20, 50, and 100 moving averages are aligned, pointing to a bullish trend with their upward slopes further supporting a mildly bullish sentiment. This suggests that the market is likely to experience a steady, gradual rise rather than a sharp increase. Investors can interpret this as a sign of a stable, positive trend with moderate gains expected over time.Tripple SMA chart for EMCOR Group, Inc. To make the most of a company's technical analysis, it's important to start with an understanding of its fundamentals. These include profitability, cash flow, and competitive positioning. Additionally, the industry in which the company operates plays a critical role, as trends and external factors can influence its market performance. By considering both the company's internal fundamentals and the external industry environment, more meaningful and accurate conclusions can be drawn from the technical data.