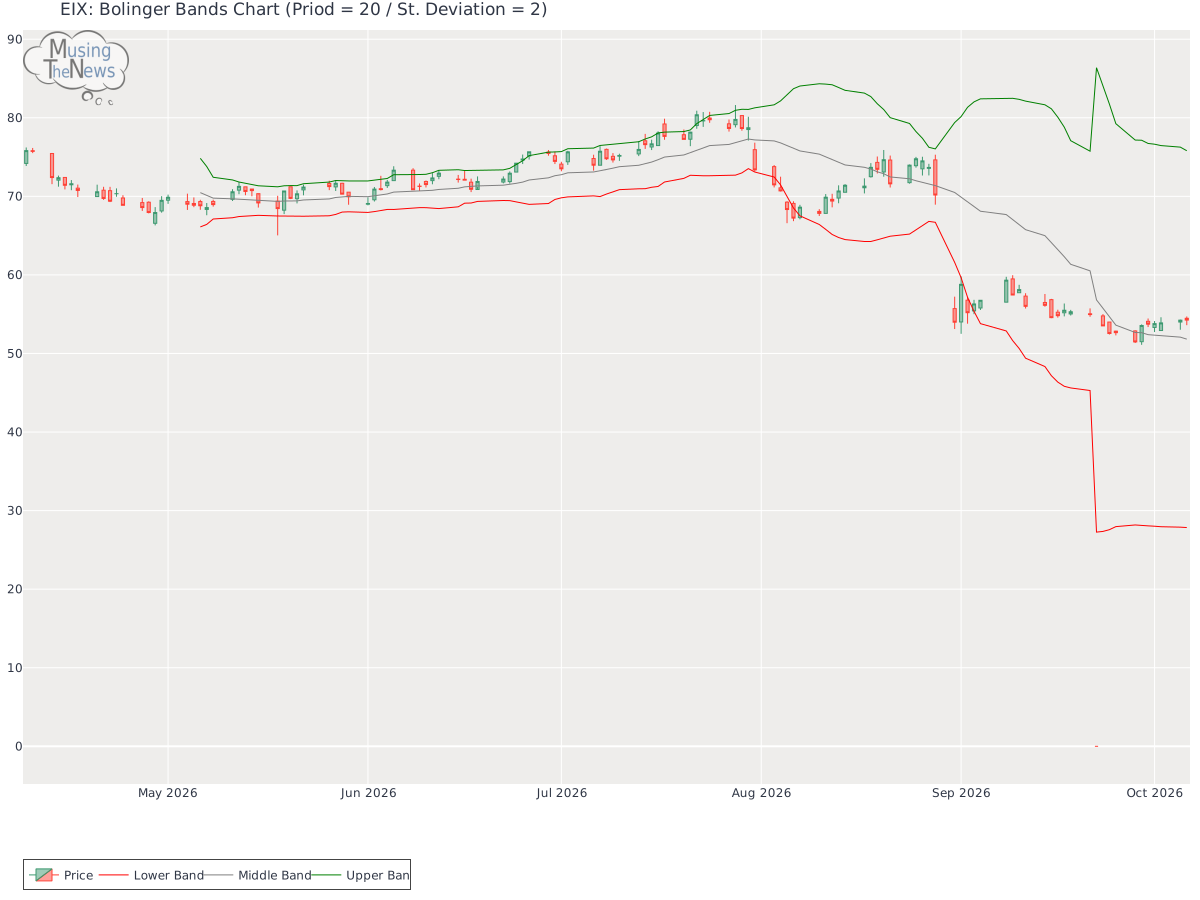
The BOLL BANDS is currently in a neutral position, offering no clear indication of movement up or down. This suggests that the market may be experiencing a period of equili...
By MusingTheNews
Updated 2026-10-07 23:26:10
Overall Technical outlook
Price Summary
On 2026-10-06, Edison International's stock opened at 54.48, peaked at 54.71, hit a low of 53.6, and closed -0.42% down at 54.25, with 5141100 shares changing hands. The stock's peak price over the last 52 weeks is 80.38, with the lowest being 0.0.
Technicals
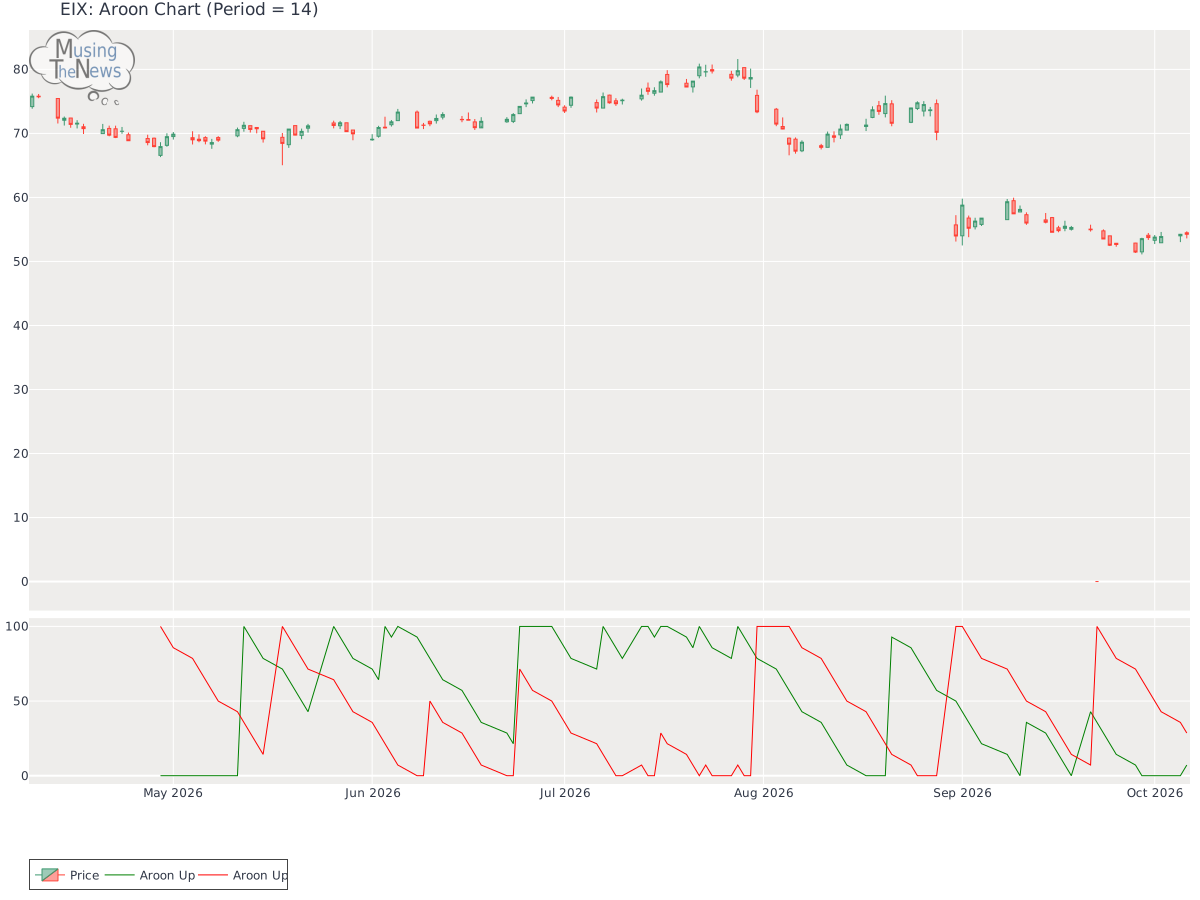
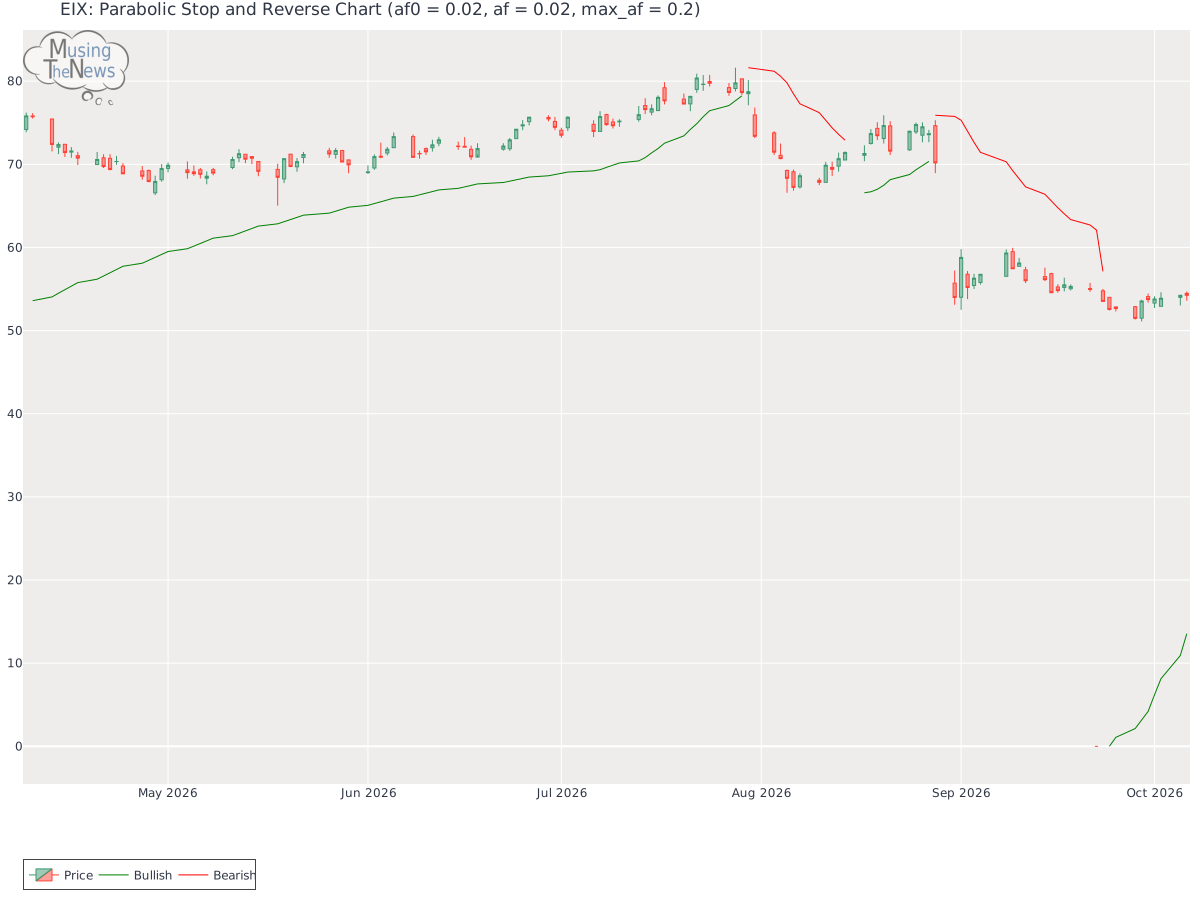
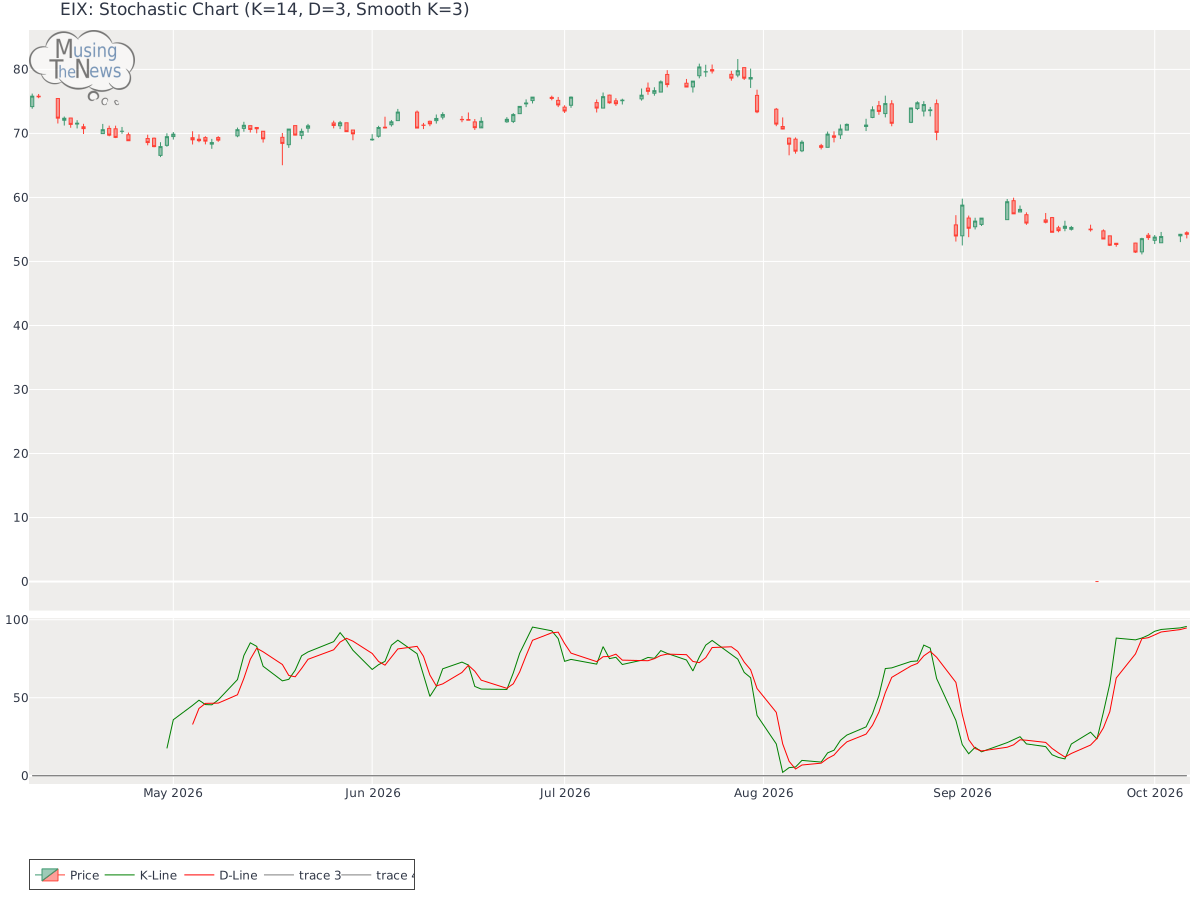
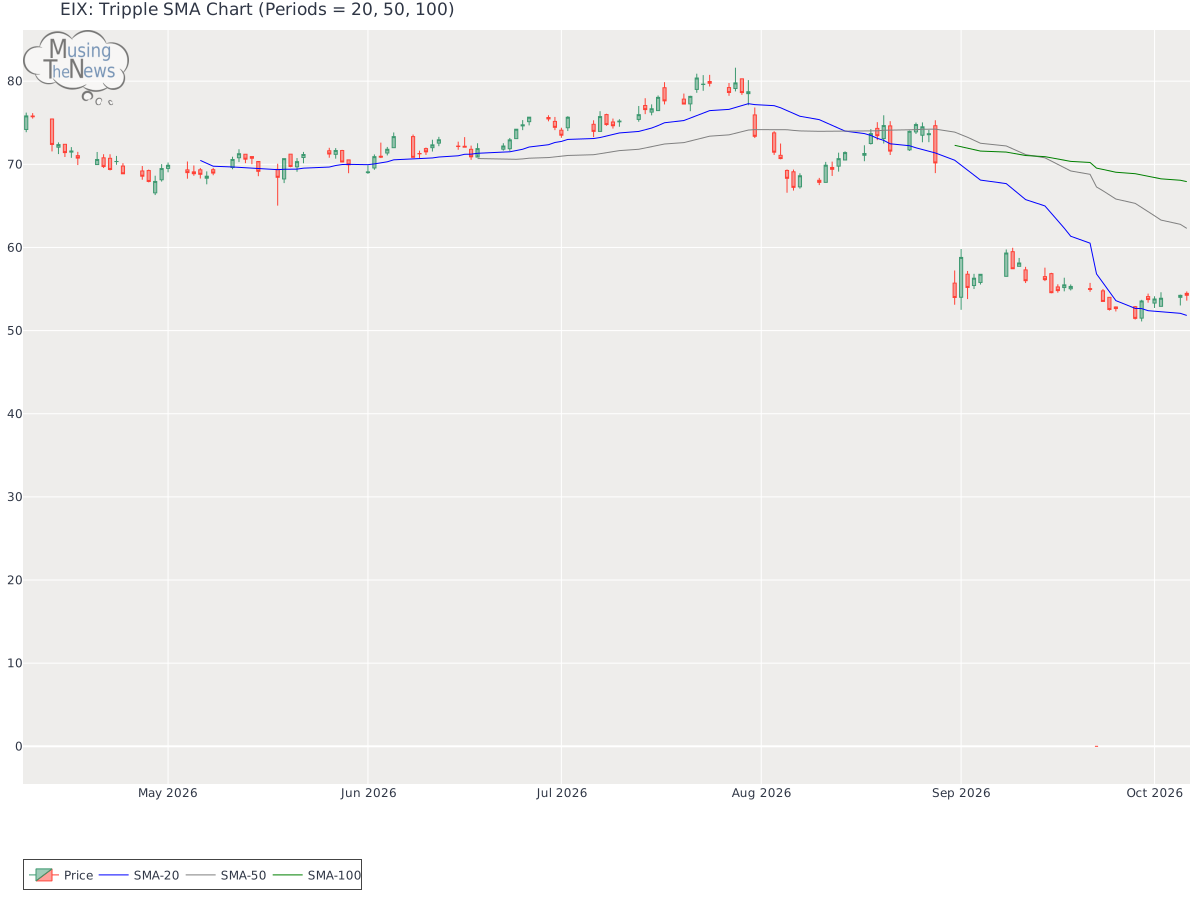
Aroon: The AROON is in a neutral stance, with no clear direction indicated for the market. This lack of clarity suggests that the market may be in a state of equilibrium for EIX, with no strong trend emerging.Aroon chart for Edison InternationalBol. Bands: The BOLL BANDS is currently in a neutral position, offering no clear indication of movement up or down. This suggests that the market may be experiencing a period of equilibrium, with no strong trend in play.Bolinger Bands chart for Edison InternationalParabolic SAR: The PSAR maintains its bullish stance, setting a significant support level that could help maintain the market's upward movement. This strong support suggests that the market is poised to continue its positive trend, providing confidence in the ongoing bullish momentum.Parabolic Stop and Reverse chart for Edison InternationalStochastic: The stochastic indicator shows bullish conditions, with the K-line positioned above the D-line and exceeding the 80 level. This setup suggests strong upward momentum, indicating that the market may continue to rise. Investors might view this as a favorable sign for continued growth.Stochastic chart for Edison InternationalTripple Moving Agerage: The 20-50-100 period moving averages suggest a bullish trend, though the weakening slopes of the shorter-term averages raise concerns about a potential reversal. While the overall momentum is still upward, the indications from the faster averages suggest that the trend might be nearing its end, warranting caution.Tripple SMA chart for Edison International Understanding a company's fundamentals—such as revenue, earnings, and debt levels—provides a solid foundation for analyzing its technical performance. Similarly, knowledge of the industry, including key competitors and market trends, is critical. Combining this fundamental analysis with technical indicators like stock charts, moving averages, and trading volume enables a more comprehensive approach to evaluating the company's overall health and potential future performance.