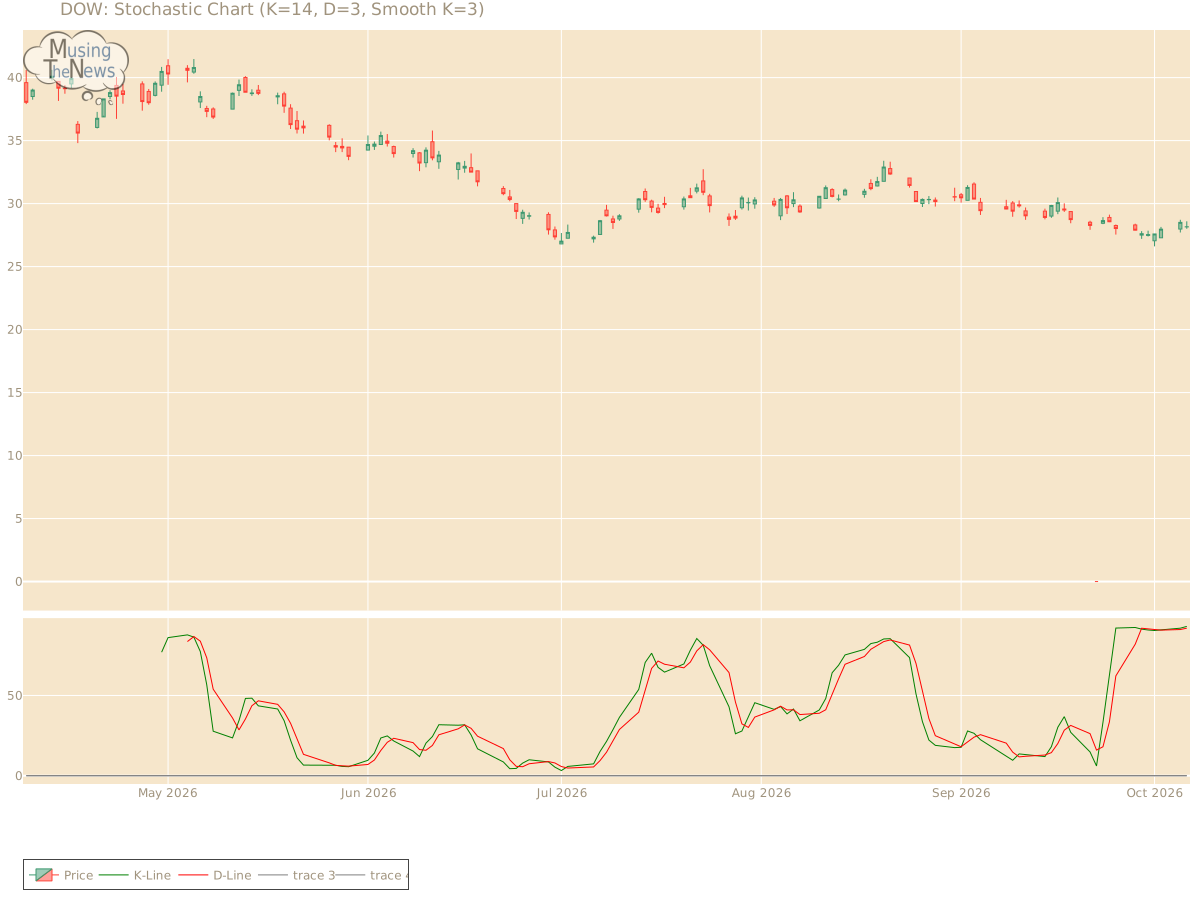
The stochastic indicator shows bullish conditions, with the K-line positioned above the D-line and exceeding the 80 level. This setup suggests strong upward momentum, indic...
By MusingTheNews
Updated 2026-10-07 23:26:09
Overall Technical outlook
Price Summary
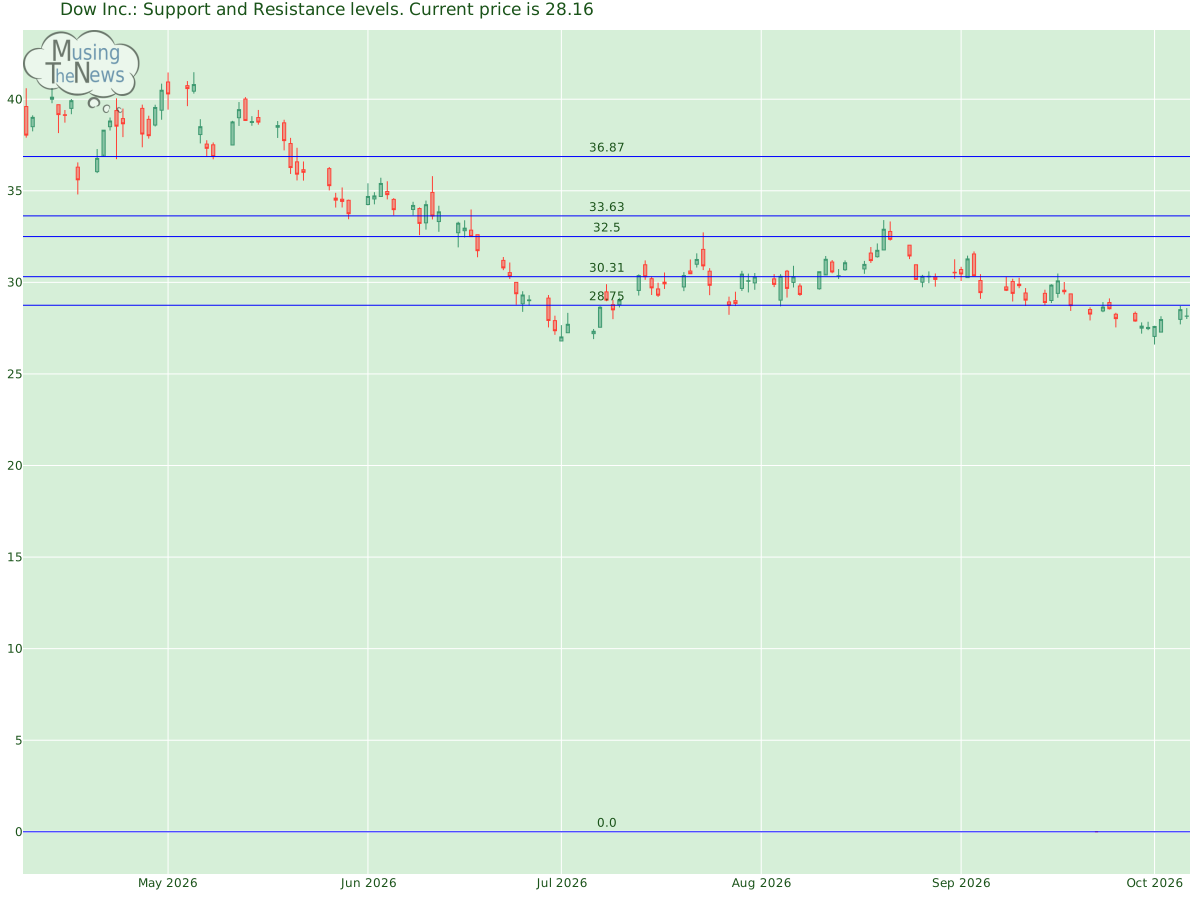
On 2026-10-06, Dow Inc.'s stock opened at 28.15, peaked at 28.59, hit a low of 28.0, and closed 0.04% higher at 28.16, with 8442700 shares changing hands. The stock's highest value over the last 52 weeks is 41.87, and the lowest value is 0.0.
Technicals
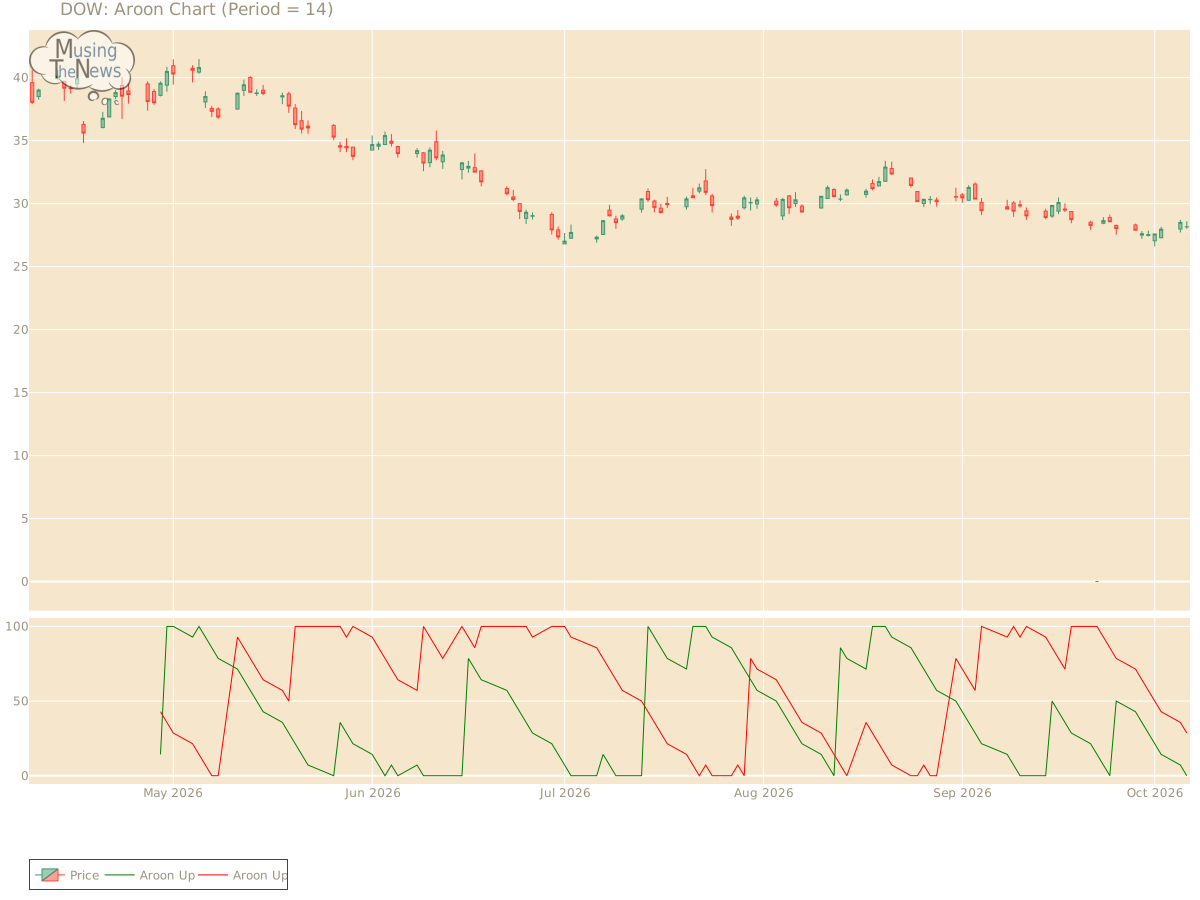
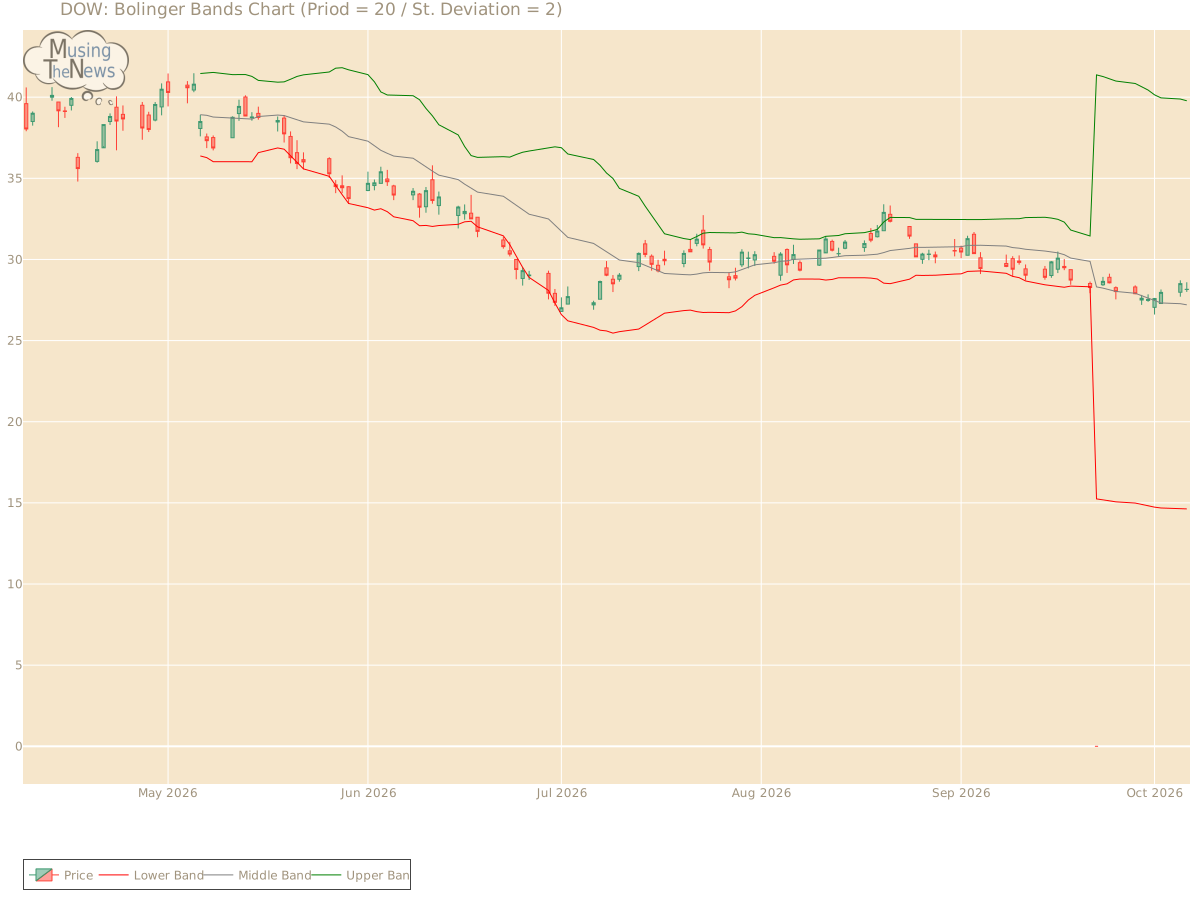
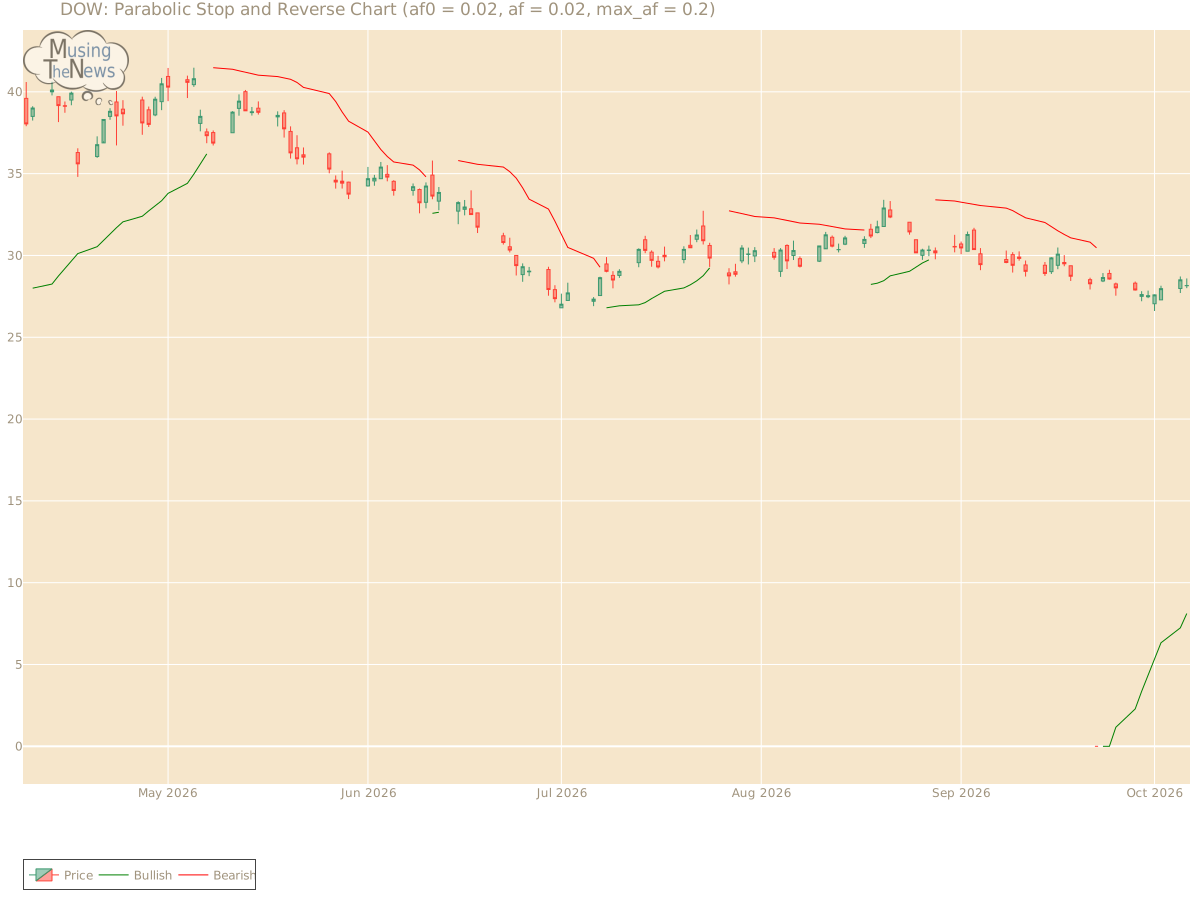
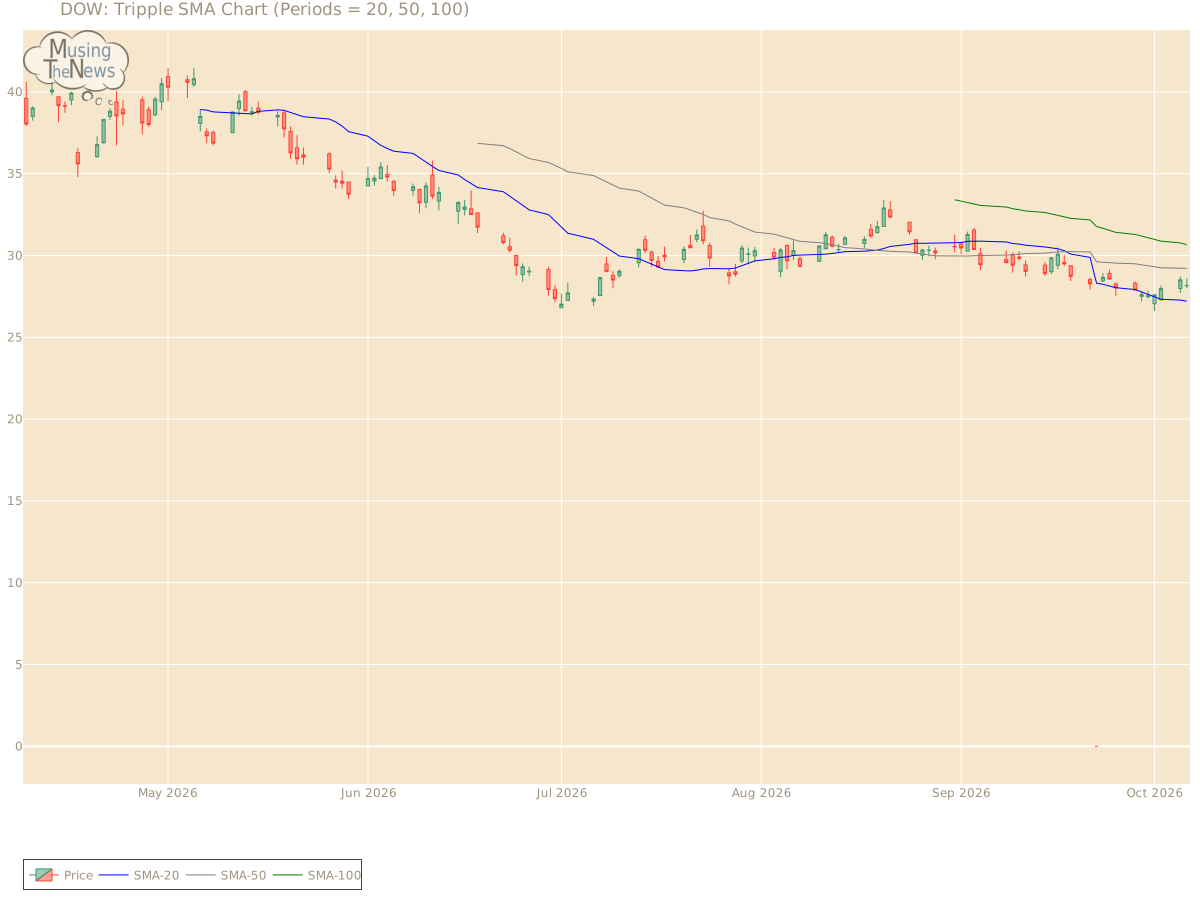
Support and Resistance: The price of 28.16 is supported at 0.0 and faces resistance at 28.75. This range suggests key levels for DOW where the price may stabilize, with 0.0 acting as a support and 28.75 as a cap on gains.Support/Resistance for DOWAroon: The AROON is in a neutral stance for DOW, not indicating a clear upward or downward trend. This suggests a period of market indecision, where neither bulls nor bears have the upper hand.Aroon chart for Dow Inc.Bol. Bands: The BOLL BANDS is currently in a neutral position, offering no clear indication of movement up or down. This suggests that the market may be experiencing a period of equilibrium, with no strong trend in play.Bolinger Bands chart for Dow Inc.Parabolic SAR: The PSAR remains bullish, setting a strong support level that could underpin further upward movement. This persistent bullish outlook suggests that the market may continue its positive trajectory, with the established support acting as a safety net.Parabolic Stop and Reverse chart for Dow Inc.Stochastic: The stochastic indicator shows bullish conditions, with the K-line positioned above the D-line and exceeding the 80 level. This setup suggests strong upward momentum, indicating that the market may continue to rise. Investors might view this as a favorable sign for continued growth.Stochastic chart for Dow Inc.Tripple Moving Agerage: A bullish trend is signaled by the alignment of the 20-50-100 period moving averages, but the slopes of the faster averages suggest a potential reversal. The weakening momentum in the shorter-term averages hints that the current upward trend might be nearing its end, signaling the possibility of a shift in direction.Tripple SMA chart for Dow Inc. Before diving into the technical aspects of a company, such as stock price charts or volume trends, it's important to understand its fundamentals. These fundamentals include financial stability, growth potential, and strategic positioning. Additionally, knowing the broader industry landscape, including competitive pressures and regulatory factors, offers deeper insights. When this fundamental analysis is combined with technical indicators, it leads to more informed, accurate evaluations of the company's overall performance.