The BOLL BANDS is in a neutral stance, with no clear signals for movement up or down. This neutral position indicates a potential period of consolidation or uncertainty in ...
By MusingTheNews
Updated 2026-10-07 23:26:09
Overall Technical outlook
Price Summary
Dover Corporation's stock started trading at 192.88 on 2026-10-06, climbed to 194.77, fell to 191.41, and closed -0.52% down at 191.88, with 934900 shares traded. In the last 52 weeks, the stock's top price was 233.31 and the bottom price was 0.0.
Technicals
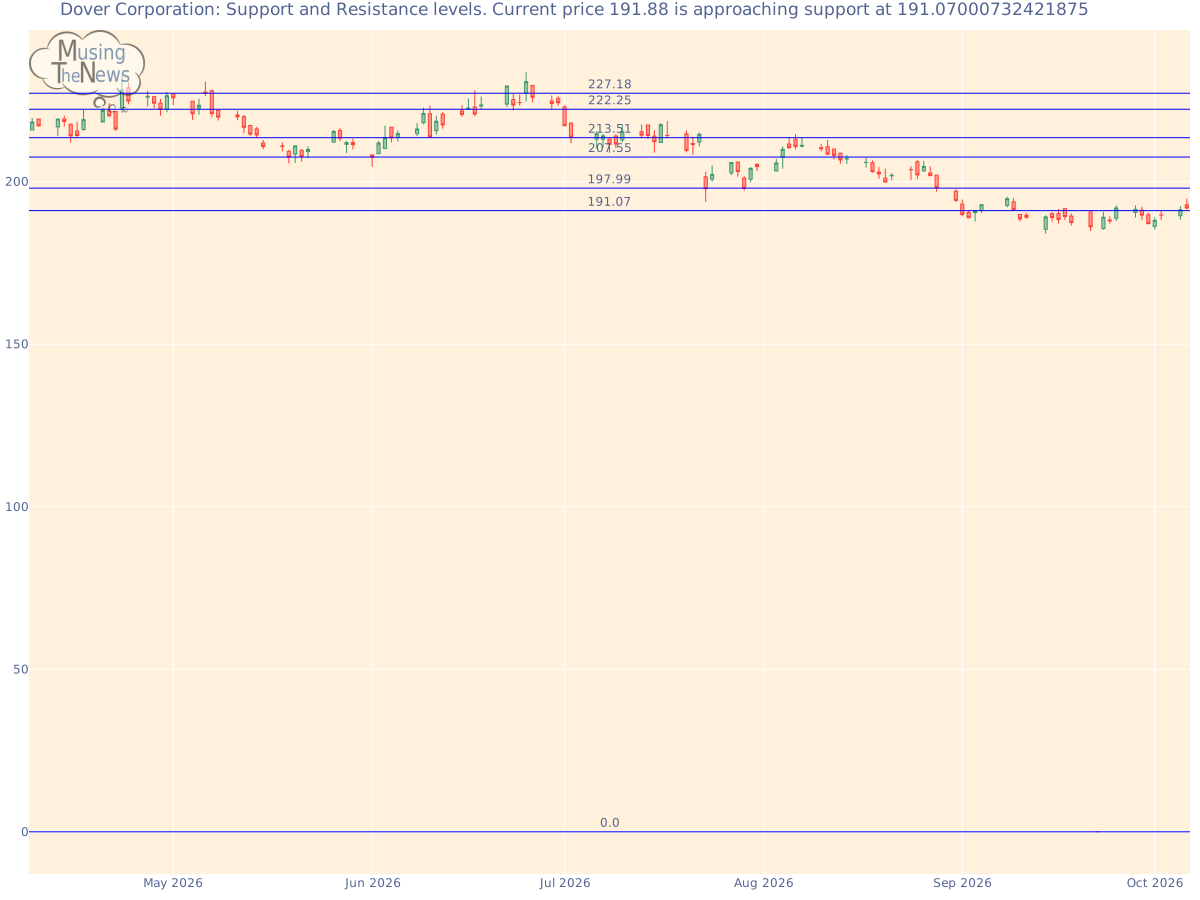
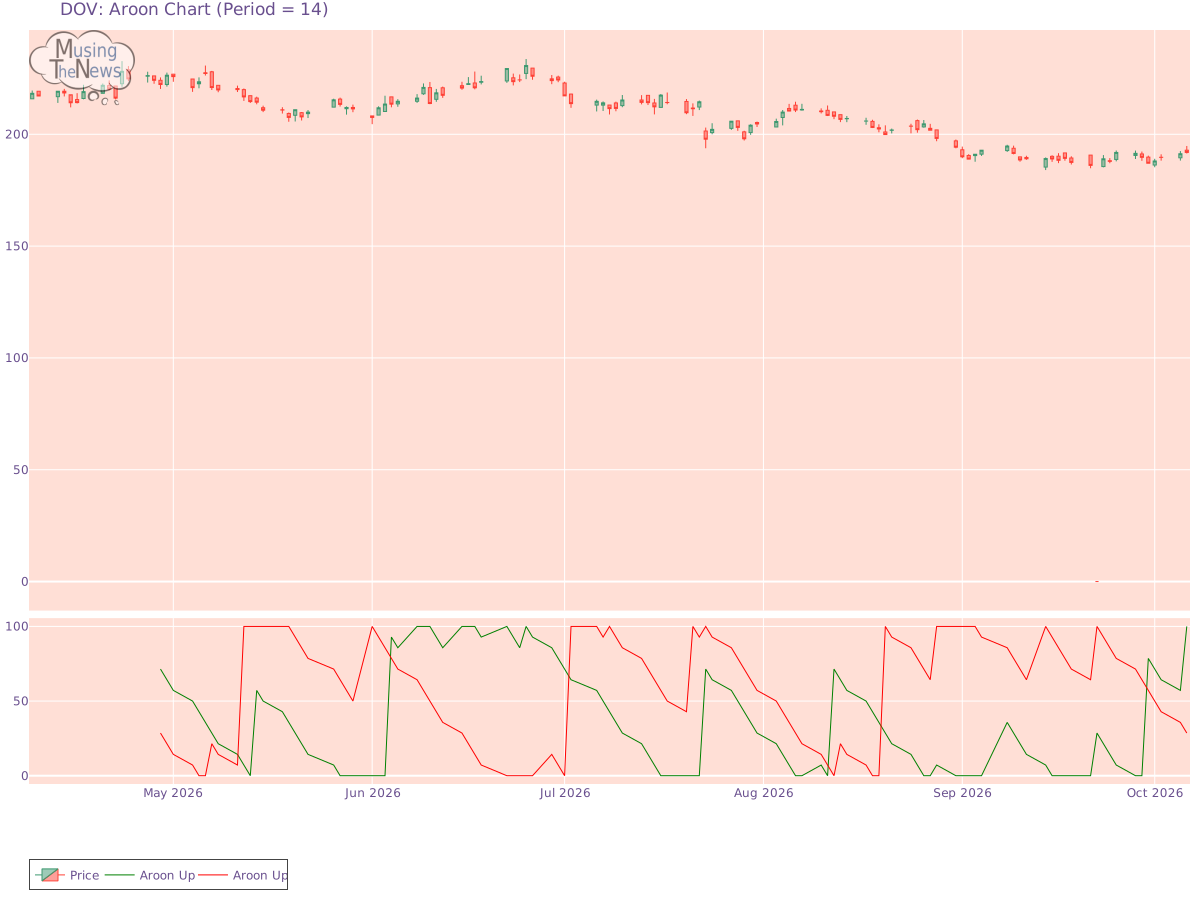
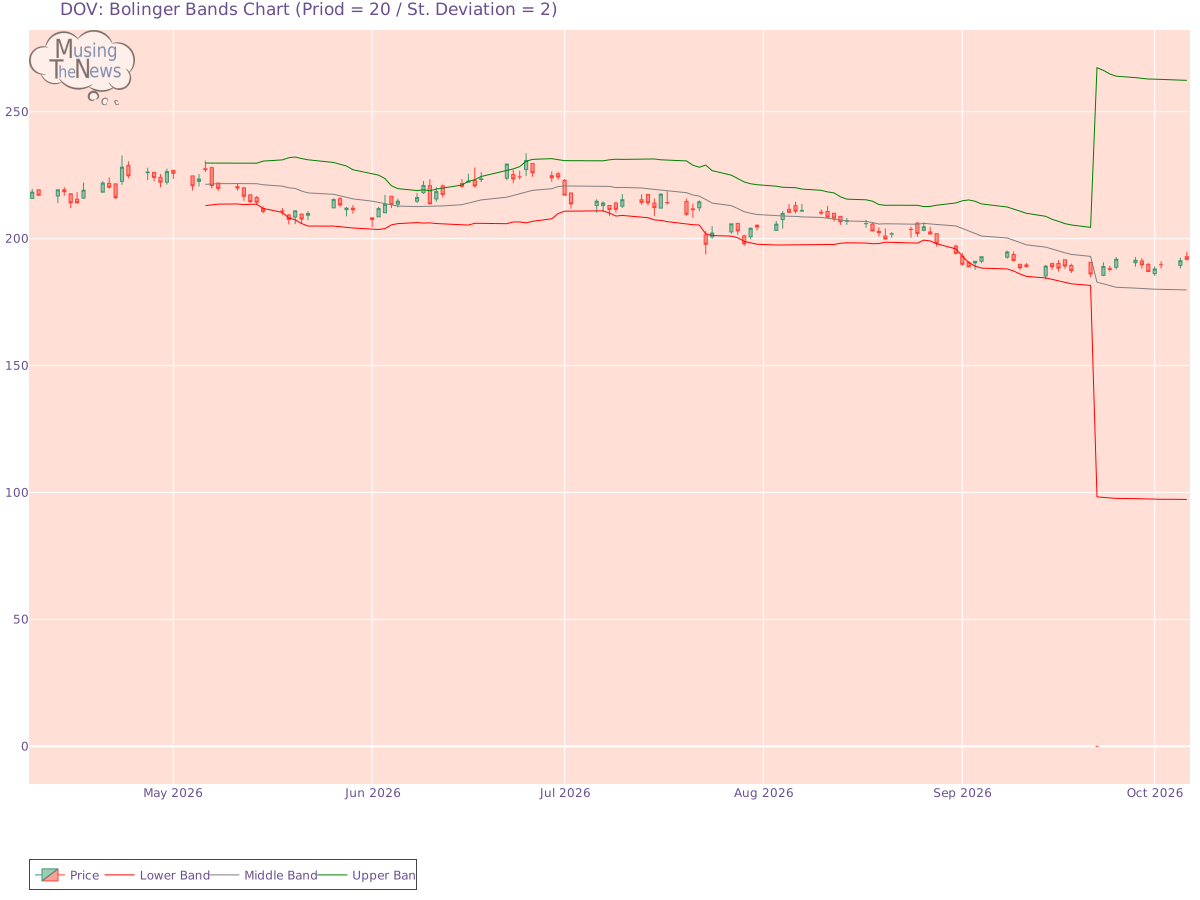
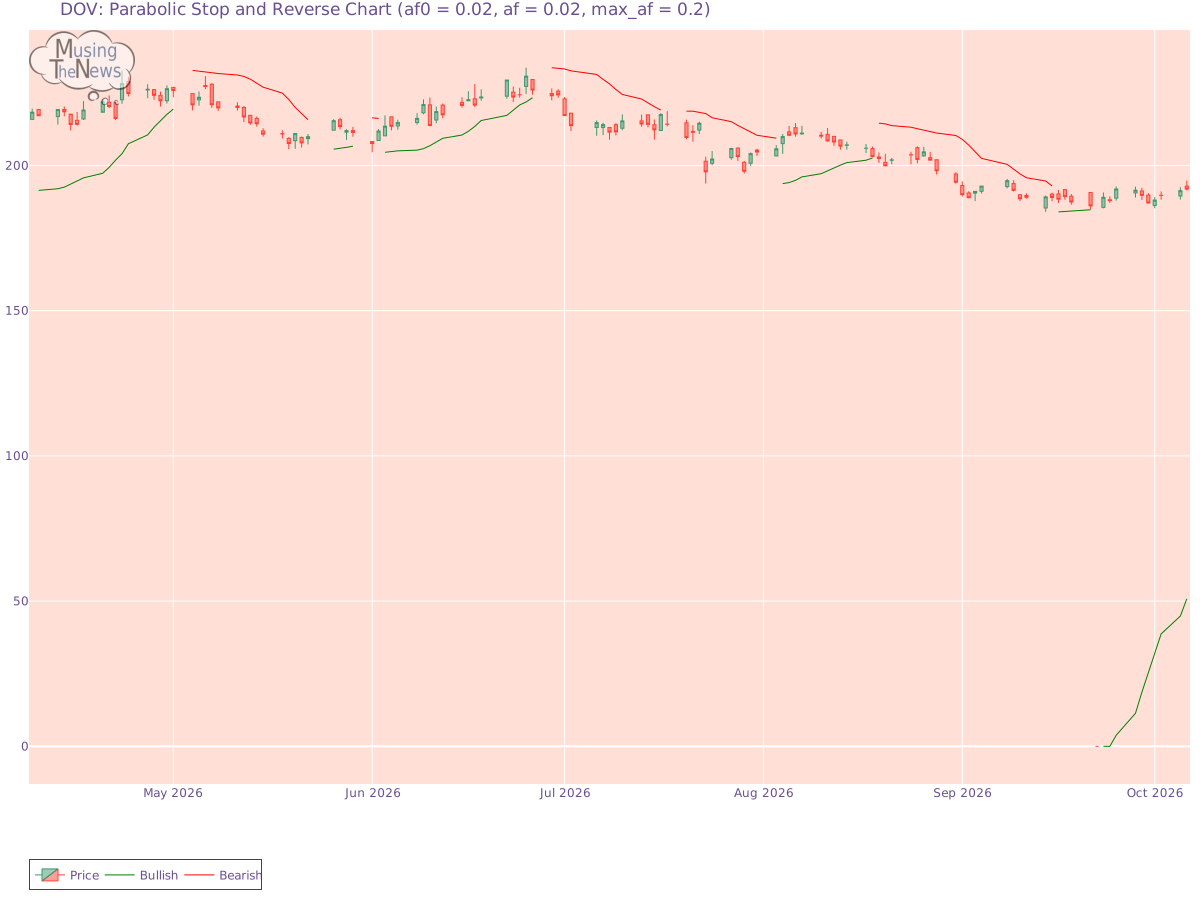
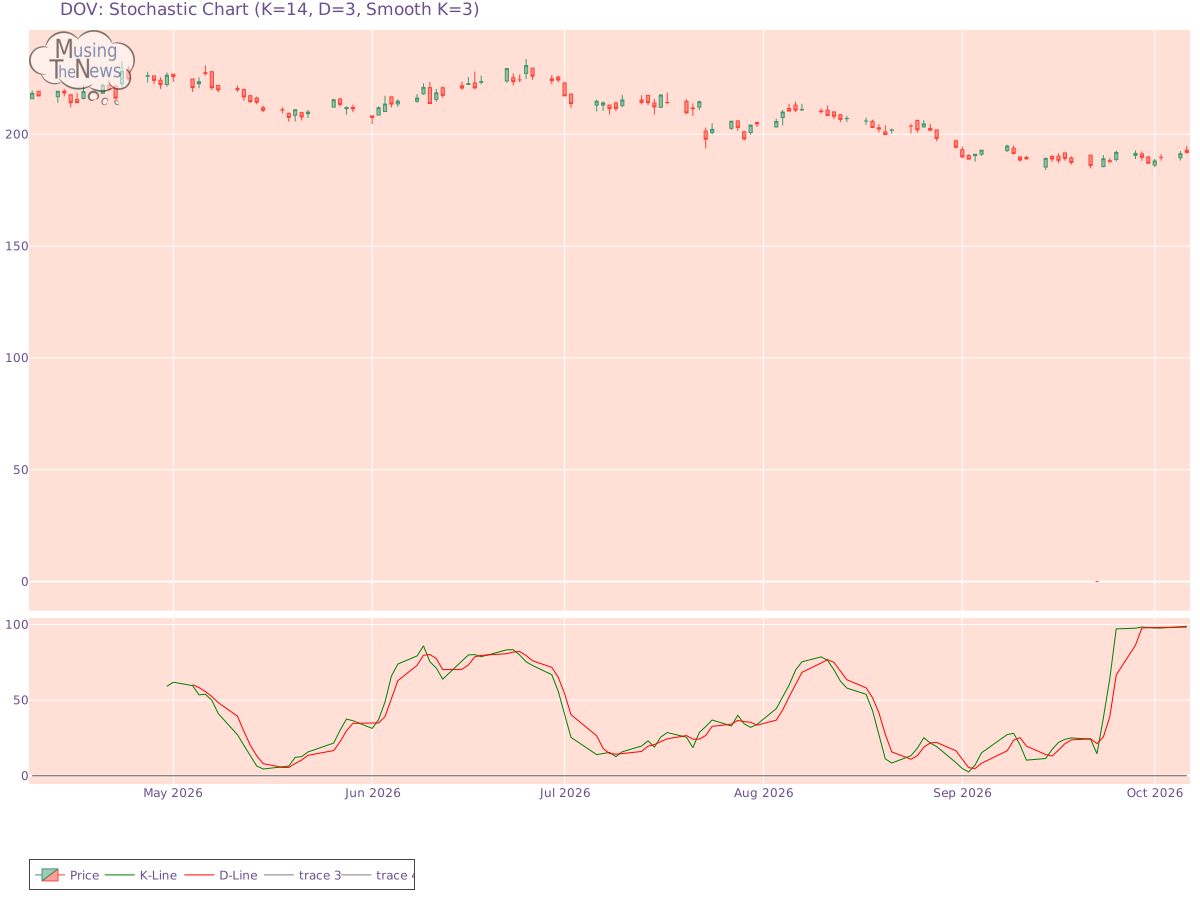
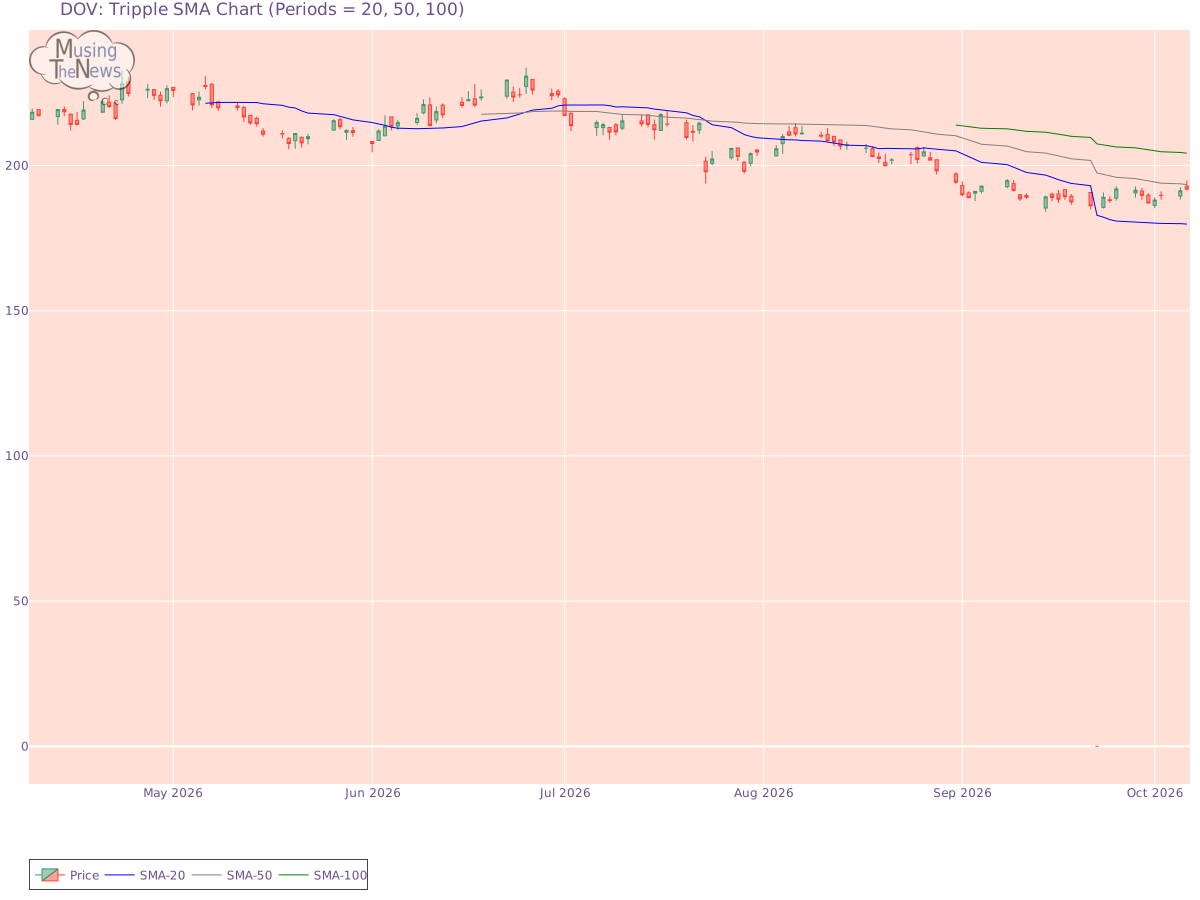
Support and Resistance: The price sits at 191.88, supported by 191.07 and resisted by 197.99. This indicates a trading range where 191.07 provides a floor, preventing declines, and 197.99 acts as a ceiling, limiting further price increases for DOV.Support/Resistance for DOVAroon: The continuation of Aroon's bullish trend, with Aroon Up at the 100 level, signals ongoing strength. To fully understand the implications of this trend, it should be examined further in conjunction with other technical indicators.Aroon chart for Dover CorporationBol. Bands: The BOLL BANDS is in a neutral stance, with no clear signals for movement up or down. This neutral position indicates a potential period of consolidation or uncertainty in the market.Bolinger Bands chart for Dover CorporationParabolic SAR: The PSAR remains bullish in its outlook, setting a key support level that could sustain the ongoing upward trend. This strong support indicates that the market may continue to rise, with the bullish momentum likely to persist for DOV.Parabolic Stop and Reverse chart for Dover CorporationStochastic: The stochastic indicator for DOV reflects a bullish outlook, with the K-line positioned above the D-line and surpassing the 80 mark. This setup suggests strong upward momentum, implying that the market may continue to rise. Investors may interpret this as a positive signal for further gains.Stochastic chart for Dover CorporationTripple Moving Agerage: The moving averages for the 20-50-100 periods point to a bullish trend for DOV, though the slopes of the faster averages suggest that this strength may be waning. The potential for a reversal is becoming evident, as the shorter-term averages indicate that the current upward momentum could be losing steam.Tripple SMA chart for Dover Corporation Before focusing on technical indicators like stock price and volume, it's important to consider a company's fundamentals. These include financial metrics such as profitability, revenue growth, and debt levels. Furthermore, understanding the industry landscape, including competition and consumer trends, provides essential context. By combining this fundamental analysis with technical data, investors can make more informed decisions and draw deeper conclusions about the company's potential for future growth and success.