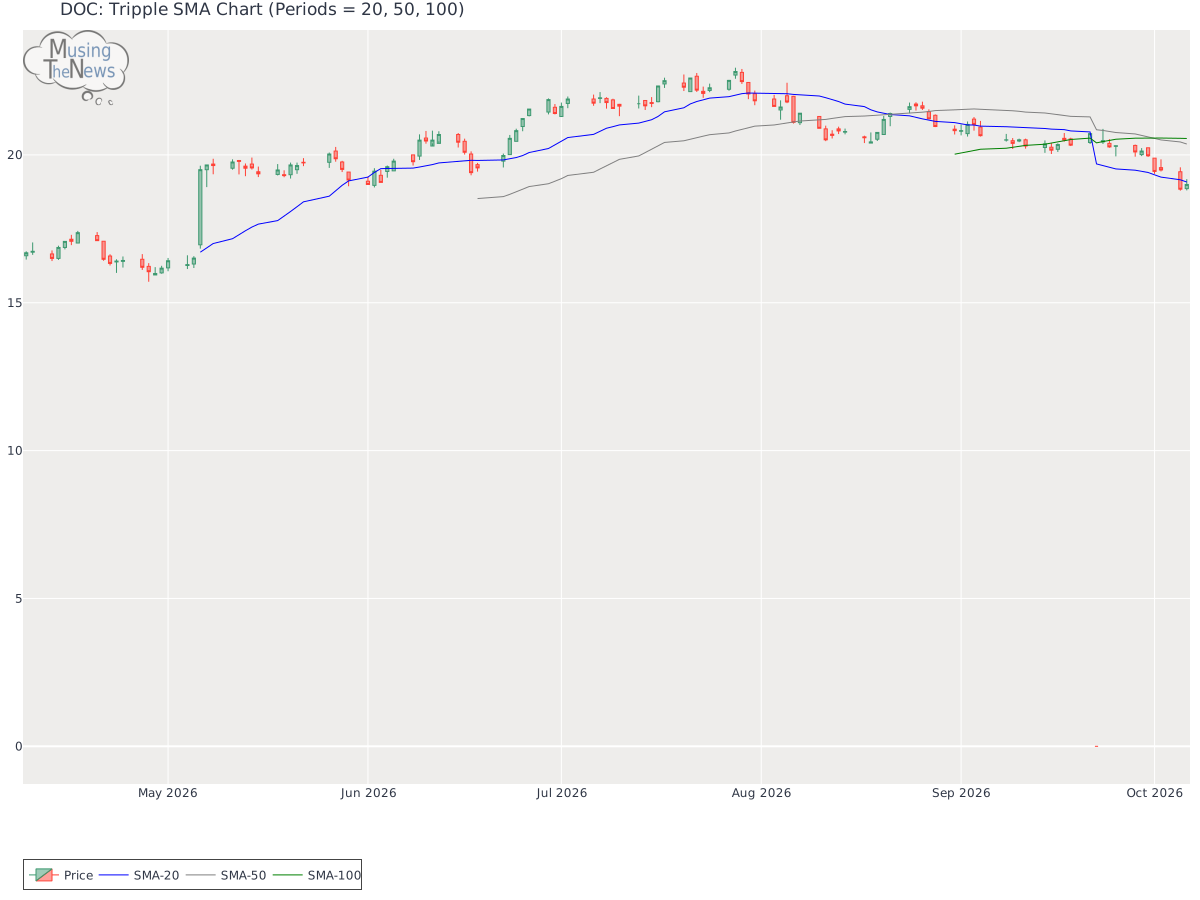
A bullish trend is evident from the alignment of the 20-50-100 period moving averages, but the slopes of the faster averages indicate a potential reversal for DOC. The weak...
By MusingTheNews
Updated 2026-10-07 23:26:22
Overall Technical outlook
Price Summary
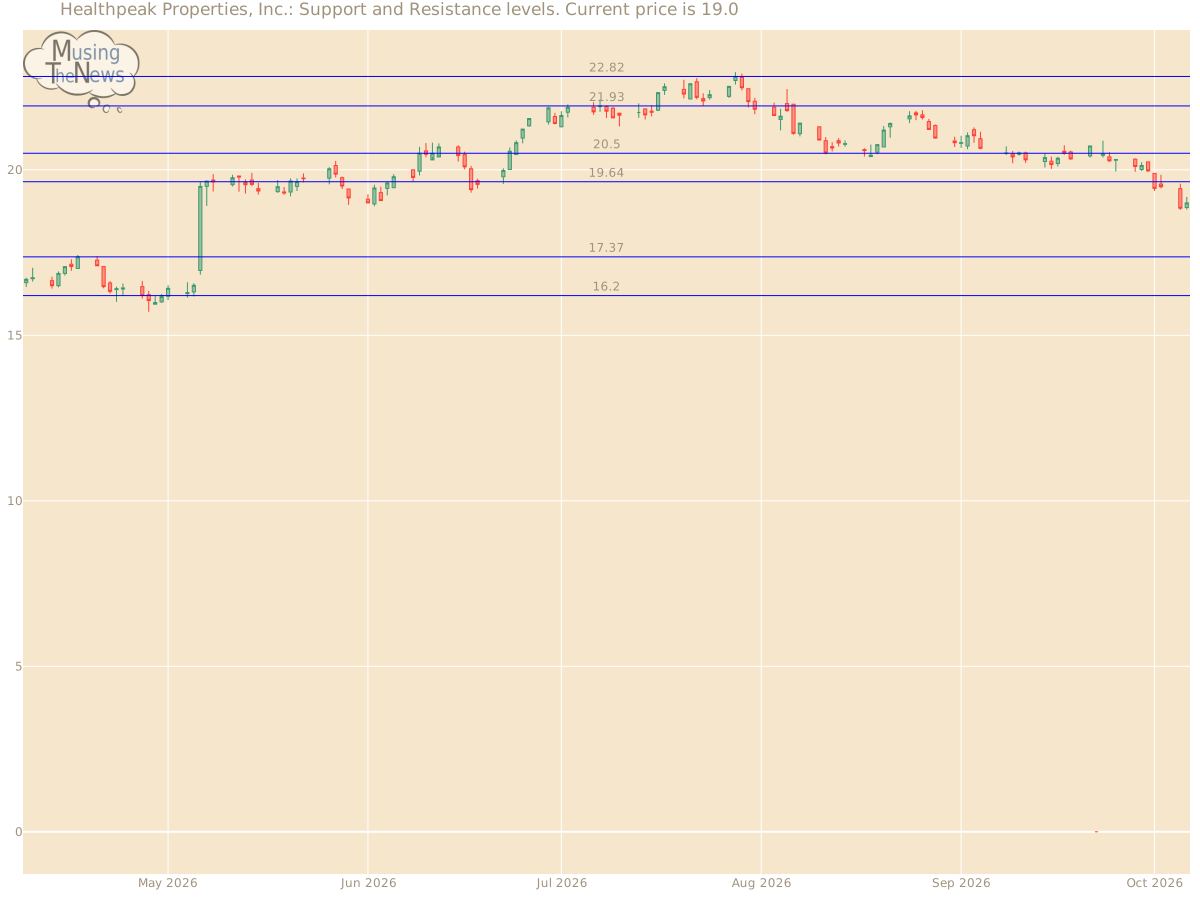
Healthpeak Properties, Inc.'s stock opened at 18.86 on 2026-10-06, surged to 19.18, hit a low of 18.8, and closed up 0.74% at 19.0, with 8304800 shares traded. For the 52-week period, the stock's highest price is 22.82, and the lowest price is 0.0.
Technicals
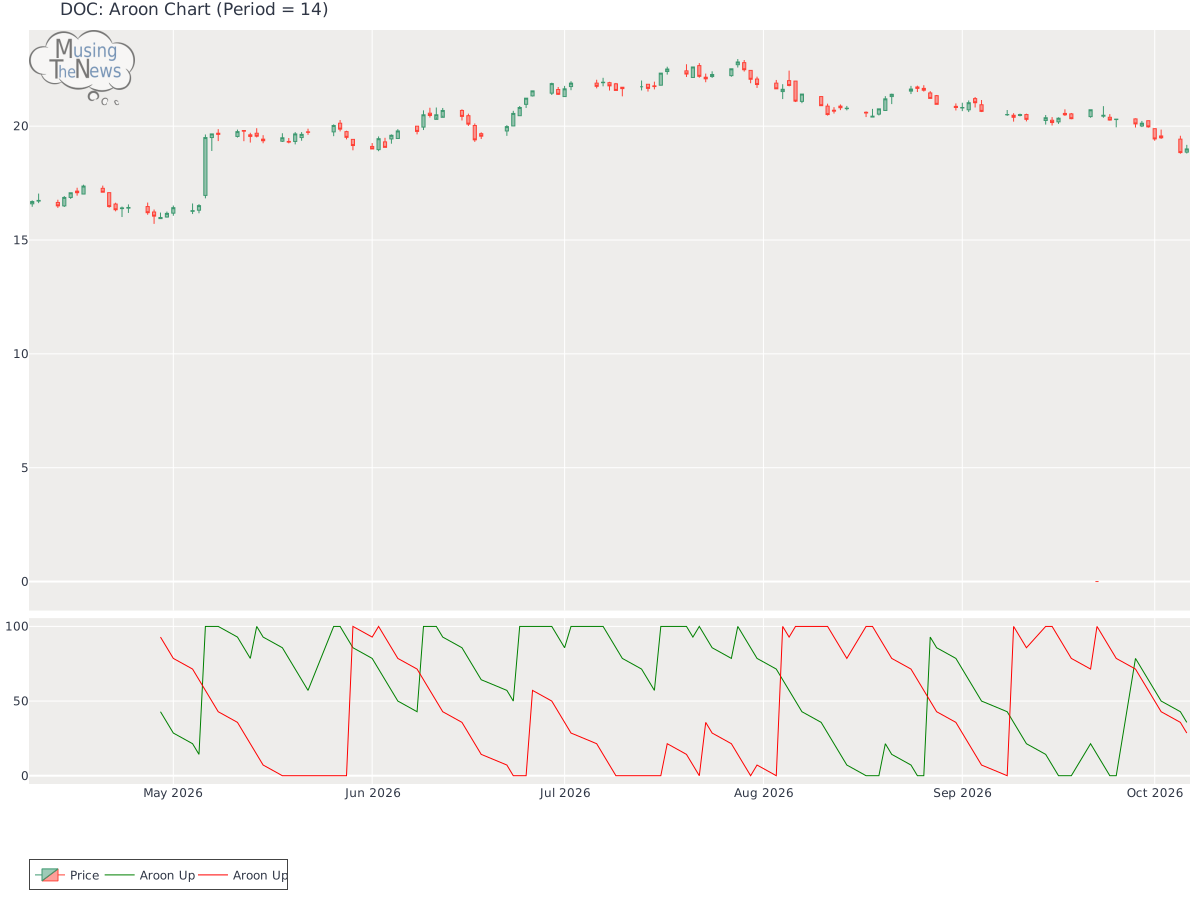
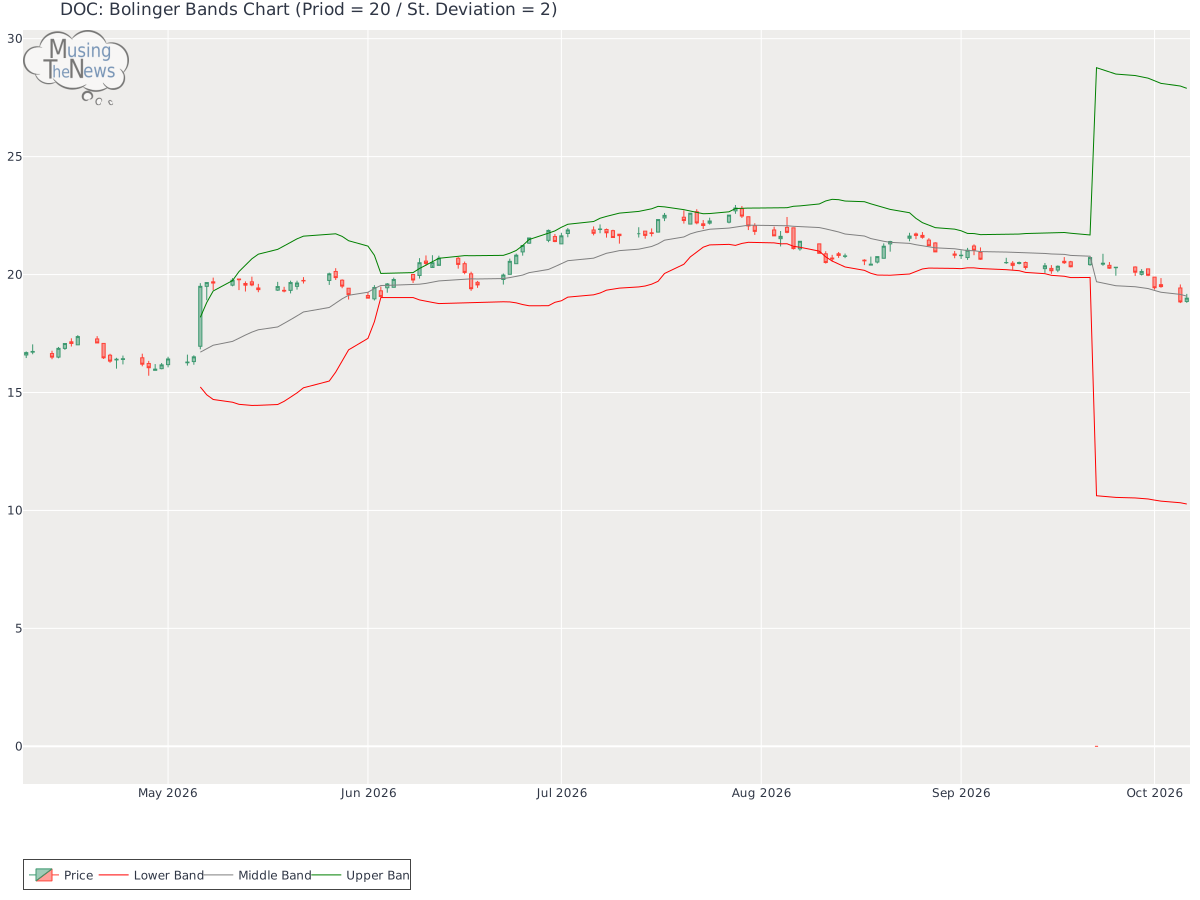
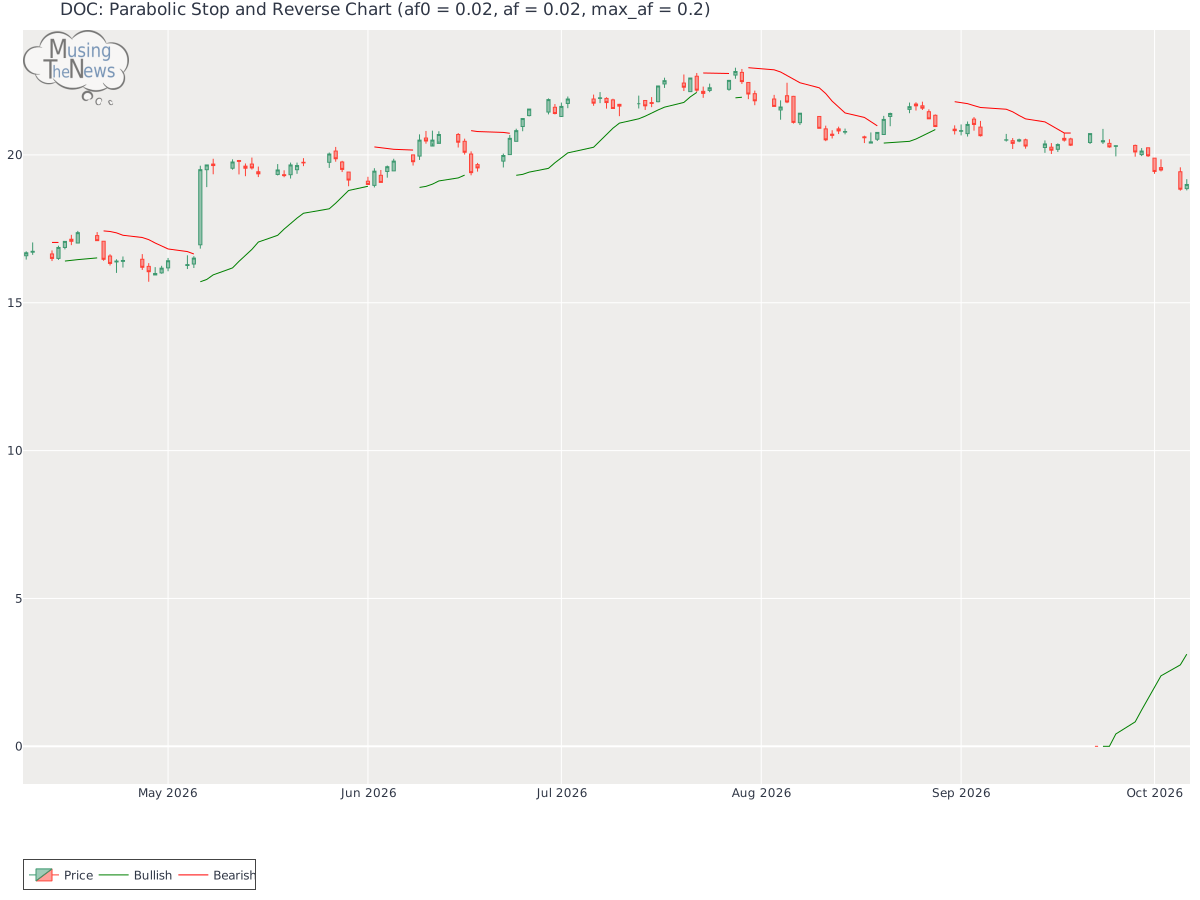
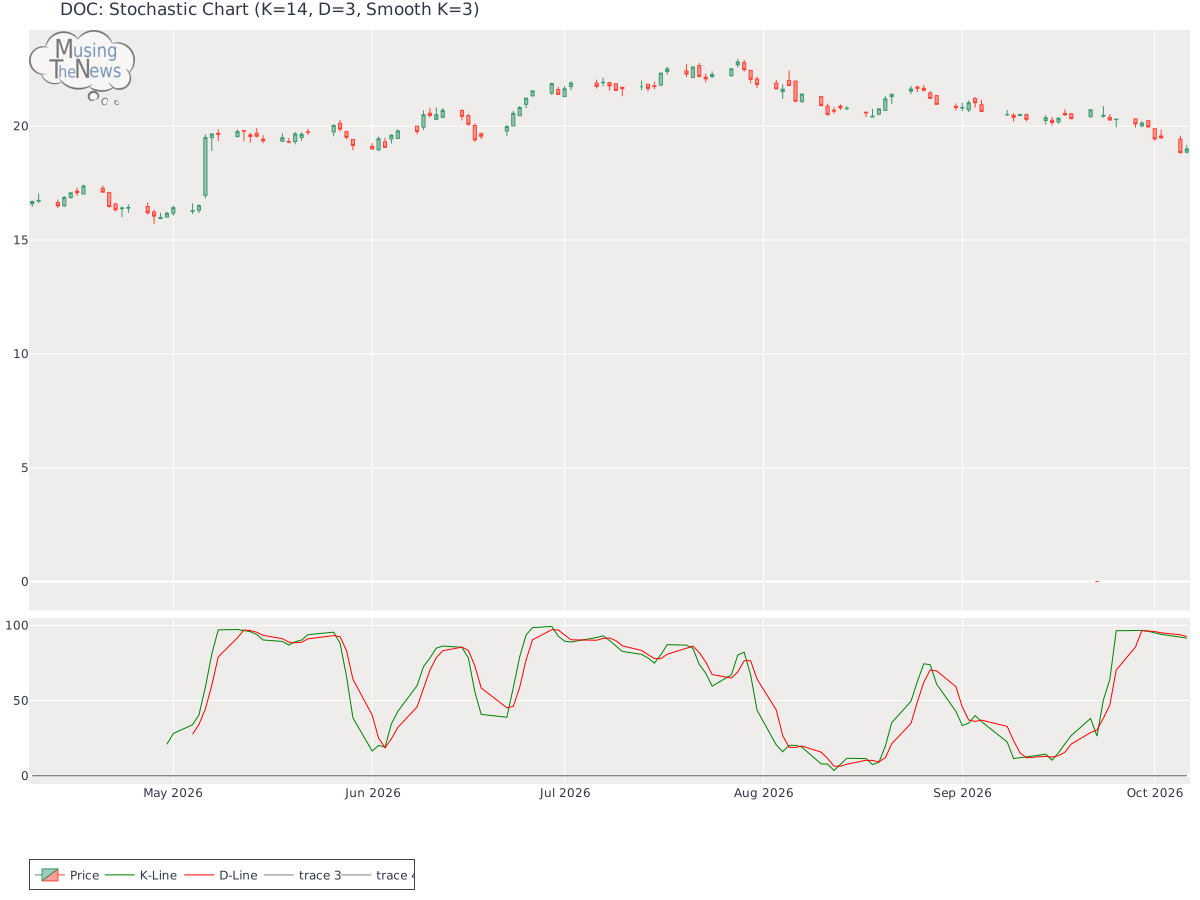
Support and Resistance: At 19.0, the price is held up by support at 17.37 and faces resistance at 19.64 for DOC. This suggests a trading range where 17.37 provides a base and 19.64 limits upward movement.Support/Resistance for DOCAroon: The current reading of the AROON indicator suggests a neutral stance, with no clear signals indicating an upward or downward direction. This lack of directional bias suggests the market may be in a period of consolidation or uncertainty.Aroon chart for Healthpeak Properties, Inc.Bol. Bands: The current reading of the BOLL BANDS is neutral for DOC, with no clear signals for an upward or downward trend. This indicates that the market may be in a state of uncertainty, with no dominant force driving the direction.Bolinger Bands chart for Healthpeak Properties, Inc.Parabolic SAR: The PSAR remains bullish in its outlook, setting a key support level that could sustain the ongoing upward trend. This strong support indicates that the market may continue to rise, with the bullish momentum likely to persist for DOC.Parabolic Stop and Reverse chart for Healthpeak Properties, Inc.Stochastic: The K-line has dipped below the D-line on the stochastic indicator while staying above 80, indicating that a bearish price move may be imminent. This pattern suggests that the market's upward momentum is faltering for Healthpeak Properties, Inc., which could result in a reversal. Investors should pay attention to this potential change in trend.Stochastic chart for Healthpeak Properties, Inc.Tripple Moving Agerage: A bullish trend is evident from the alignment of the 20-50-100 period moving averages, but the slopes of the faster averages indicate a potential reversal for DOC. The weakening signals from the shorter-term averages suggest that the upward momentum may be fading, signaling the possibility of an impending change in trend.Tripple SMA chart for Healthpeak Properties, Inc. Analyzing the technical indicators of a company, such as stock price and trading volume, requires first understanding its fundamentals. These fundamentals include profitability, growth potential, and market position. Furthermore, knowing the broader industry trends and competitive landscape provides critical context. When both the company's internal data and the external environment are considered, it allows for more meaningful conclusions about the company's technical performance and future trajectory.