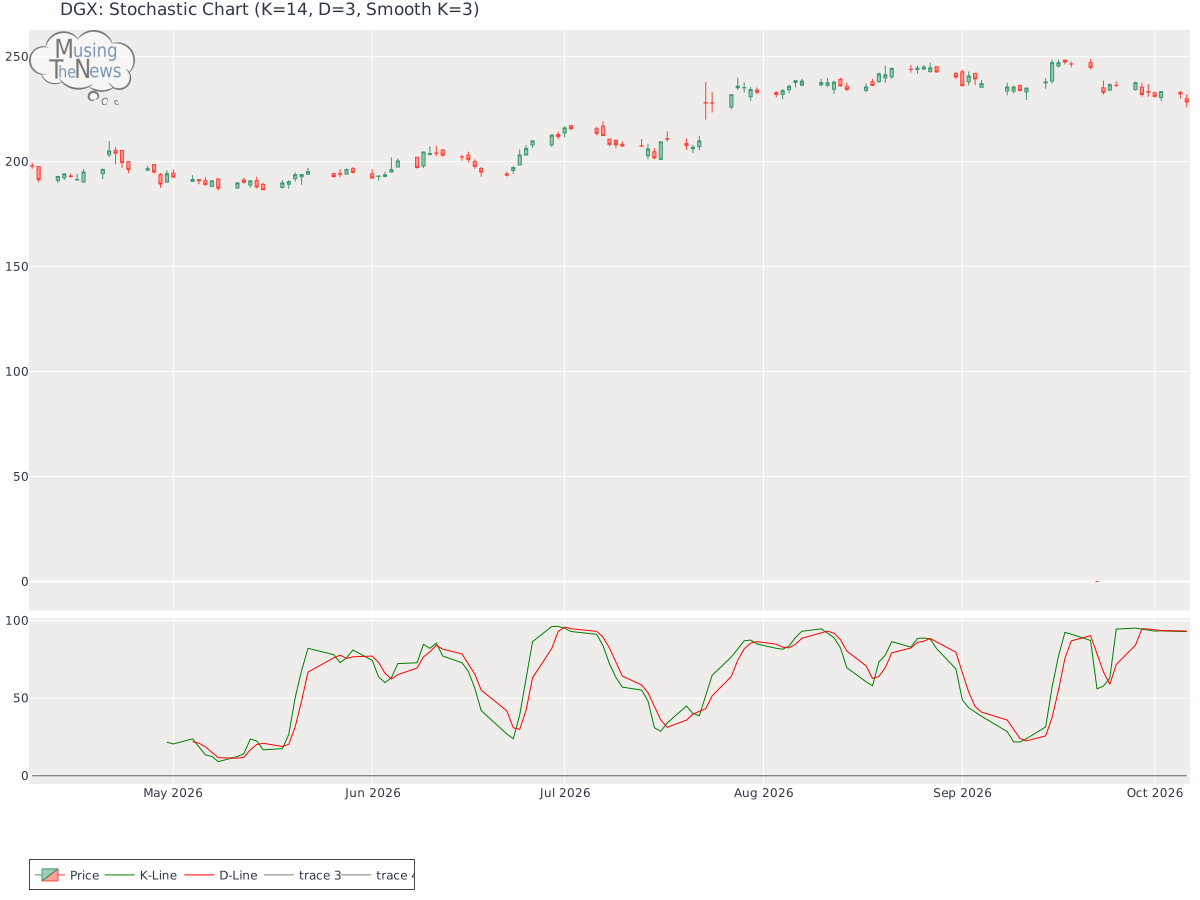
The K-line has moved below the D-line on the stochastic indicator, yet it remains above 80, signaling the potential beginning of a bearish price move for DGX. This pattern ...
By MusingTheNews
Updated 2026-10-07 23:26:49
Overall Technical outlook
Price Summary
On 2026-10-06, Quest Diagnostics Incorporated's stock opened at 229.92, reached 232.09, hit a low of 225.78, and rose -0.67% to close at 228.39, with 1783900 shares traded. In the last 52 weeks, the stock's top price was 247.45 and the bottom price was 0.0.
Technicals
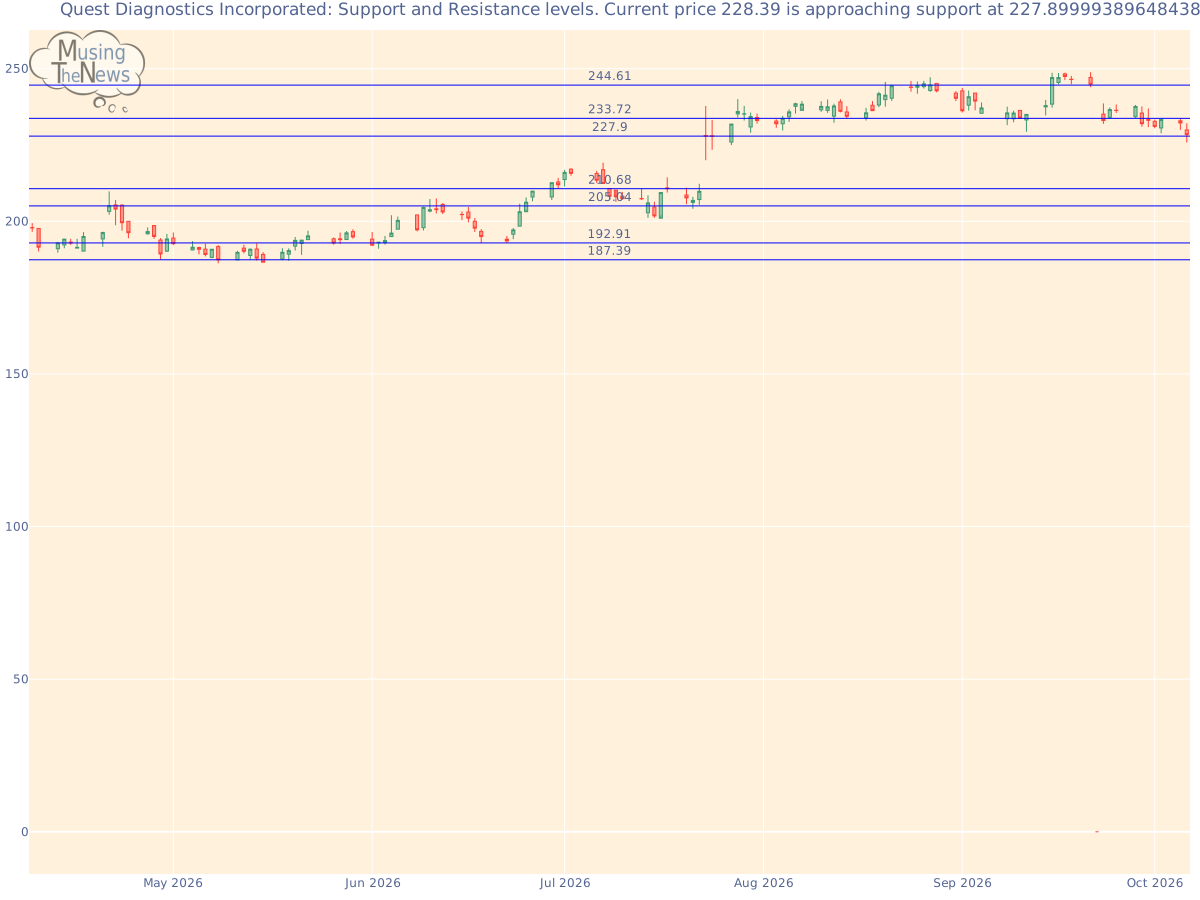
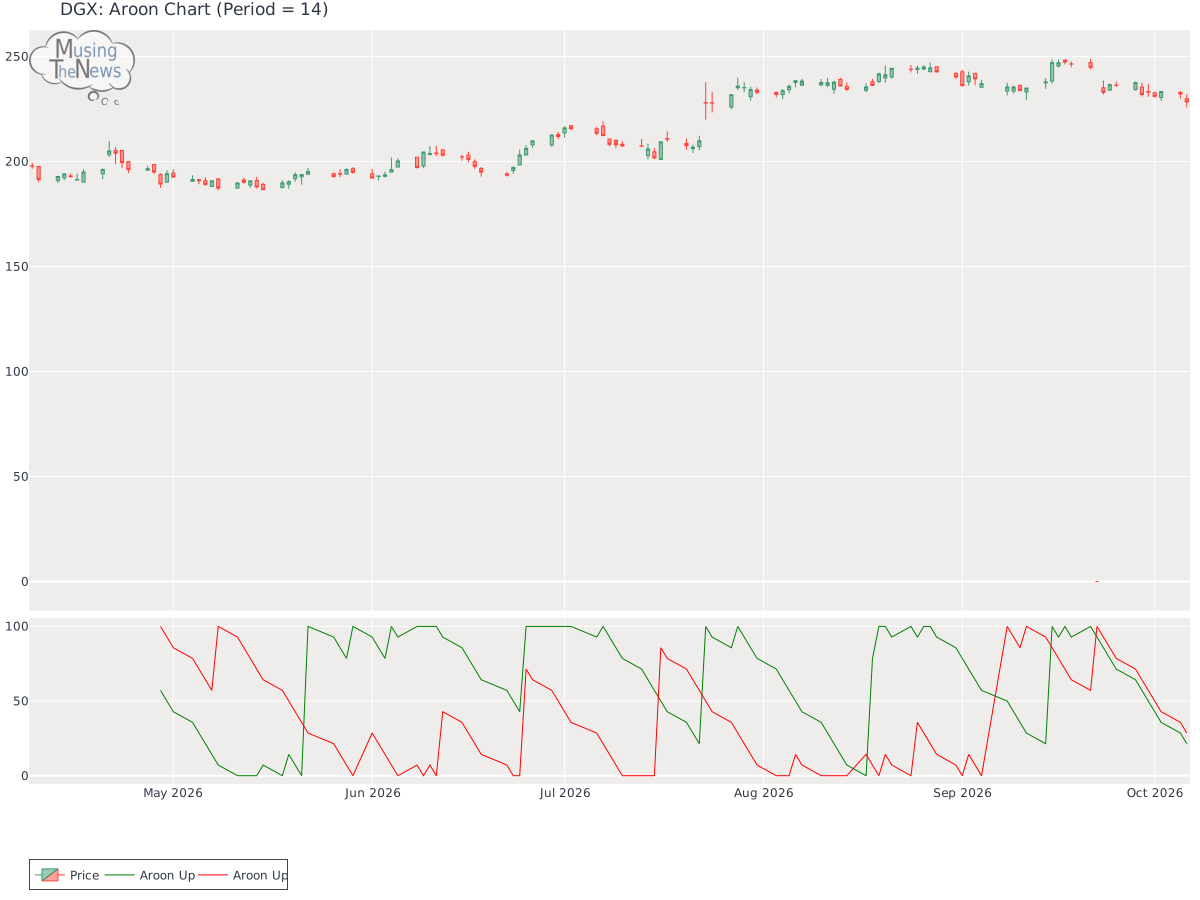
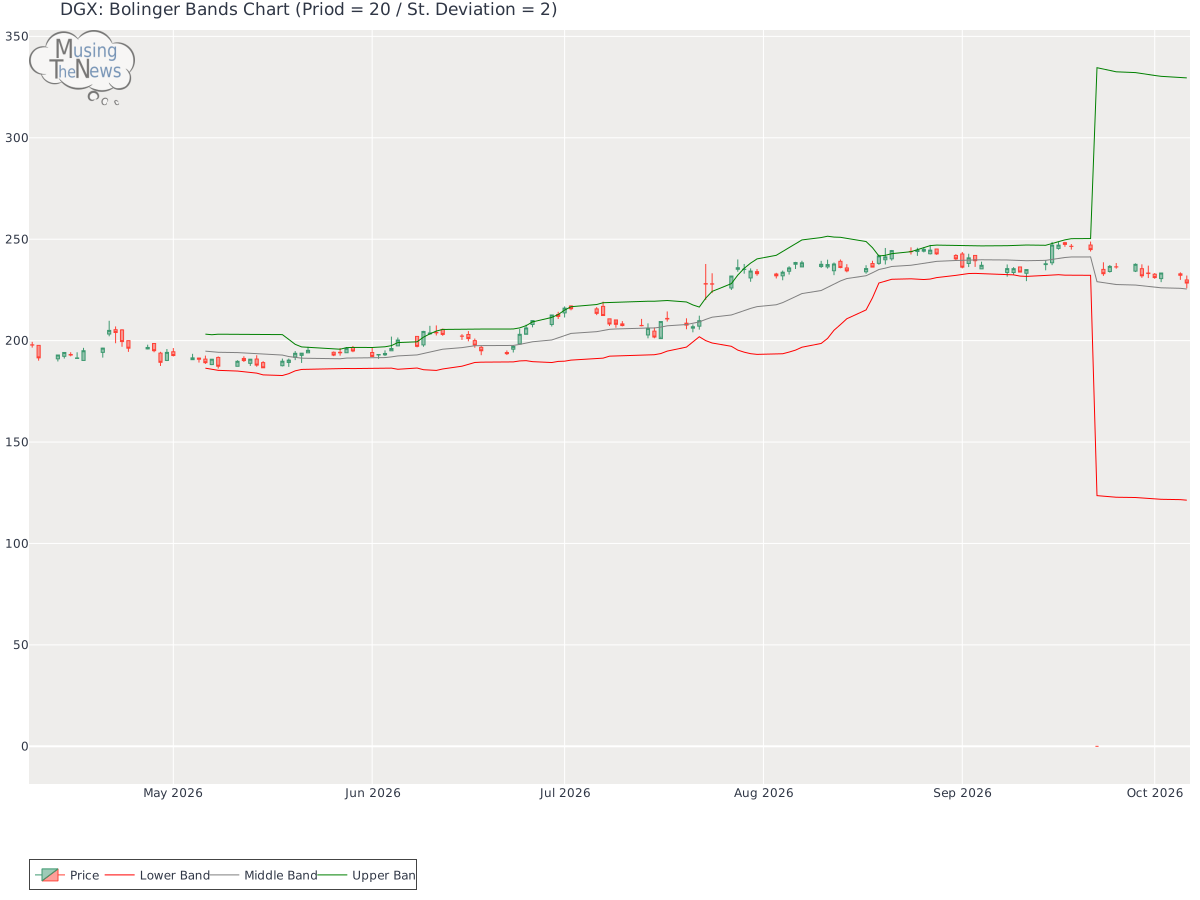
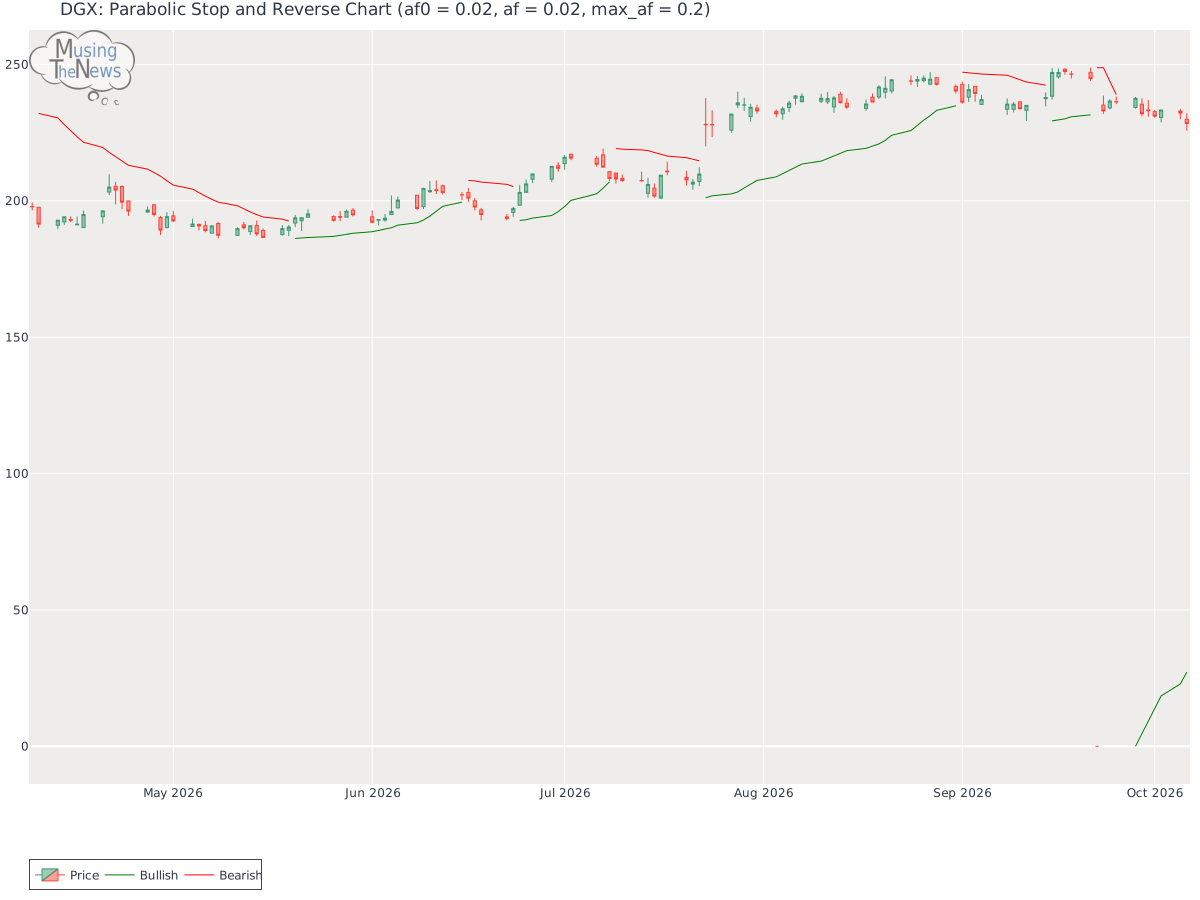
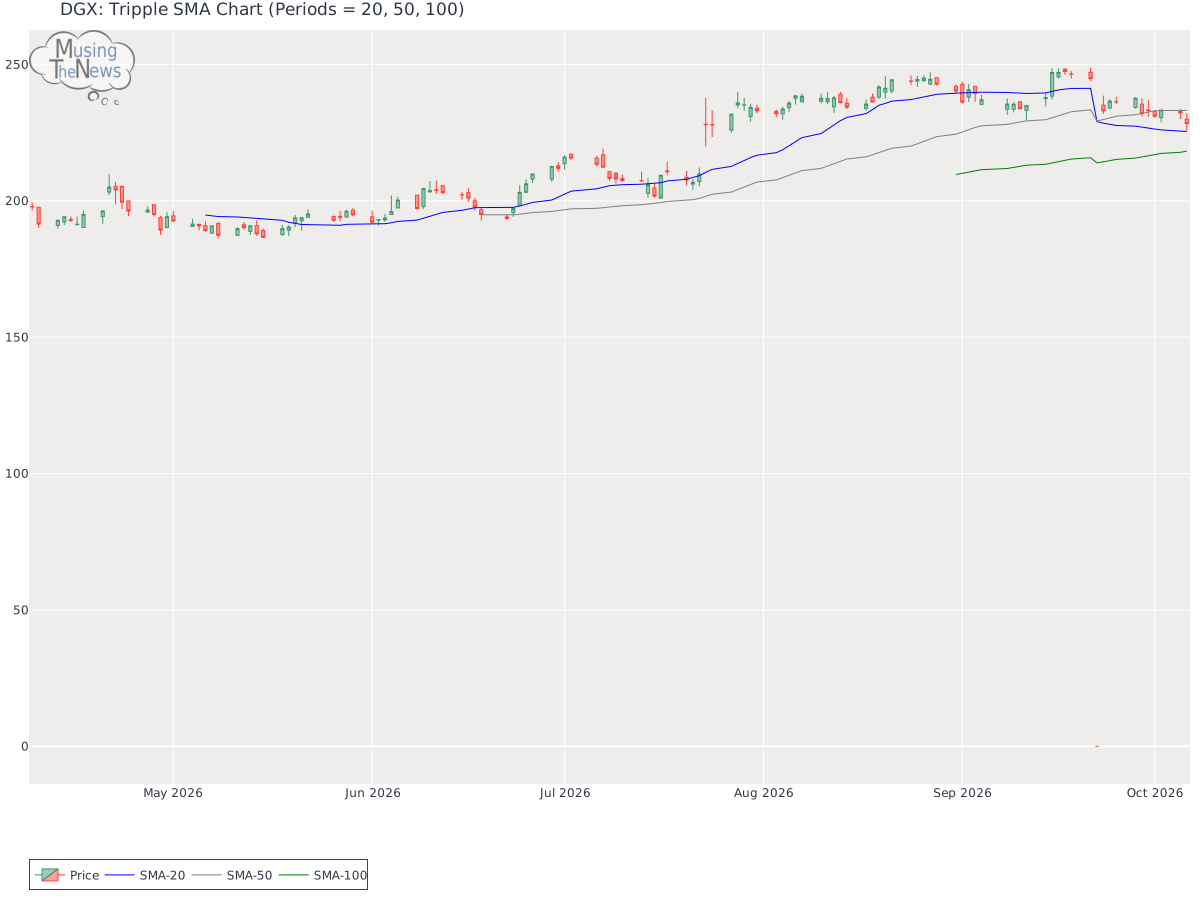
Support and Resistance: The price sits at 228.39, supported by 227.9 and resisted by 233.72. This indicates a trading range where 227.9 provides a floor, preventing declines, and 233.72 acts as a ceiling, limiting further price increases for DGX.Support/Resistance for DGXAroon: The AROON is in a neutral stance, with no clear direction indicated for the market. This lack of clarity suggests that the market may be in a state of equilibrium for DGX, with no strong trend emerging.Aroon chart for Quest Diagnostics IncorporatedBol. Bands: The BOLL BANDS is showing a neutral reading, with no clear direction indicated for upward or downward movement. This neutral position suggests a possible period of consolidation.Bolinger Bands chart for Quest Diagnostics IncorporatedParabolic SAR: The PSAR maintains a bullish outlook, reinforcing a support level that could help uphold the market's upward trend. This suggests that the market is likely to continue climbing, with the support providing a solid base for further gains.Parabolic Stop and Reverse chart for Quest Diagnostics IncorporatedStochastic: The K-line has moved below the D-line on the stochastic indicator, yet it remains above 80, signaling the potential beginning of a bearish price move for DGX. This pattern may indicate that the market's upward momentum is starting to wane, possibly leading to a downturn. Investors should watch for further confirmation.Stochastic chart for Quest Diagnostics IncorporatedTripple Moving Agerage: The Tripple MOVING AVG is in a neutral stance, with no clear signals for movement up or down. This neutral position indicates a potential period of consolidation or uncertainty in the market.Tripple SMA chart for Quest Diagnostics Incorporated A comprehensive approach to analyzing a company requires considering both its technical and fundamental aspects. The company's fundamentals, such as its earnings, growth prospects, and financial health, provide a strong foundation for understanding technical indicators. Additionally, examining the industry it operates in helps contextualize the company's position within the broader market. By integrating these factors, one can gain more valuable insights into the company's stock performance and potential investment opportunities.