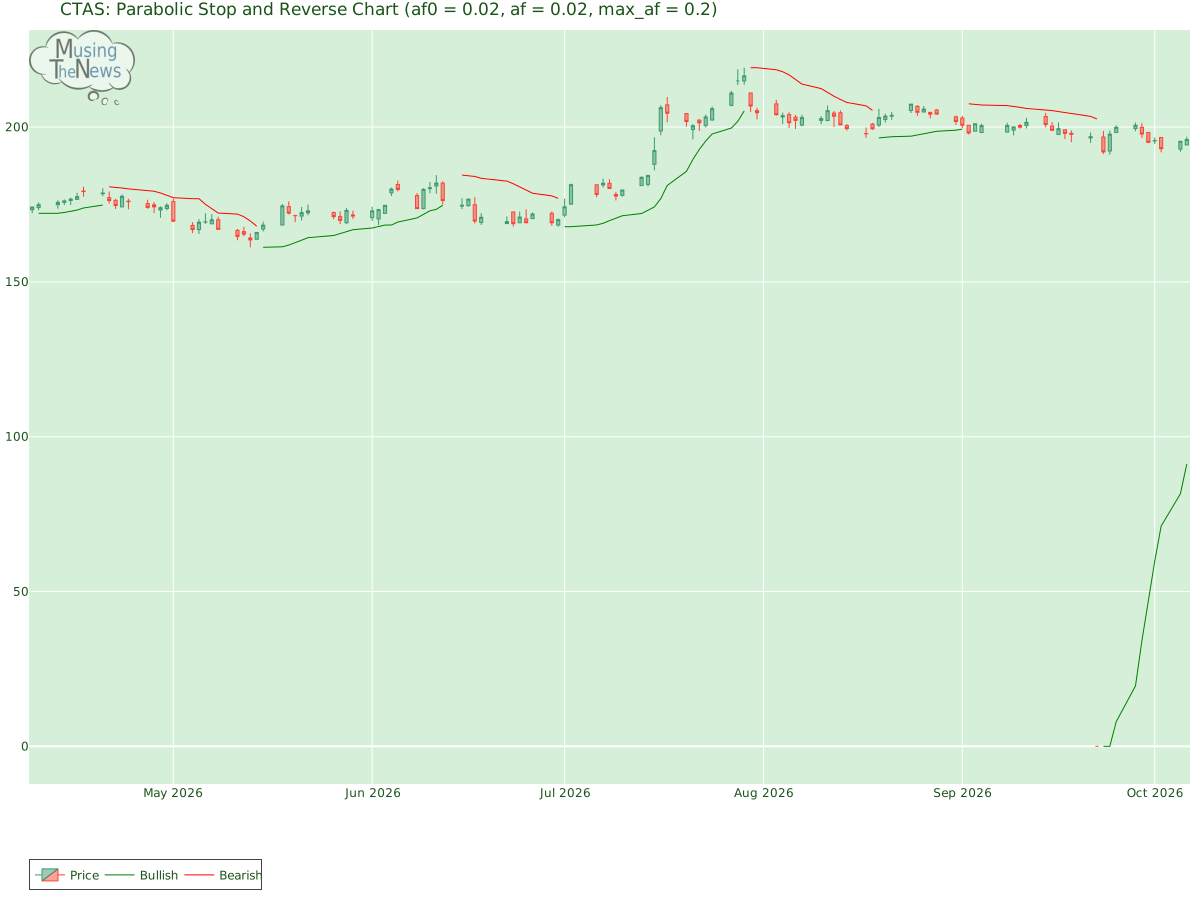
The PSAR remains bullish, establishing a key support level that could help uphold the market's upward trajectory. This persistent bullish outlook suggests that the market m...
By MusingTheNews
Updated 2026-10-07 23:26:00
Overall Technical outlook
Price Summary
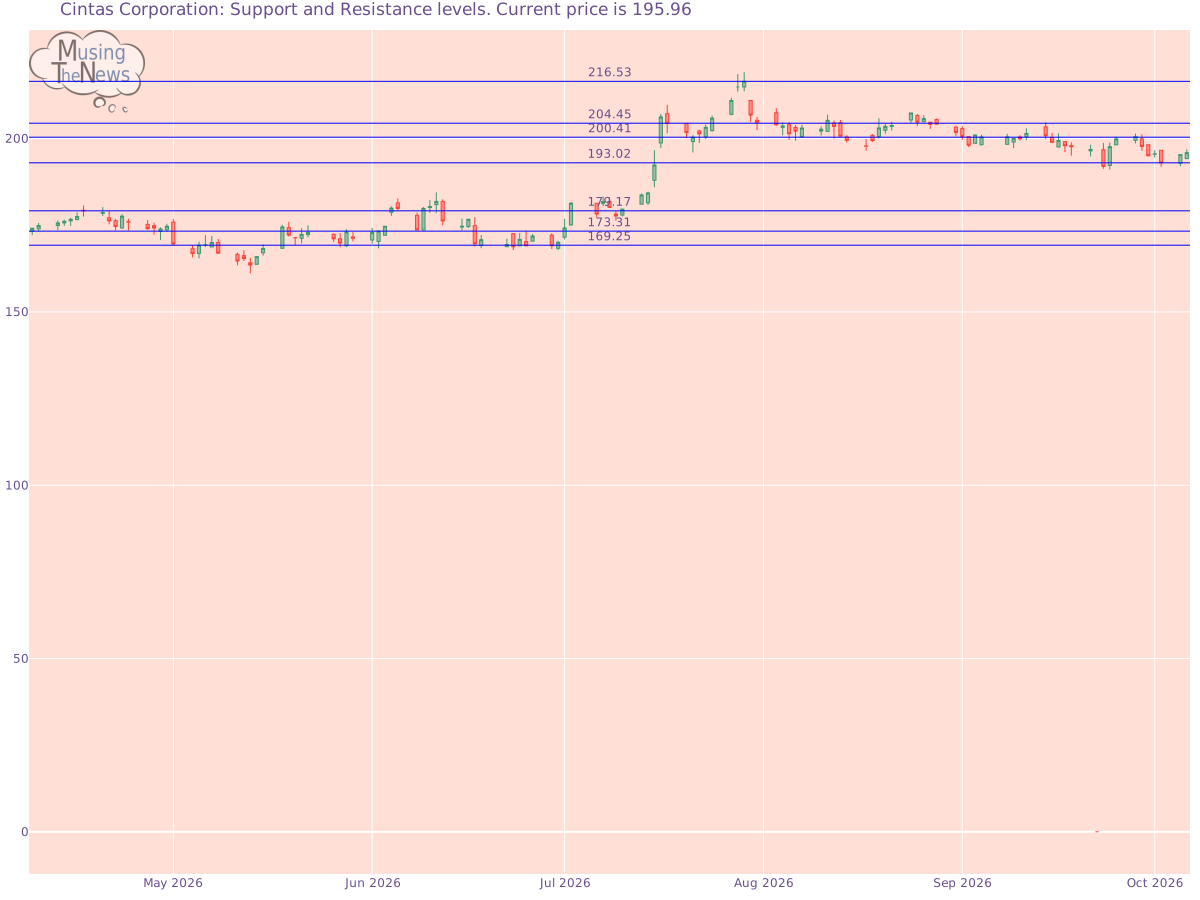
On 2026-10-06, Cintas Corporation's stock began at 194.22, peaked at 196.87, declined to 194.22, and ended the day 0.9% up at 195.96, with 1134600 shares traded. The stock's highest price over the 52-week span is 216.53, while the lowest price is 0.0.
Technicals
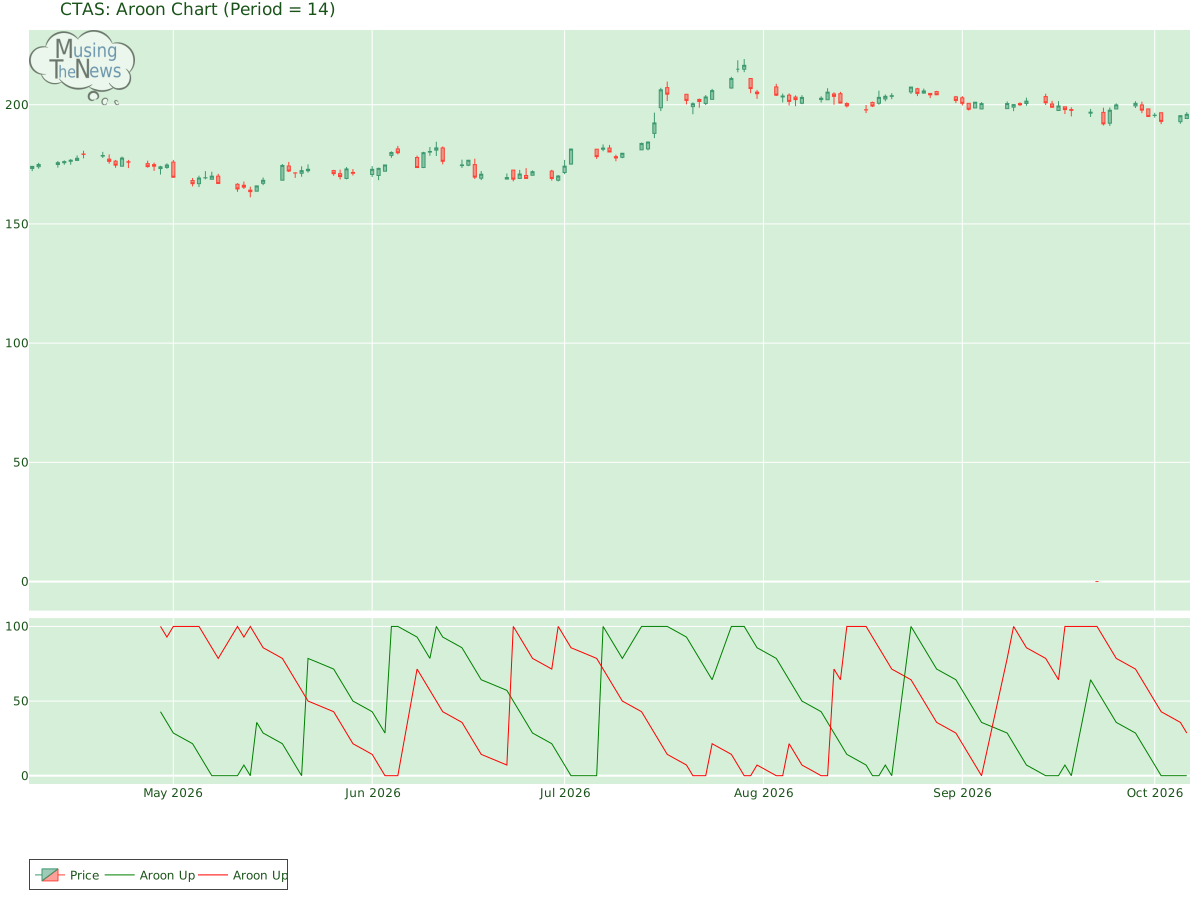
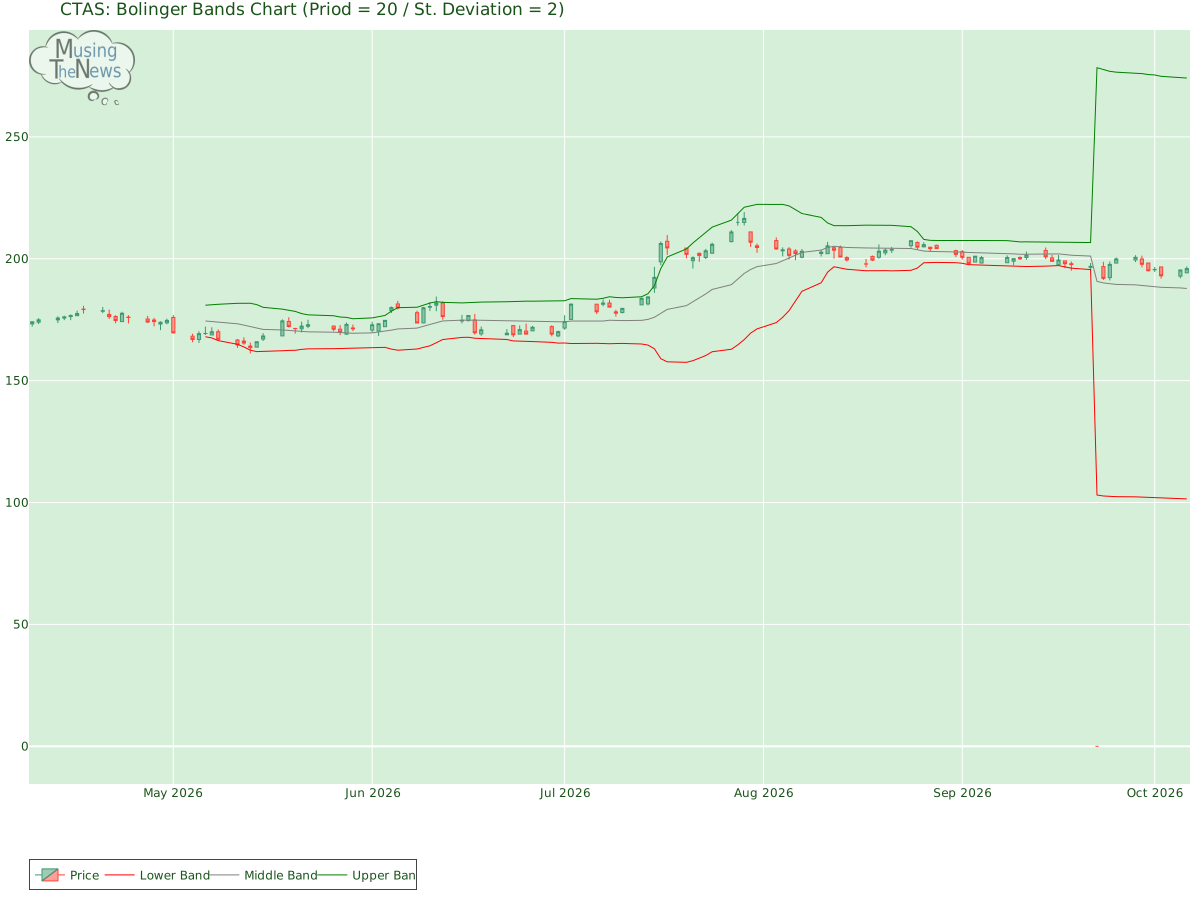
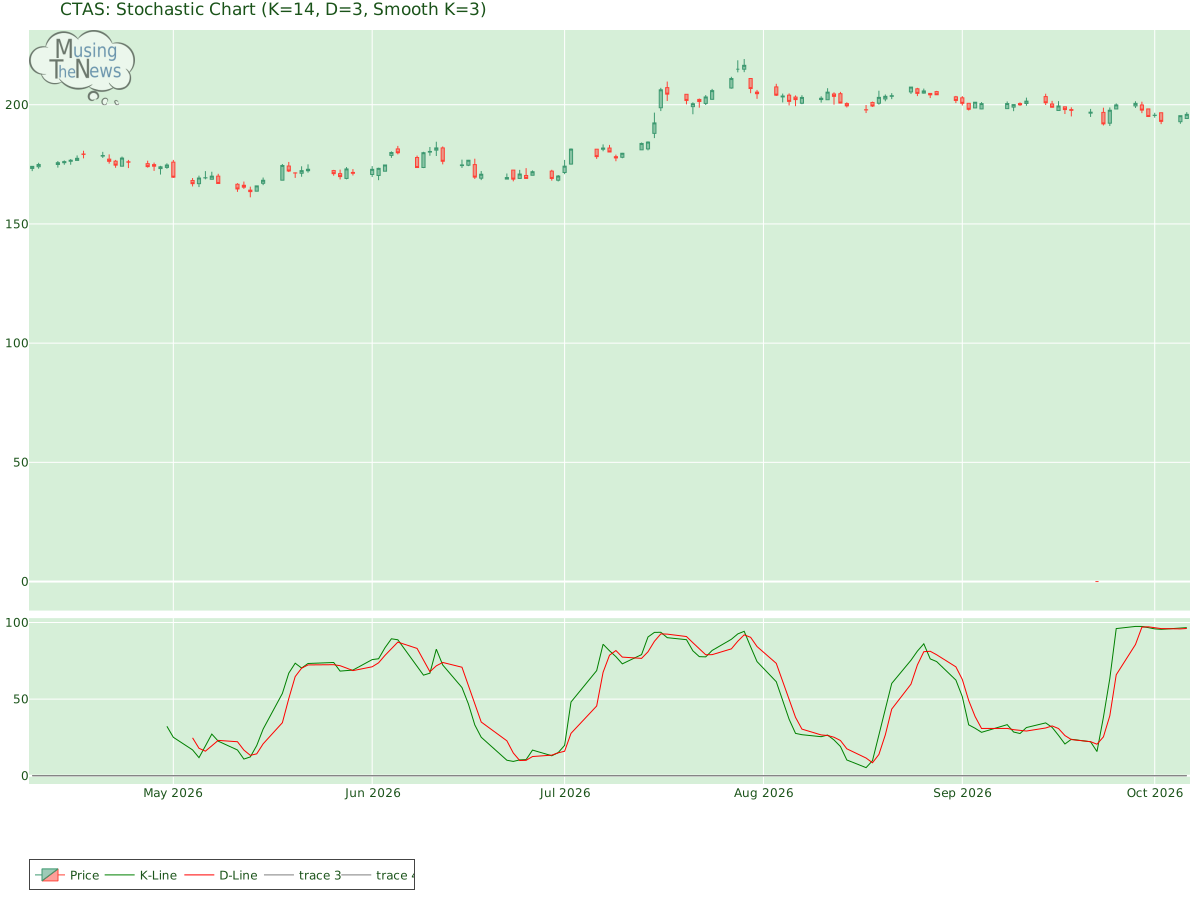
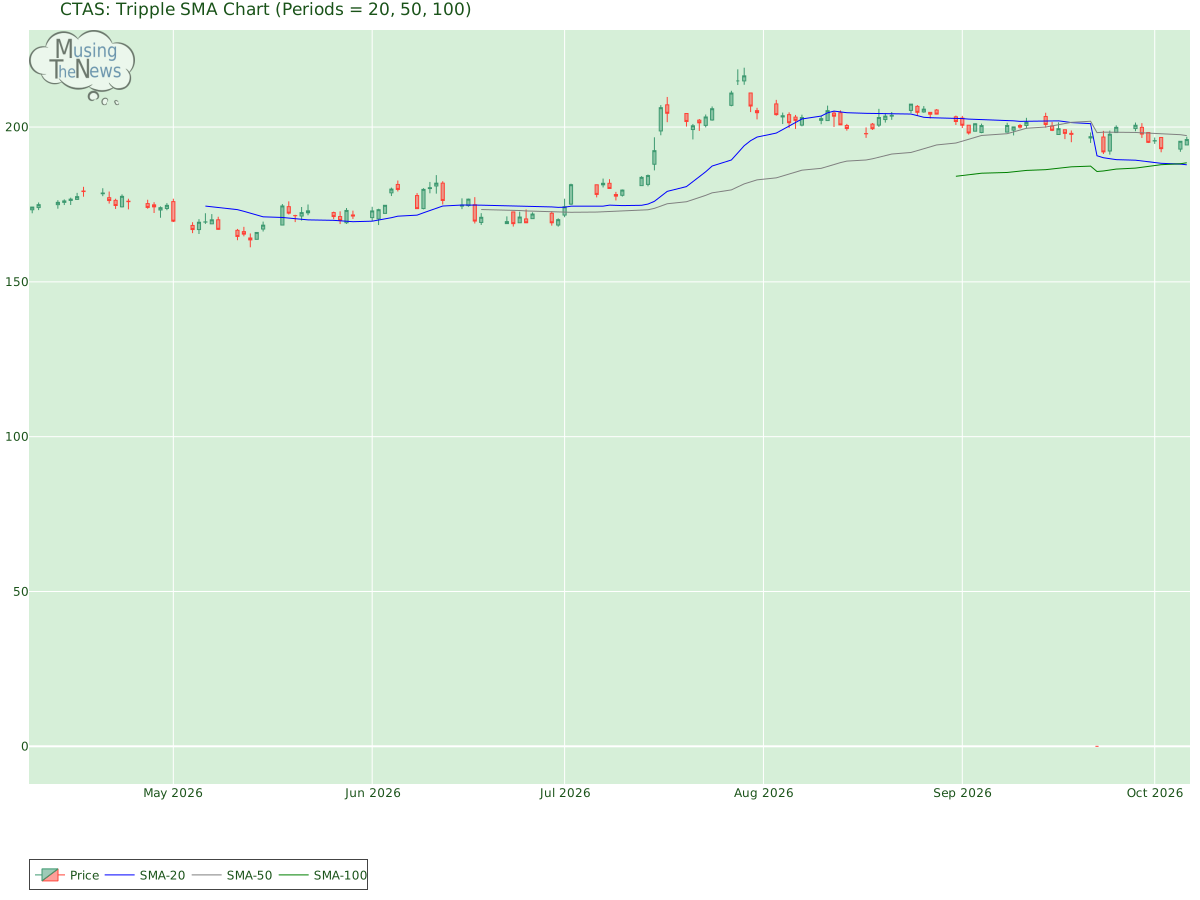
Support and Resistance: The price of 195.96 is supported at 193.02 and capped by resistance at 200.41. These levels mark key points for Cintas Corporation where the price could find stability, with 193.02 as a floor and 200.41 as a ceiling.Support/Resistance for CTASAroon: The AROON is showing a neutral stance, not indicating a clear upward or downward trend for Cintas Corporation. This suggests a period of market balance, where neither side is showing dominance.Aroon chart for Cintas CorporationBol. Bands: The BOLL BANDS is in a neutral stance for CTAS, not indicating a clear upward or downward trend. This suggests a period of market indecision, where neither bulls nor bears have the upper hand.Bolinger Bands chart for Cintas CorporationParabolic SAR: The PSAR remains bullish, establishing a key support level that could help uphold the market's upward trajectory. This persistent bullish outlook suggests that the market may continue to rise, with the support providing a foundation for further gains.Parabolic Stop and Reverse chart for Cintas CorporationStochastic: The stochastic indicator is in a bullish state, with the K-line crossing above both the D-line and the 80 mark. This alignment suggests strong upward momentum, implying that the market may continue its positive trajectory. Traders may see this as a sign of ongoing strength for Cintas Corporation.Stochastic chart for Cintas CorporationTripple Moving Agerage: The Tripple MOVING AVG is showing a neutral stance, with no definitive indication of an upward or downward trend for CTAS. This neutral position suggests a period of indecision in the market, making it difficult to predict the next move.Tripple SMA chart for Cintas Corporation Before focusing on technical indicators like stock price and volume, it's important to consider a company's fundamentals. These include financial metrics such as profitability, revenue growth, and debt levels. Furthermore, understanding the industry landscape, including competition and consumer trends, provides essential context. By combining this fundamental analysis with technical data, investors can make more informed decisions and draw deeper conclusions about the company's potential for future growth and success.