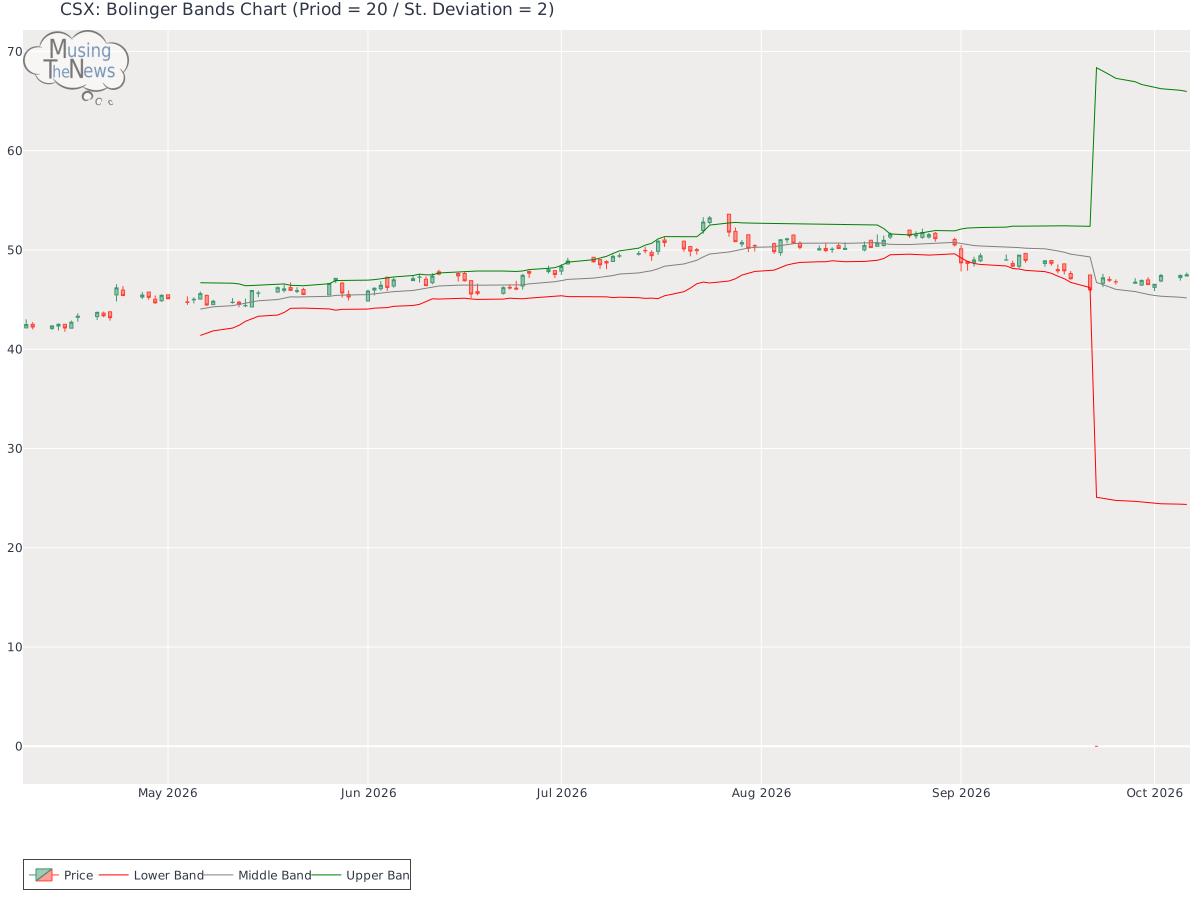
The BOLL BANDS is showing a neutral stance, not indicating a clear upward or downward trend for CSX Corporation. This suggests a period of market balance, where neither sid...
By MusingTheNews
Updated 2026-10-07 23:26:05
Overall Technical outlook
Price Summary
On 2026-10-06, CSX Corporation's stock began at 47.38, climbed to 47.73, dropped to 47.32, and had 0.25% to end at 47.5, with a volume of 8567500 shares. During the 52-week span, the stock hit a high of 53.23 and a low of 0.0.
Technicals
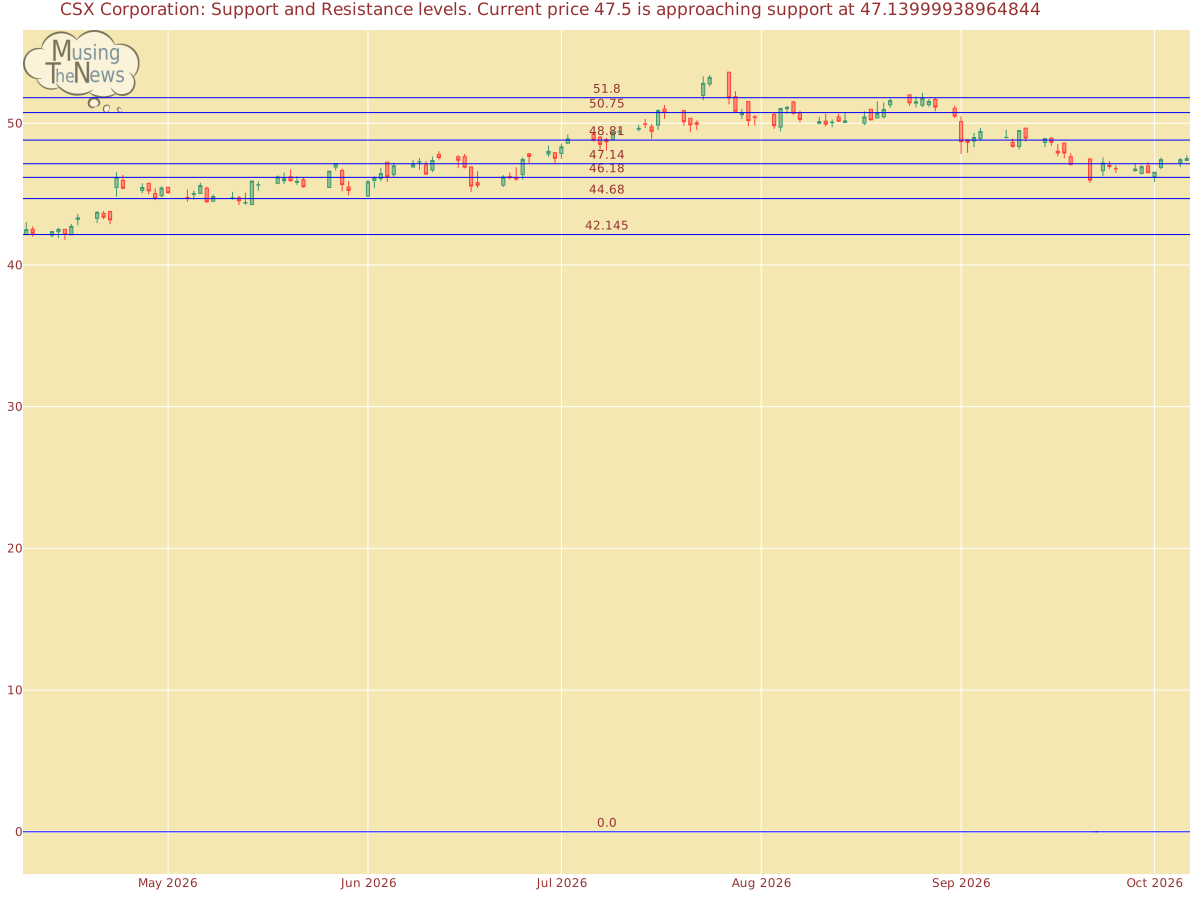
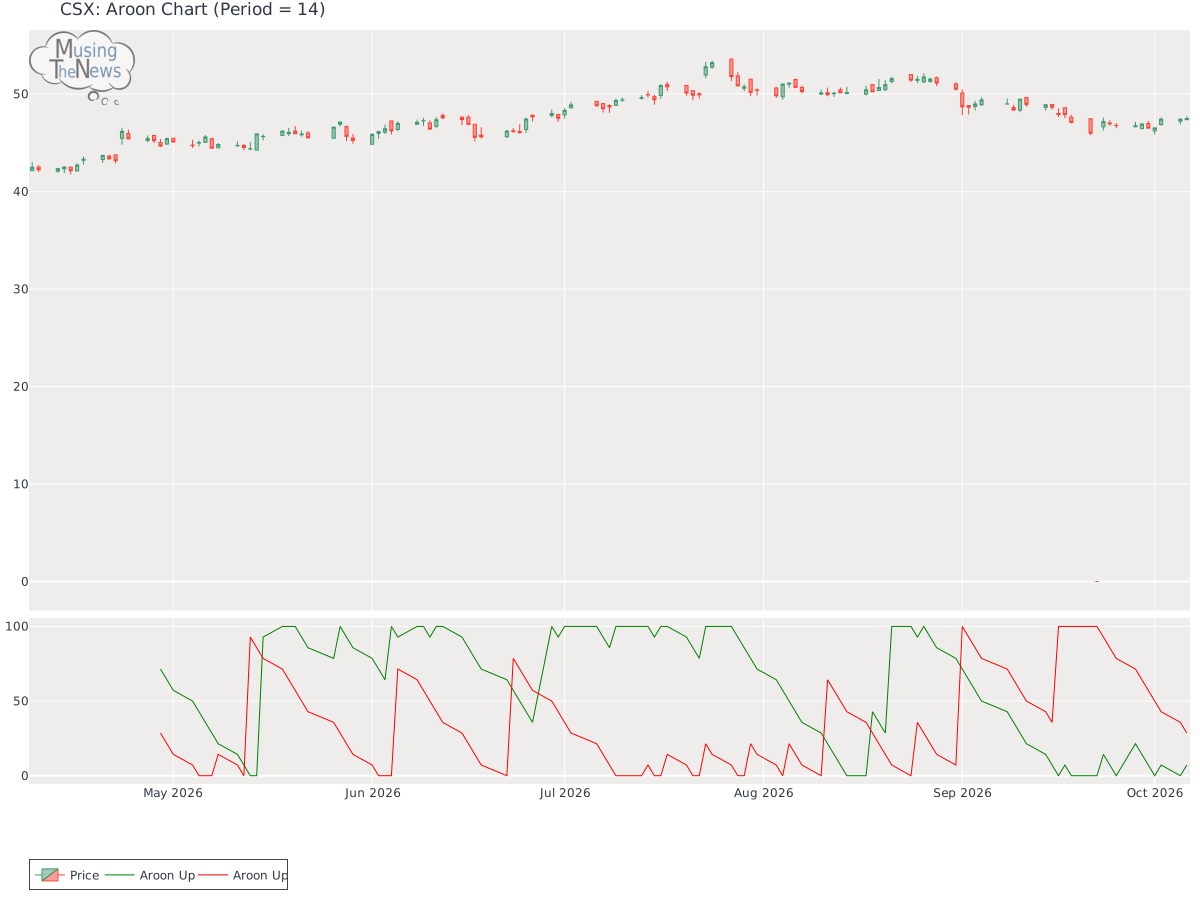
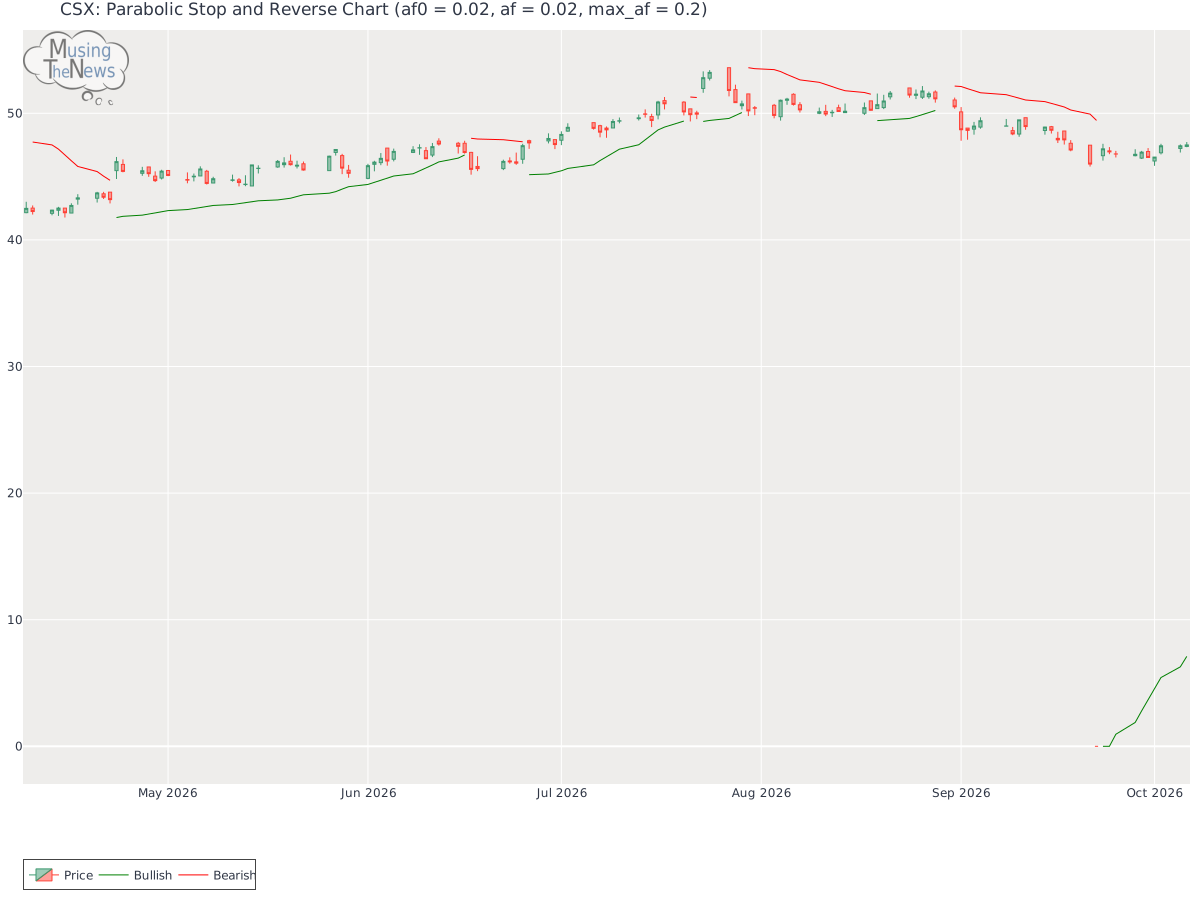
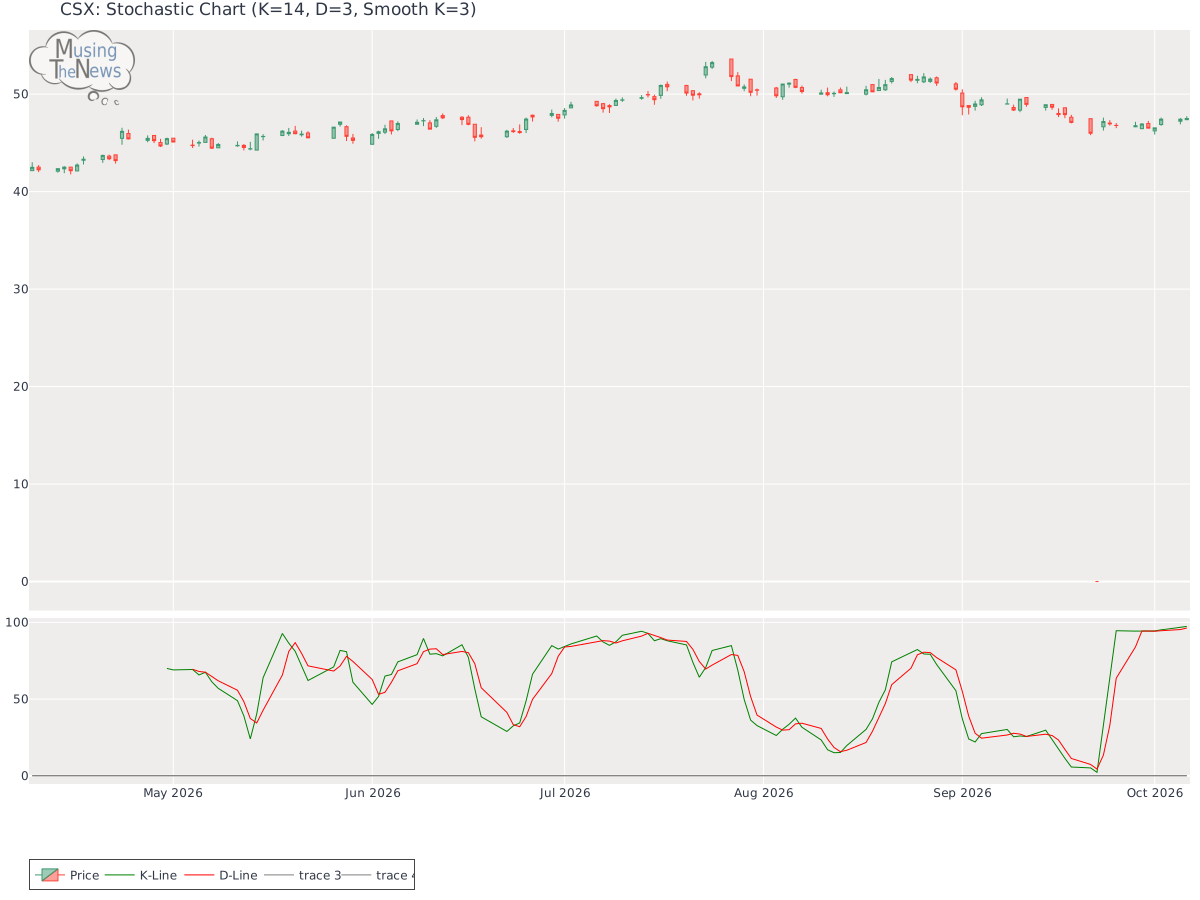
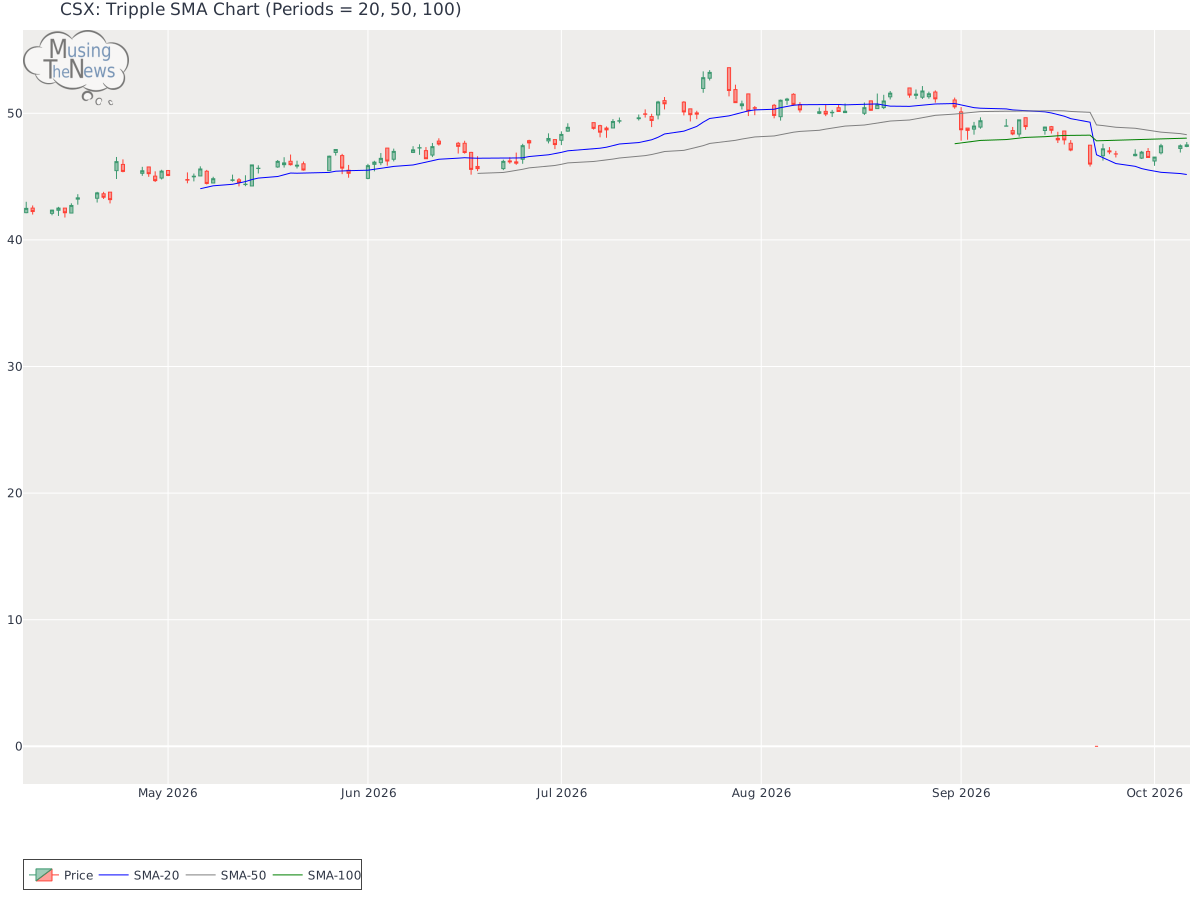
Support and Resistance: The price for CSX at 47.5 finds support at 47.14 and resistance at 48.81. This suggests a trading range, where 47.14 serves as a support level and 48.81 acts as a resistance point, potentially capping further gains.Support/Resistance for CSXAroon: The AROON is currently in a neutral position, offering no clear indication of movement up or down. This suggests that the market may be experiencing a period of equilibrium, with no strong trend in play.Aroon chart for CSX CorporationBol. Bands: The BOLL BANDS is showing a neutral stance, not indicating a clear upward or downward trend for CSX Corporation. This suggests a period of market balance, where neither side is showing dominance.Bolinger Bands chart for CSX CorporationParabolic SAR: The PSAR maintains its bullish stance, setting a significant support level that could help maintain the market's upward movement. This strong support suggests that the market is poised to continue its positive trend, providing confidence in the ongoing bullish momentum.Parabolic Stop and Reverse chart for CSX CorporationStochastic: With the K-line above both the D-line and the 80 mark, the stochastic indicator signals a bullish trend. This configuration suggests that the market is experiencing strong upward momentum, likely leading to further gains. Investors may see this as a favorable condition for potential growth.Stochastic chart for CSX CorporationTripple Moving Agerage: The Tripple MOVING AVG is in a neutral stance for CSX, not indicating a clear upward or downward trend. This suggests a period of market indecision, where neither bulls nor bears have the upper hand.Tripple SMA chart for CSX Corporation Before focusing on technical indicators like stock price and volume, it's important to consider a company's fundamentals. These include financial metrics such as profitability, revenue growth, and debt levels. Furthermore, understanding the industry landscape, including competition and consumer trends, provides essential context. By combining this fundamental analysis with technical data, investors can make more informed decisions and draw deeper conclusions about the company's potential for future growth and success.