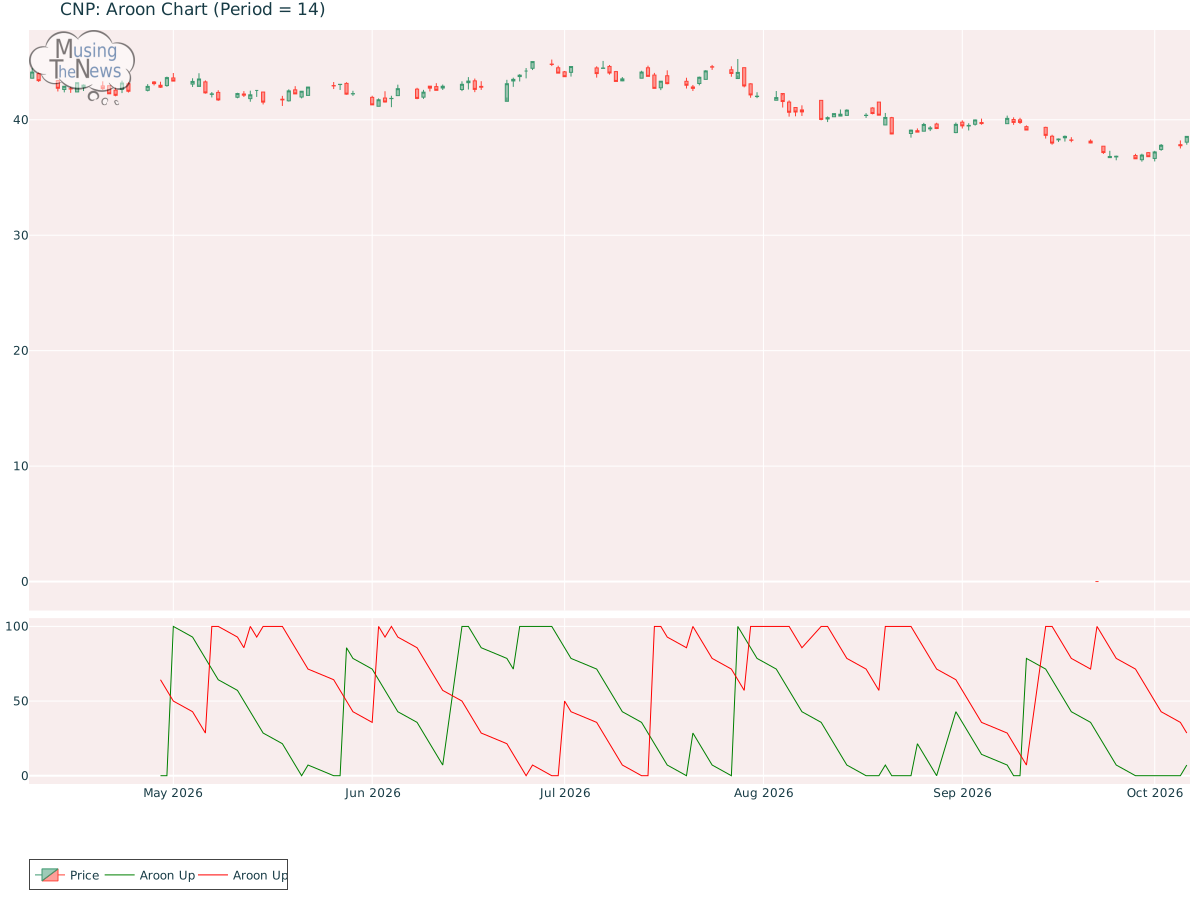
The AROON is currently neutral, offering no clear guidance on market direction. This suggests that the market may be in a state of pause, with no strong trend emerging.
By MusingTheNews
Updated 2026-10-07 23:25:57
Overall Technical outlook
Price Summary
CenterPoint Energy, Inc.'s stock, on 2026-10-06 opened at 38.06, climbed to a high of 38.58, dropped to a low of 37.84, and closed up 1.31% at 38.56, with 6480600 shares traded. The stock reached its highest price of 45.04 and lowest price of 0.0 over the last 52 weeks.
Technicals
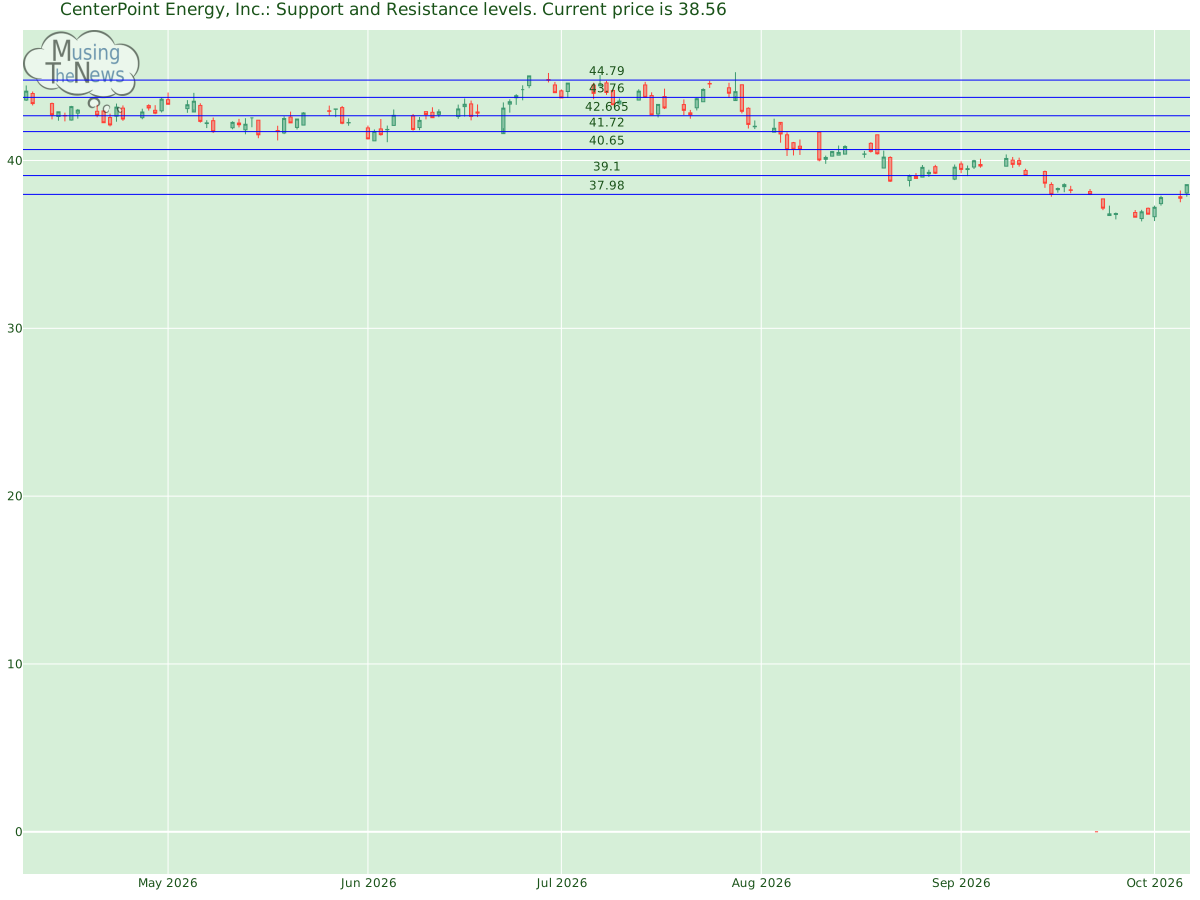
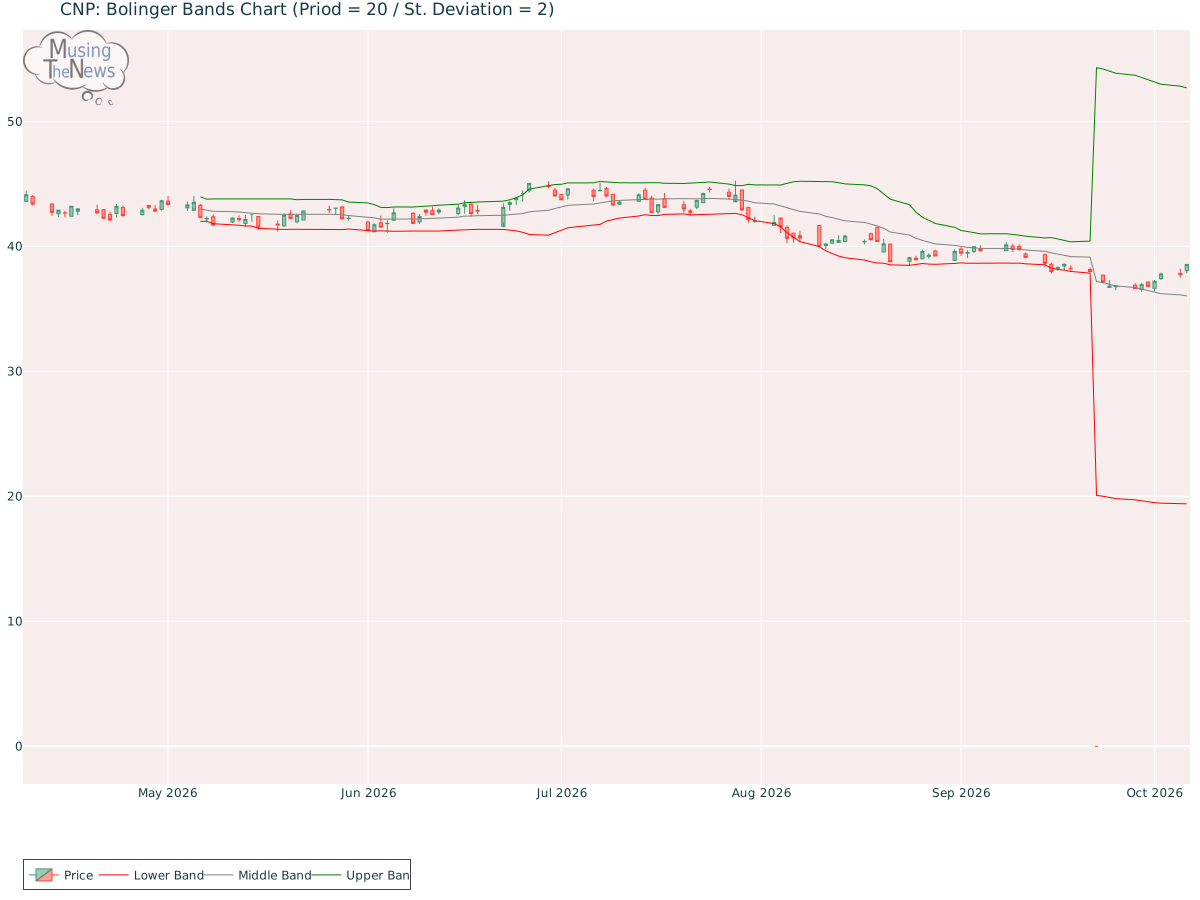
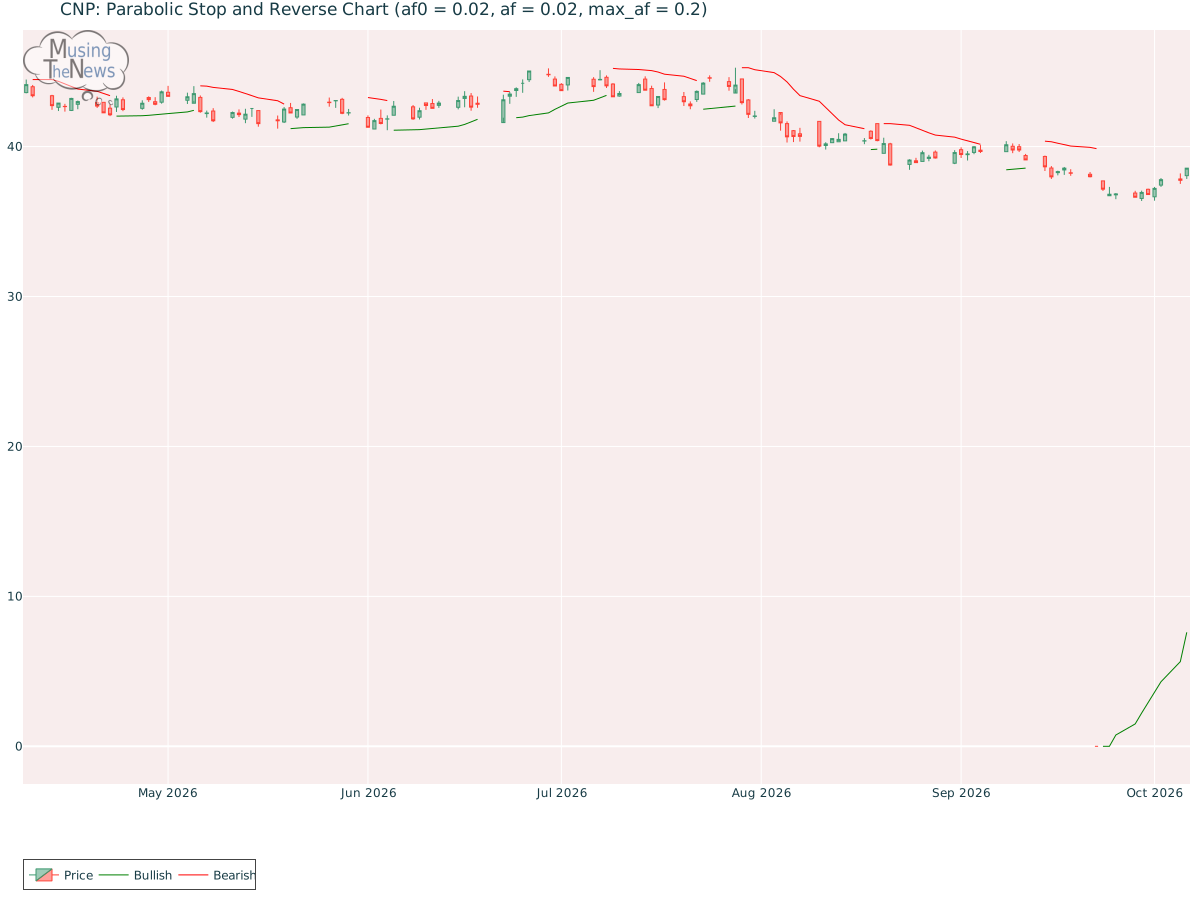
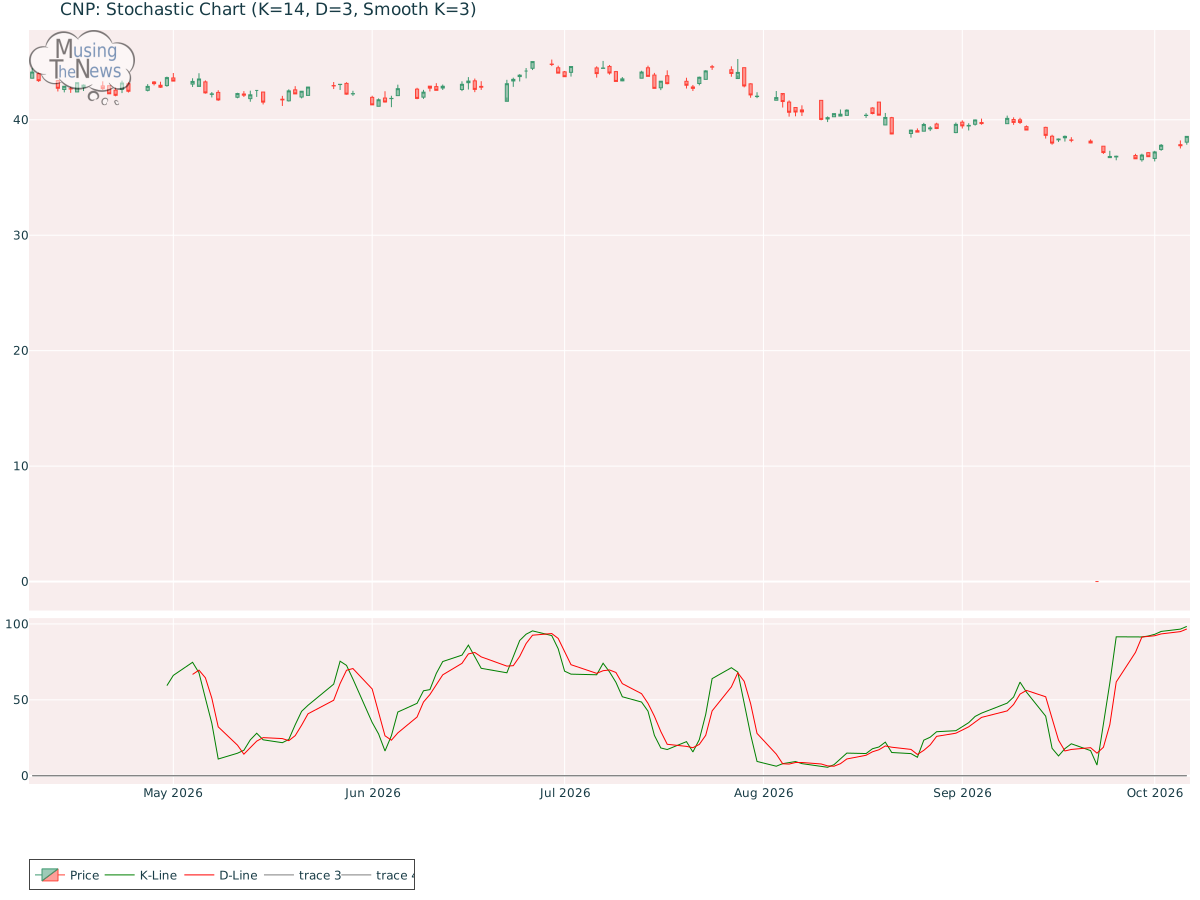
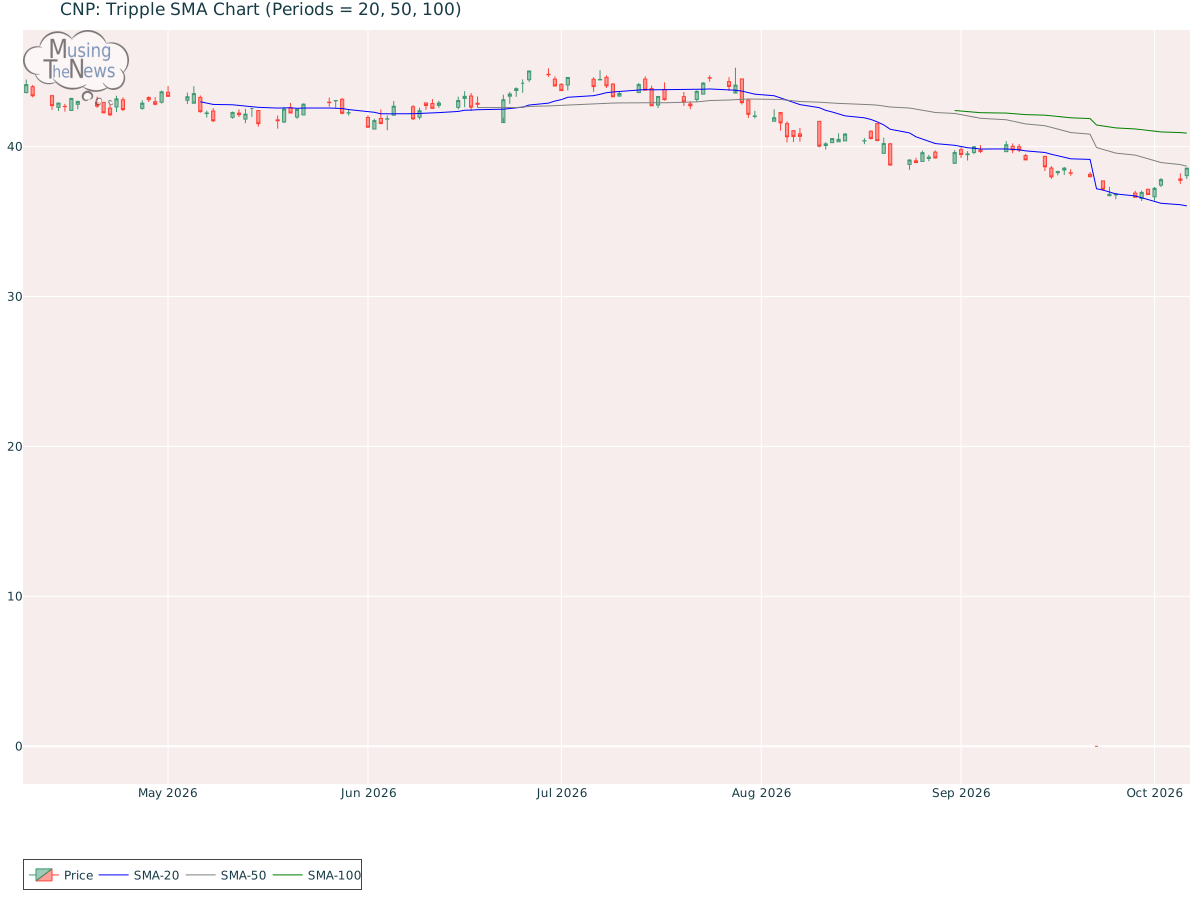
Support and Resistance: The current price for CNP is 38.56, supported at 37.98 with resistance at 39.1. This indicates a trading range where 37.98 might prevent further declines, while 39.1 could hinder additional gains.Support/Resistance for CNPAroon: The AROON is currently neutral, offering no clear guidance on market direction. This suggests that the market may be in a state of pause, with no strong trend emerging.Aroon chart for CenterPoint Energy, Inc.Bol. Bands: The BOLL BANDS is currently neutral, showing no clear bias toward a rising or falling trend. This lack of directional clarity suggests that the market may be in a holding pattern, awaiting further developments.Bolinger Bands chart for CenterPoint Energy, Inc.Parabolic SAR: The PSAR maintains its bullish stance, setting a significant support level that could help sustain the market's upward movement. This strong support suggests that CenterPoint Energy, Inc. is likely to continue trending higher, providing investors with confidence in the ongoing bullish momentum.Parabolic Stop and Reverse chart for CenterPoint Energy, Inc.Stochastic: The stochastic indicator for CenterPoint Energy, Inc. reflects a bullish sentiment, as the K-line is above both the D-line and the 80 threshold. This setup points to strong upward momentum, implying that the market may continue to rise. Traders could consider this as an indication of sustained bullish activity.Stochastic chart for CenterPoint Energy, Inc.Tripple Moving Agerage: The 20-50-100 period moving averages suggest a bullish trend, but the slopes of the faster averages indicate that this strength may be weakening. The potential for a reversal is becoming apparent, as the shorter-term averages show signs of fading momentum, suggesting that a trend change could be imminent.Tripple SMA chart for CenterPoint Energy, Inc. When analyzing a company, its fundamentals—such as earnings, management efficiency, and strategic initiatives—must be considered alongside technical data. The context of the industry in which the company operates also plays a key role, as market trends and competitive dynamics can significantly impact performance. By taking a comprehensive approach, combining both fundamental and technical analysis, one can gain a deeper understanding of the company's potential for growth or risk.