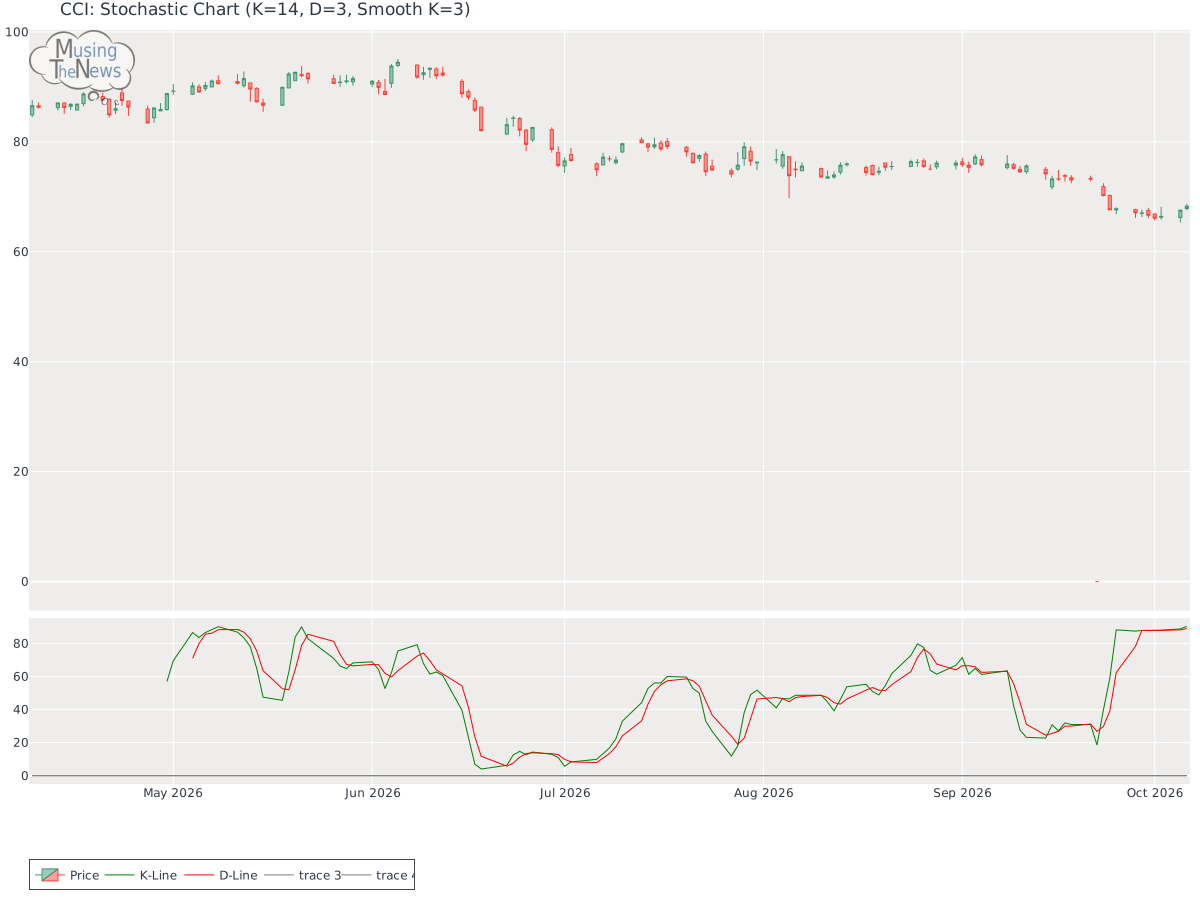
The stochastic indicator shows a bullish signal, with the K-line exceeding both the D-line and the 80 mark. This setup suggests strong upward momentum, implying that the ma...
By MusingTheNews
Updated 2026-10-07 23:26:05
Overall Technical outlook
Price Summary
Crown Castle Inc.'s stock opened at 67.87 on 2026-10-06, surged to a high of 68.7, hit a low of 67.54, and closed up 0.6% at 68.28, with 2757700 shares traded. The stock's peak price over the last 52 weeks is 98.87, with the lowest being 0.0.
Technicals
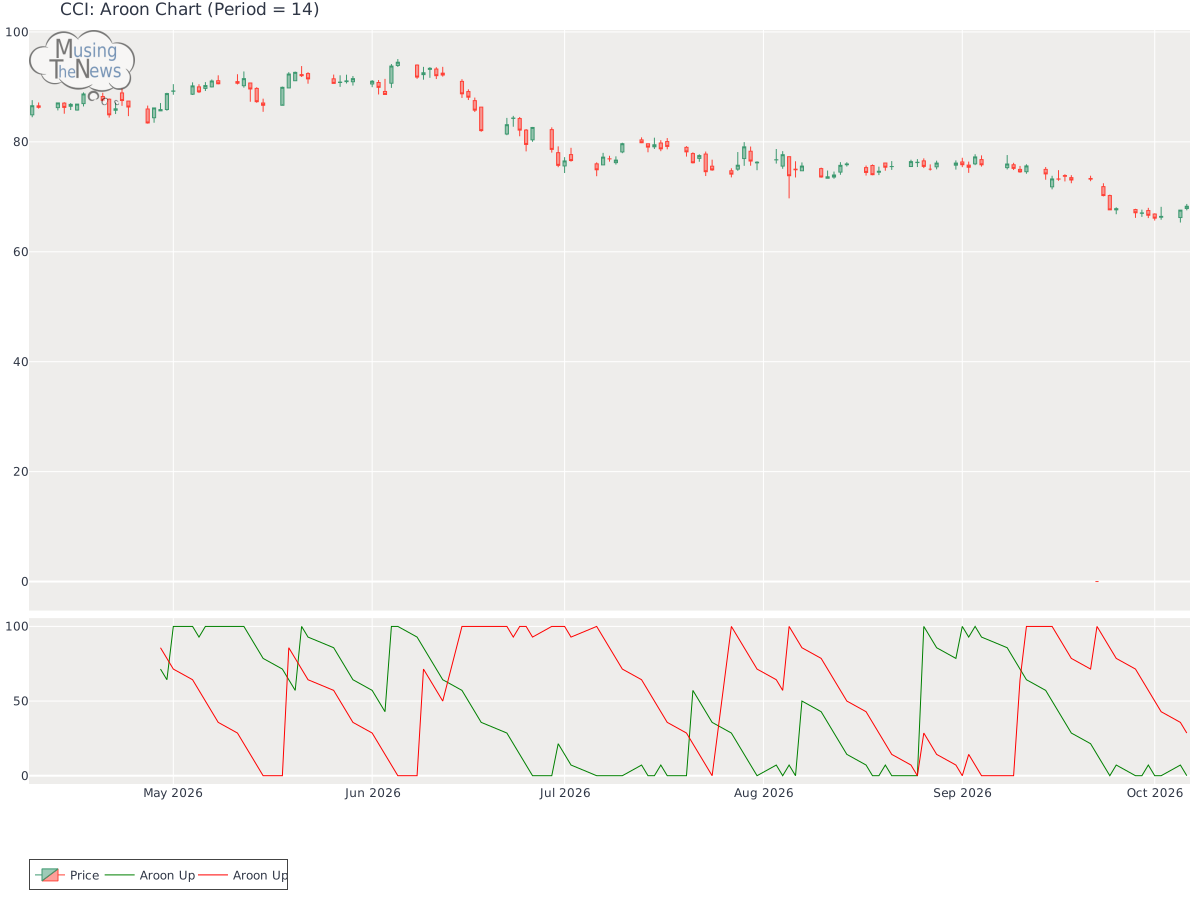
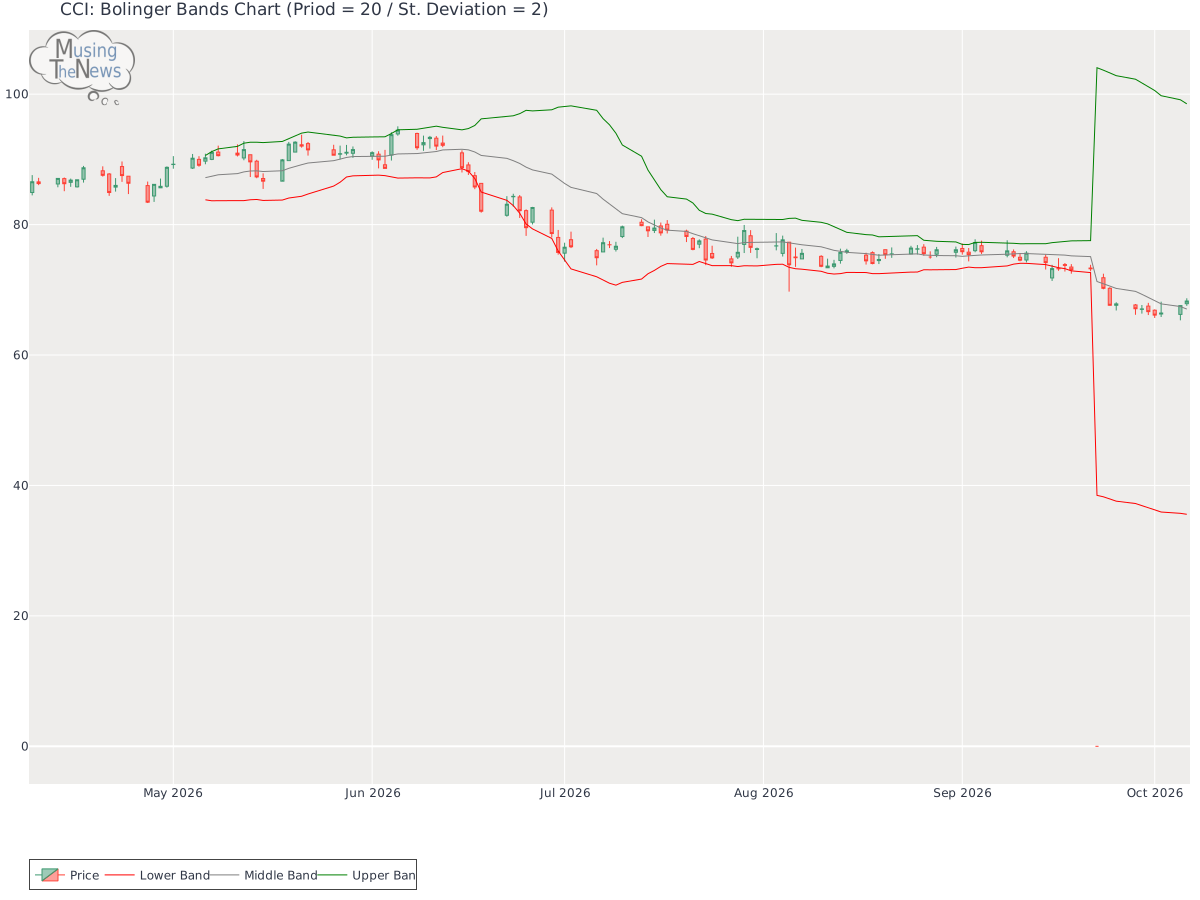
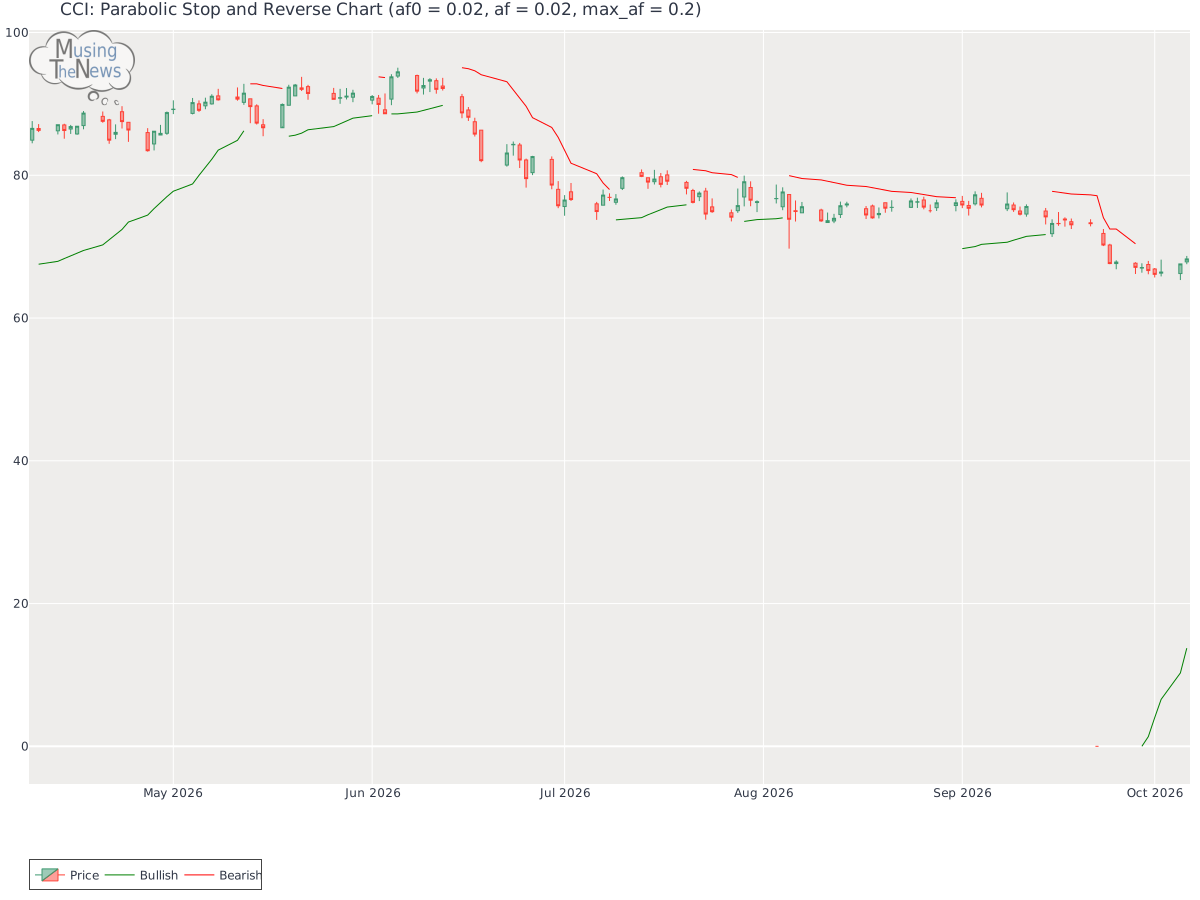
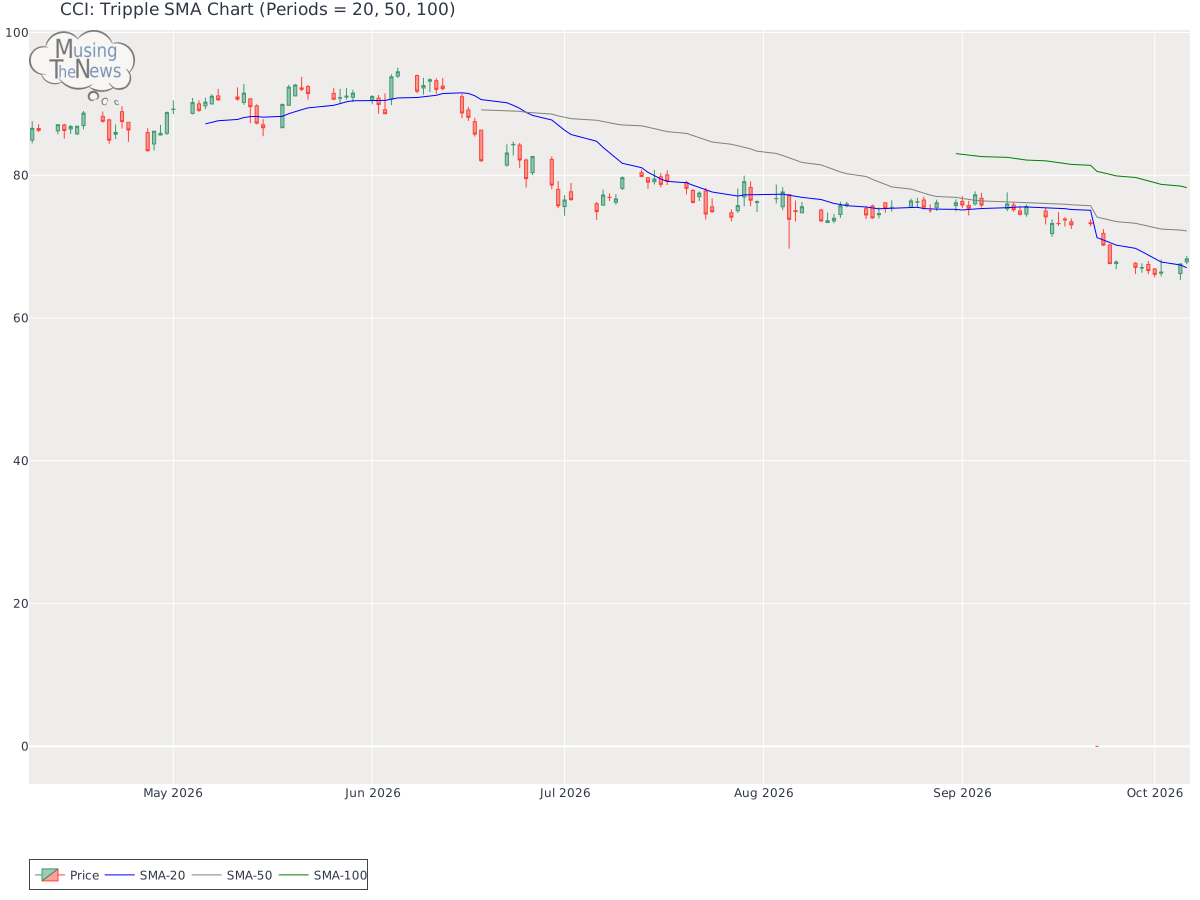
Aroon: The AROON is currently in a neutral position, offering no clear indication of movement up or down. This suggests that the market may be experiencing a period of equilibrium, with no strong trend in play.Aroon chart for Crown Castle Inc.Bol. Bands: The BOLL BANDS is currently neutral, offering no clear guidance on market direction. This suggests that the market may be in a state of pause, with no strong trend emerging.Bolinger Bands chart for Crown Castle Inc.Parabolic SAR: The PSAR continues to signal a bullish outlook, establishing a key support level that reinforces the market's upward momentum. This support could serve as a base for continued gains, suggesting that the bullish trend is likely to persist.Parabolic Stop and Reverse chart for Crown Castle Inc.Stochastic: The stochastic indicator shows a bullish signal, with the K-line exceeding both the D-line and the 80 mark. This setup suggests strong upward momentum, implying that the market may continue to rise. Investors could consider this a favorable sign for continued market growth for Crown Castle Inc..Stochastic chart for Crown Castle Inc.Tripple Moving Agerage: The alignment of the 20-50-100 period moving averages points to a bullish trend, though the slopes of the faster averages suggest a potential reversal. The weakening momentum in these shorter-term averages indicates that the current trend may not be sustainable for CCI, raising the possibility of a change in direction.Tripple SMA chart for Crown Castle Inc. When evaluating a company's technical indicators like price trends and trading volume, it's important to also assess its fundamentals. Key factors include the company's profitability, growth rate, and financial stability. Furthermore, considering the industry within which the company operates provides additional context, as factors like competition and market demand can affect performance. By combining this analysis, you can make more informed judgments about the company's future prospects.