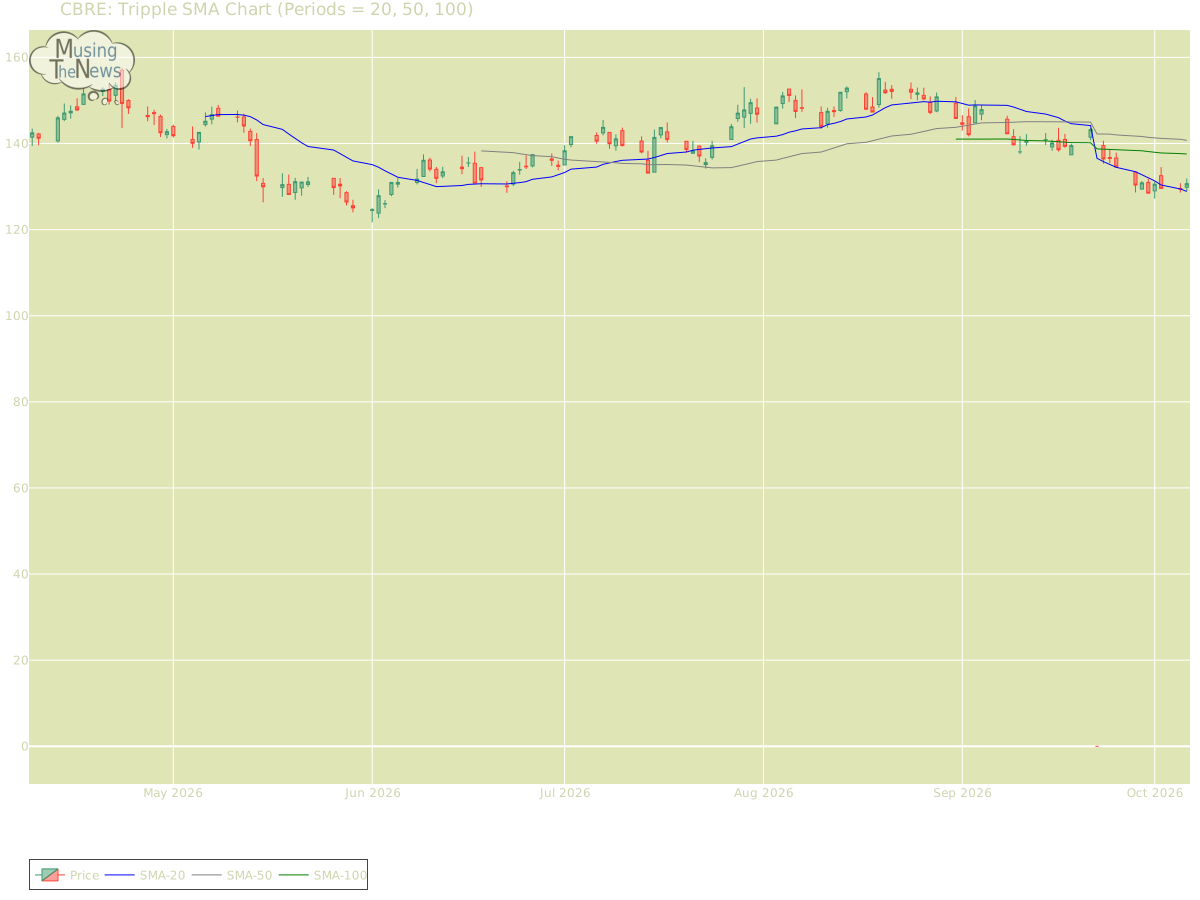
The Tripple MOVING AVG is in a neutral stance for CBRE, not indicating a clear upward or downward trend. This suggests a period of market indecision, where neither bulls no...
By MusingTheNews
Updated 2026-10-07 23:25:57
Overall Technical outlook
Price Summary
CBRE Group, Inc.'s stock started the year at 129.84, climbed to a high of 131.87, fell to 128.96, and closed 0.63% higher at 130.66, with 2656500 shares traded on 2026-10-06. For the 52-week period, the stock's highest price is 171.61, and the lowest price is 0.0.
Technicals
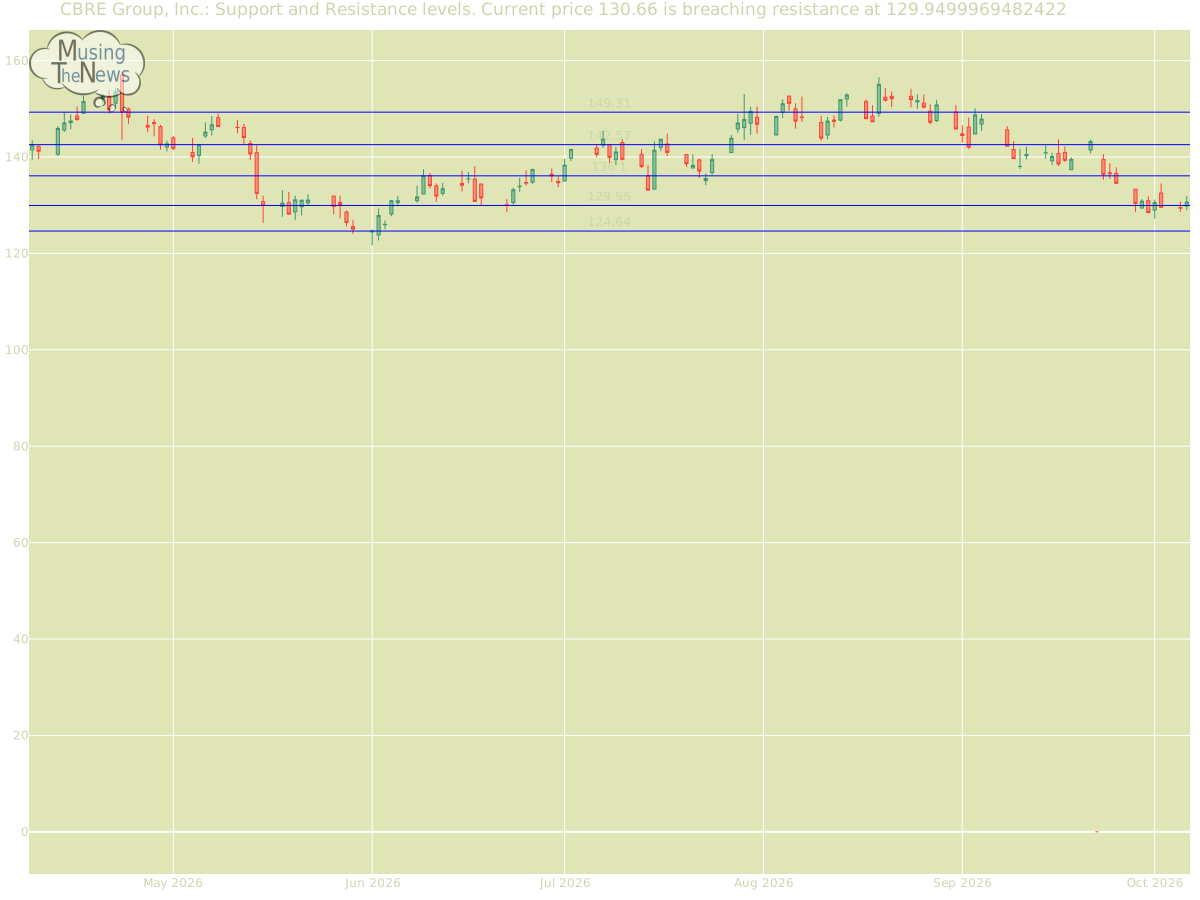
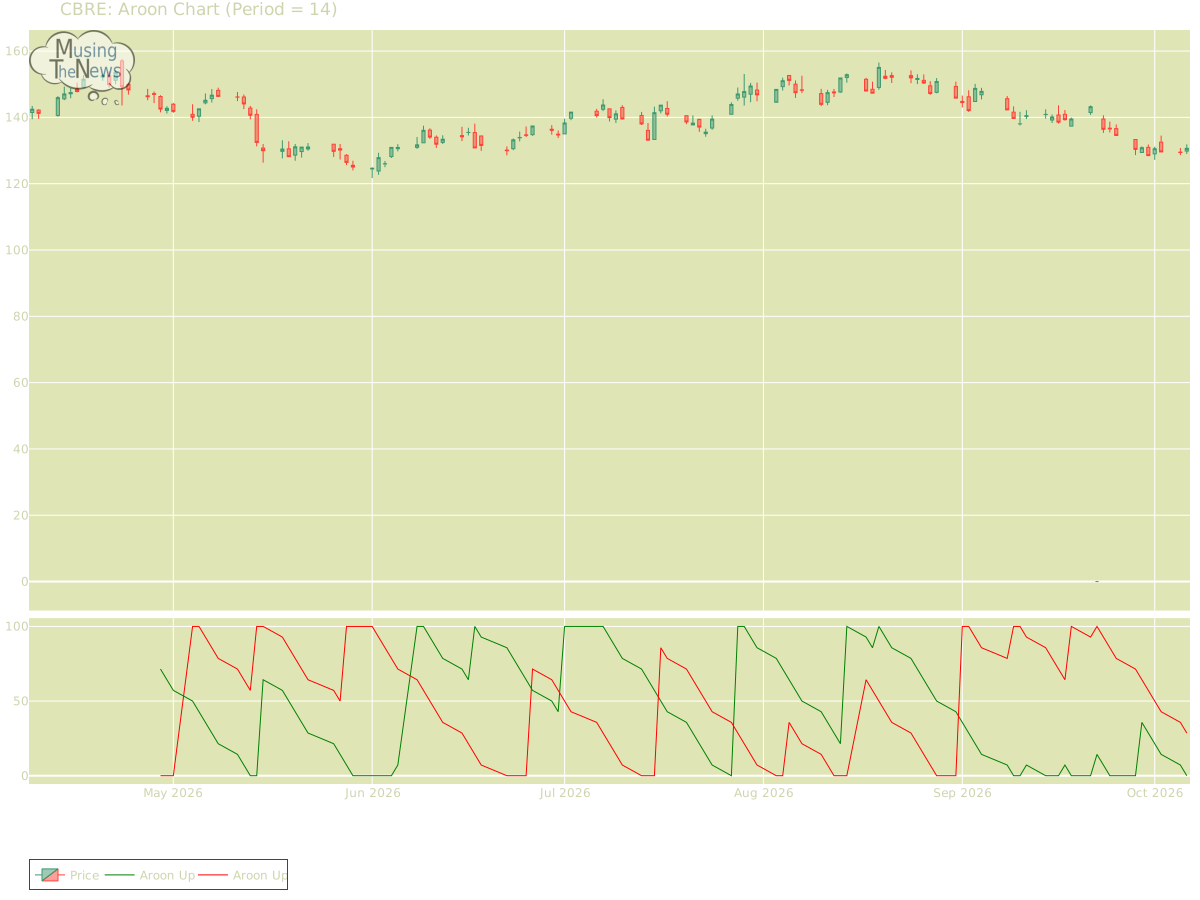
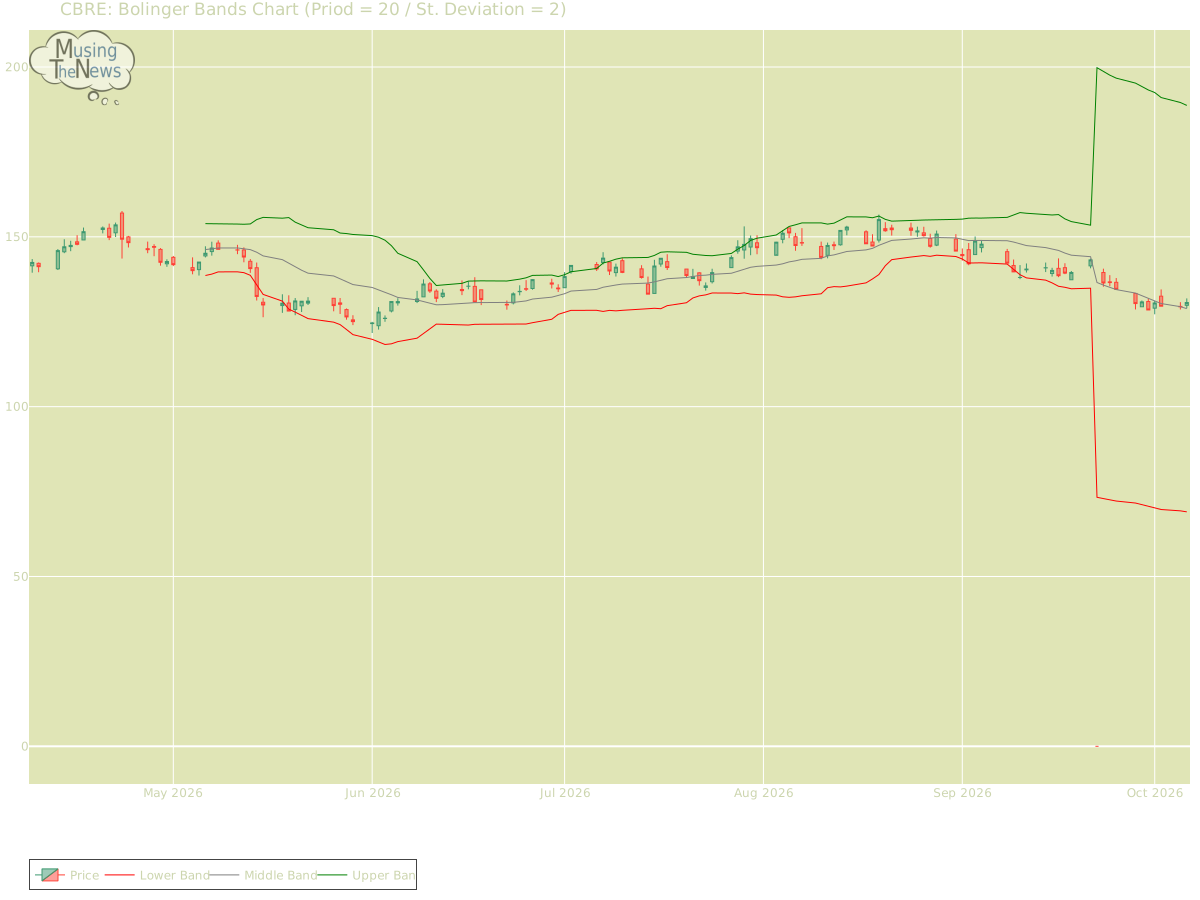
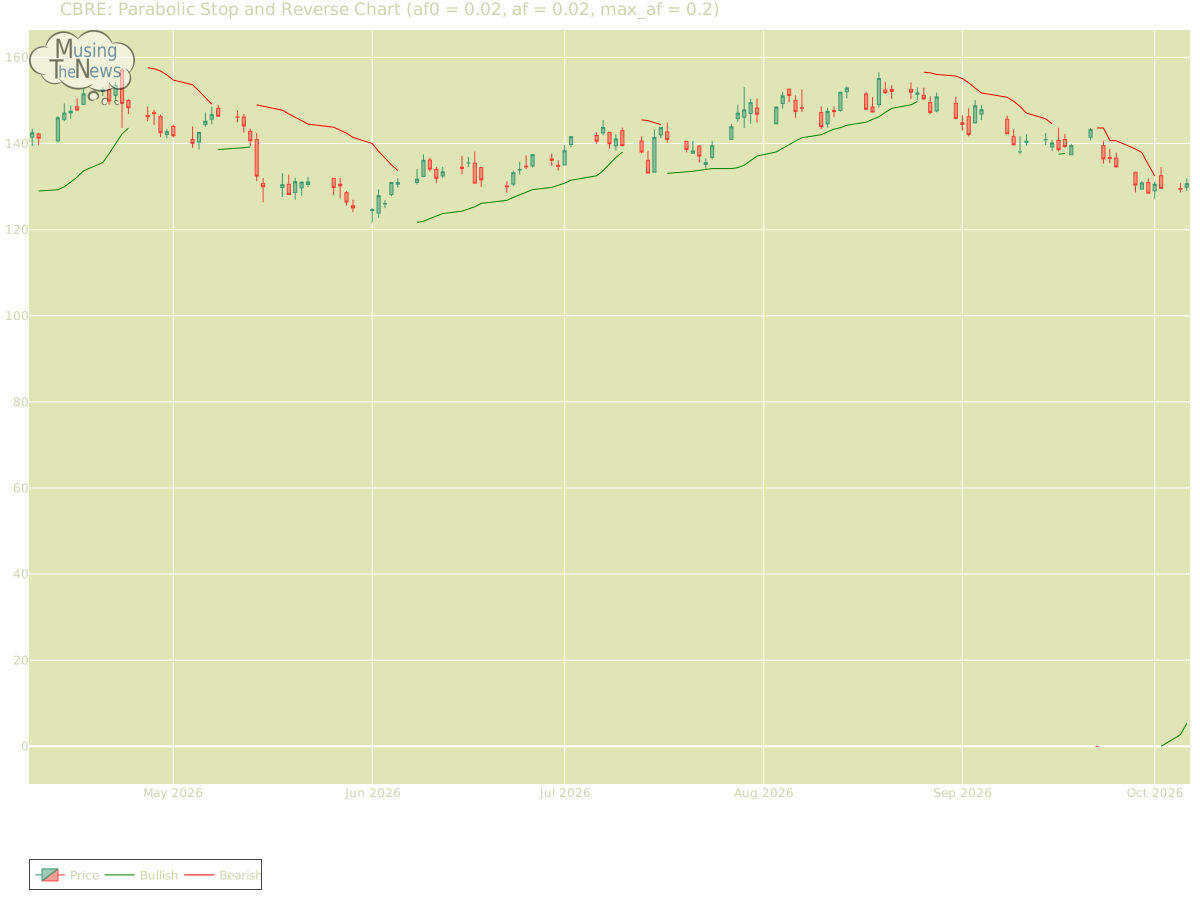
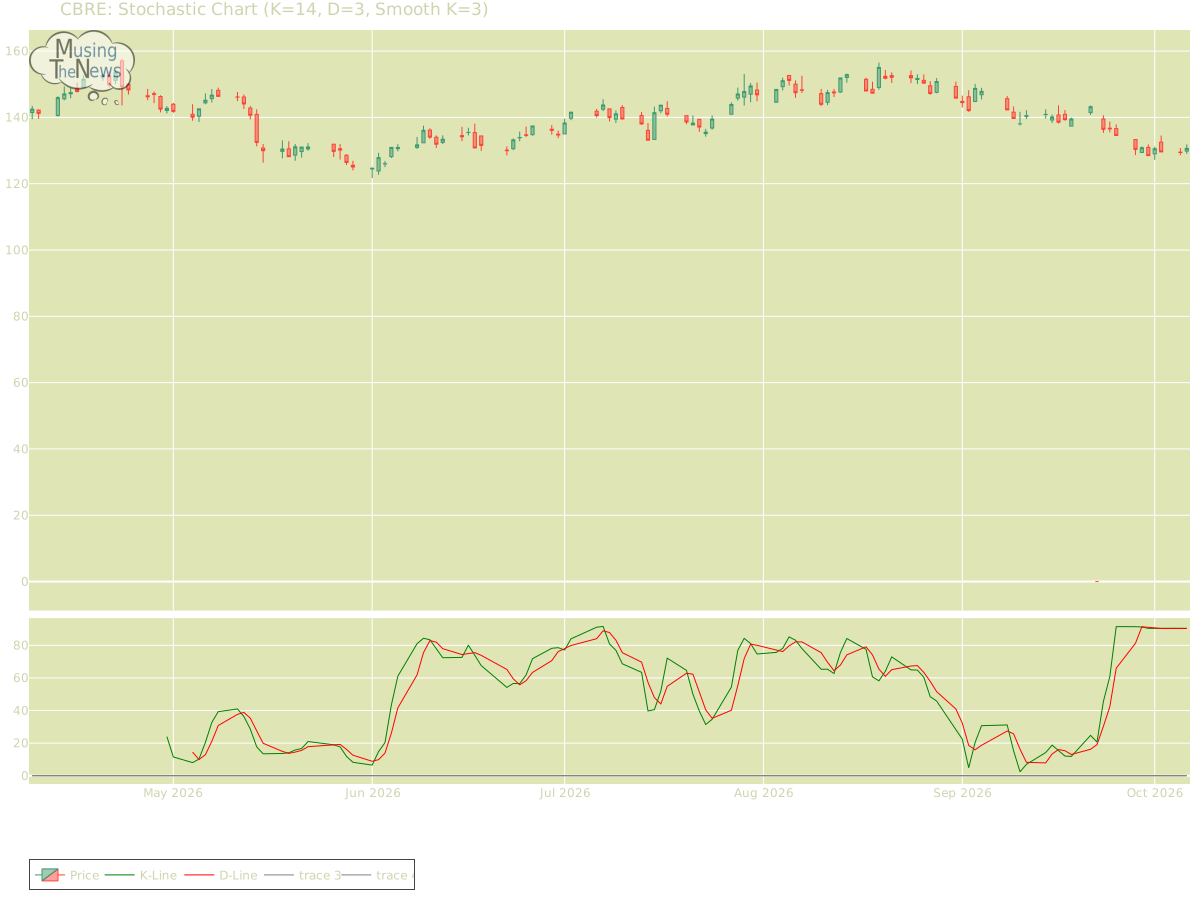
Support and Resistance: The price is currently at 130.66, supported by 129.95 and resisted by 136.1. This indicates a range where 129.95 may provide a base for the price, while 136.1 serves as a cap on further upward movement for CBRE.Support/Resistance for CBREAroon: The AROON is in a neutral stance, with no clear direction indicated for the market. This lack of clarity suggests that the market may be in a state of equilibrium for CBRE, with no strong trend emerging.Aroon chart for CBRE Group, Inc.Bol. Bands: The BOLL BANDS is in a neutral stance for CBRE, not indicating a clear upward or downward trend. This suggests a period of market indecision, where neither bulls nor bears have the upper hand.Bolinger Bands chart for CBRE Group, Inc.Parabolic SAR: The PSAR for CBRE continues to signal a bullish outlook, establishing a crucial support level that may help sustain the current upward momentum. This level of support suggests that the market is likely to continue trending higher, providing a foundation for ongoing bullish movement.Parabolic Stop and Reverse chart for CBRE Group, Inc.Stochastic: The stochastic indicator reflects bullish conditions for CBRE, with the K-line above both the D-line and the 80 level. This setup suggests strong upward momentum, implying that the market may continue to experience gains. Investors could interpret this as a sign of ongoing strength.Stochastic chart for CBRE Group, Inc.Tripple Moving Agerage: The Tripple MOVING AVG is in a neutral stance for CBRE, not indicating a clear upward or downward trend. This suggests a period of market indecision, where neither bulls nor bears have the upper hand.Tripple SMA chart for CBRE Group, Inc. When evaluating a company's technical indicators like price trends and trading volume, it's important to also assess its fundamentals. Key factors include the company's profitability, growth rate, and financial stability. Furthermore, considering the industry within which the company operates provides additional context, as factors like competition and market demand can affect performance. By combining this analysis, you can make more informed judgments about the company's future prospects.