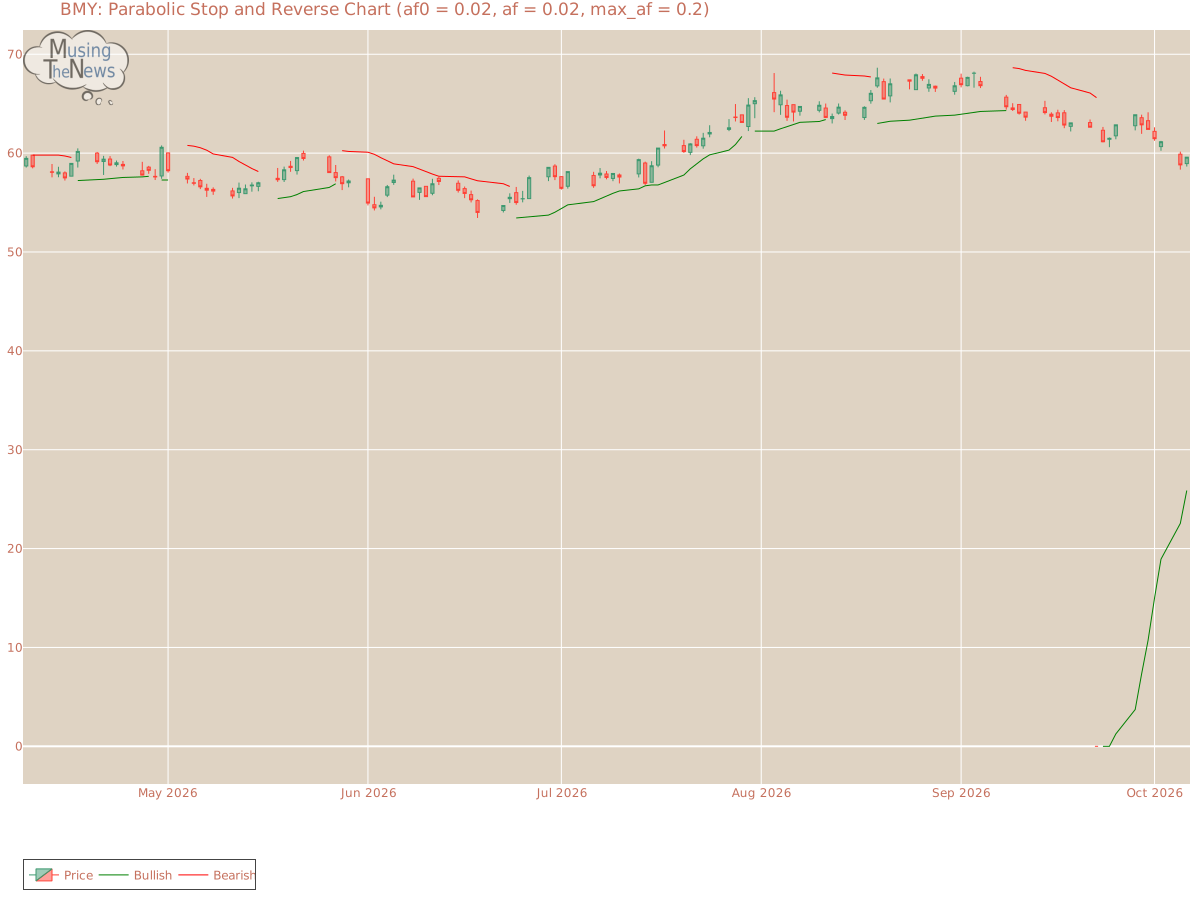
The PSAR for BMY continues to signal a bullish outlook, establishing a crucial support level that may help sustain the current upward momentum. This level of support sugges...
By MusingTheNews
Updated 2026-10-07 23:25:53
Overall Technical outlook
Price Summary
Bristol-Myers Squibb Company's stock, on 2026-10-06 opened at 58.94, climbed to a high of 59.6, dropped to a low of 58.64, and closed up 1.1% at 59.59, with 9885400 shares traded. The stock reached its highest price of 68.09 and its lowest price of 0.0 during the 52-week period.
Technicals
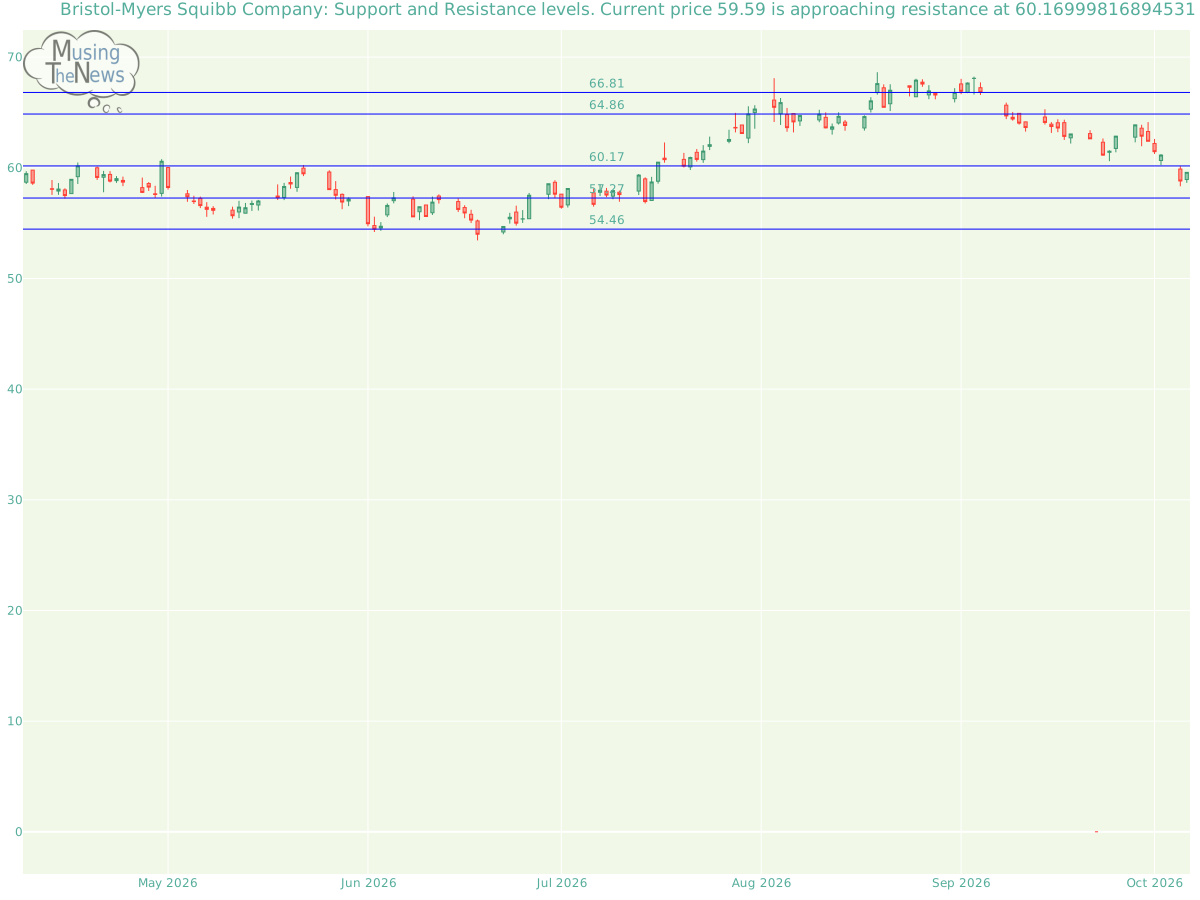
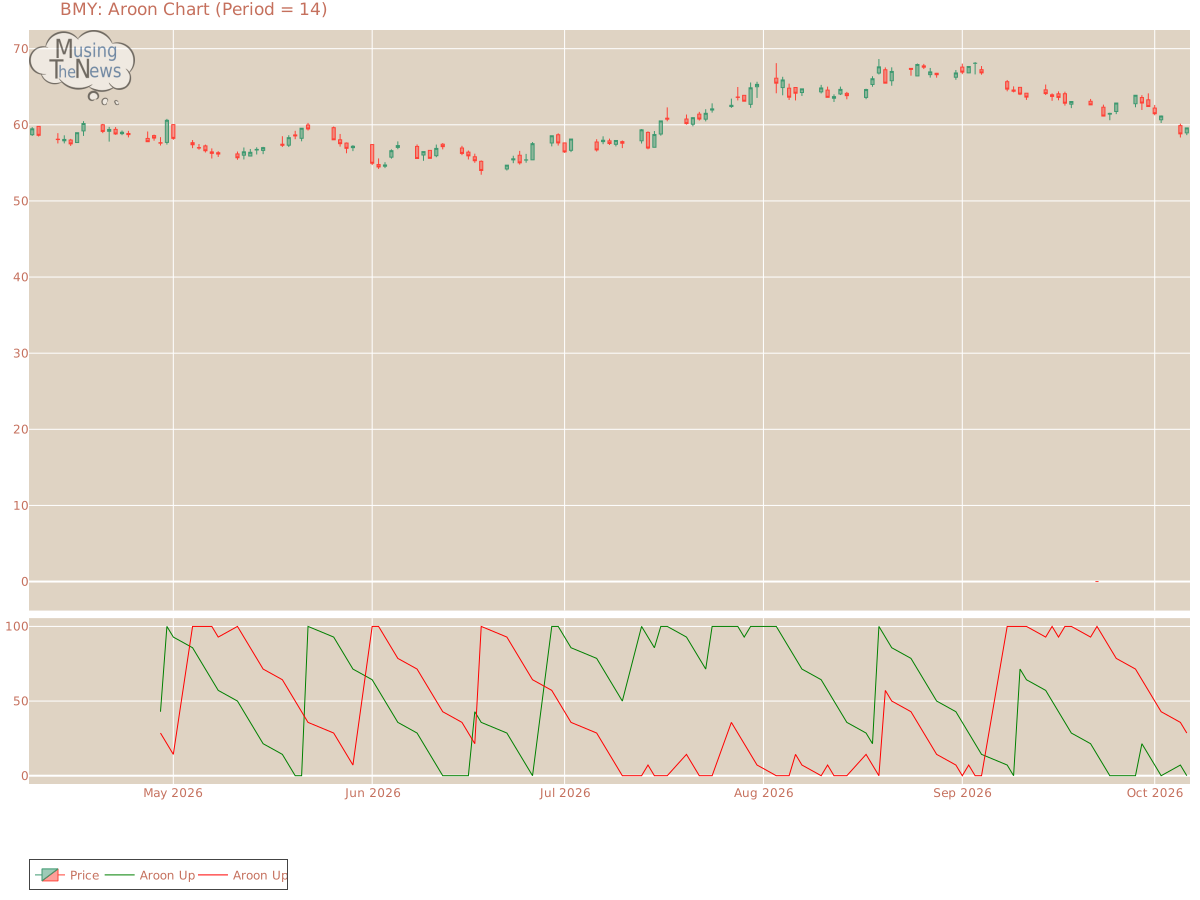
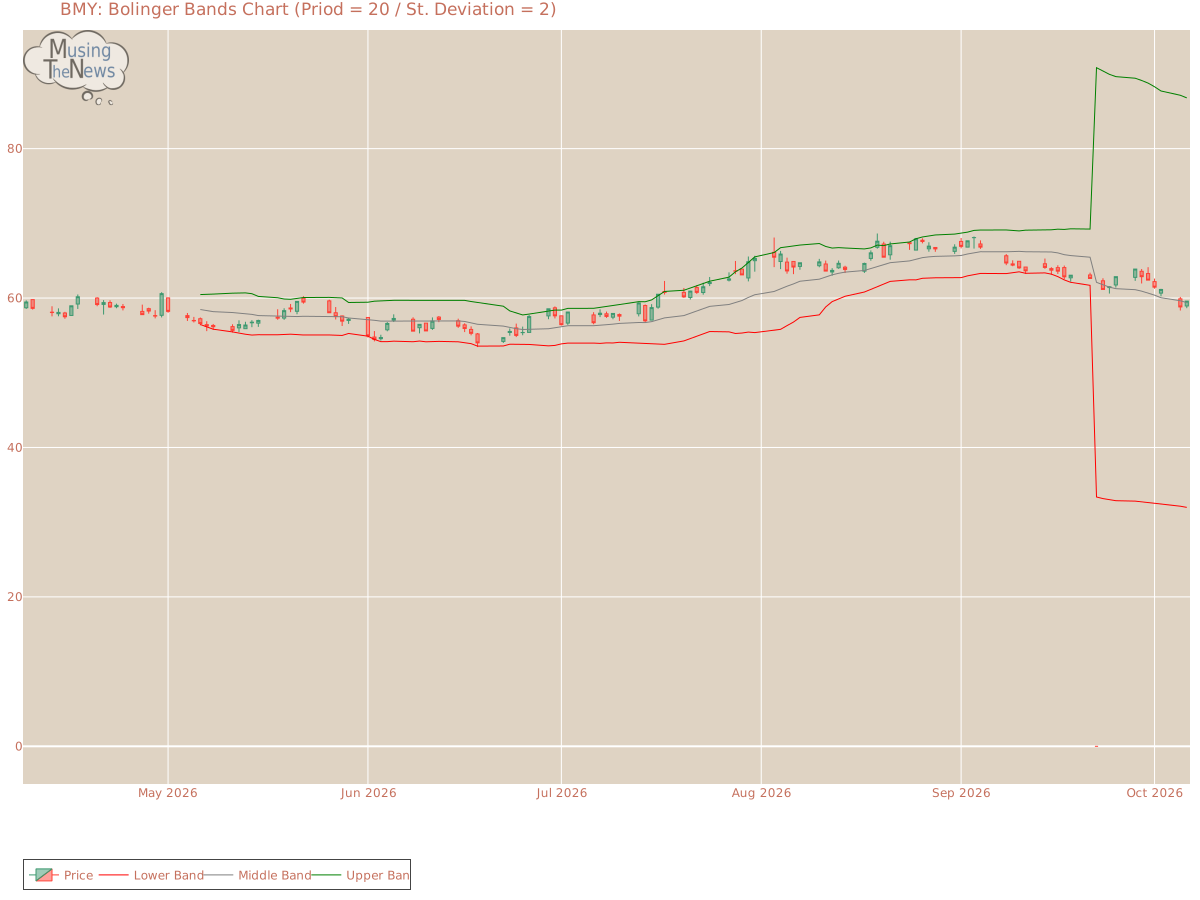
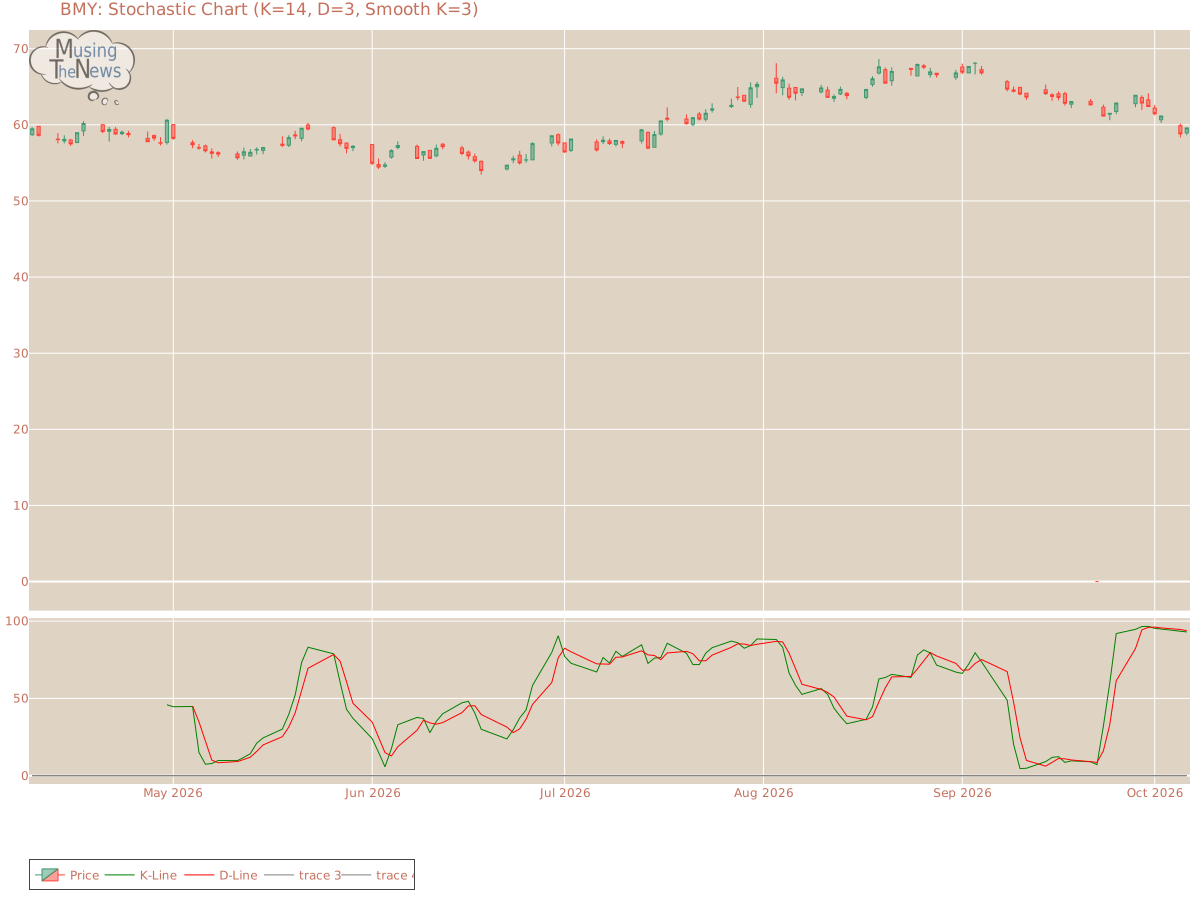
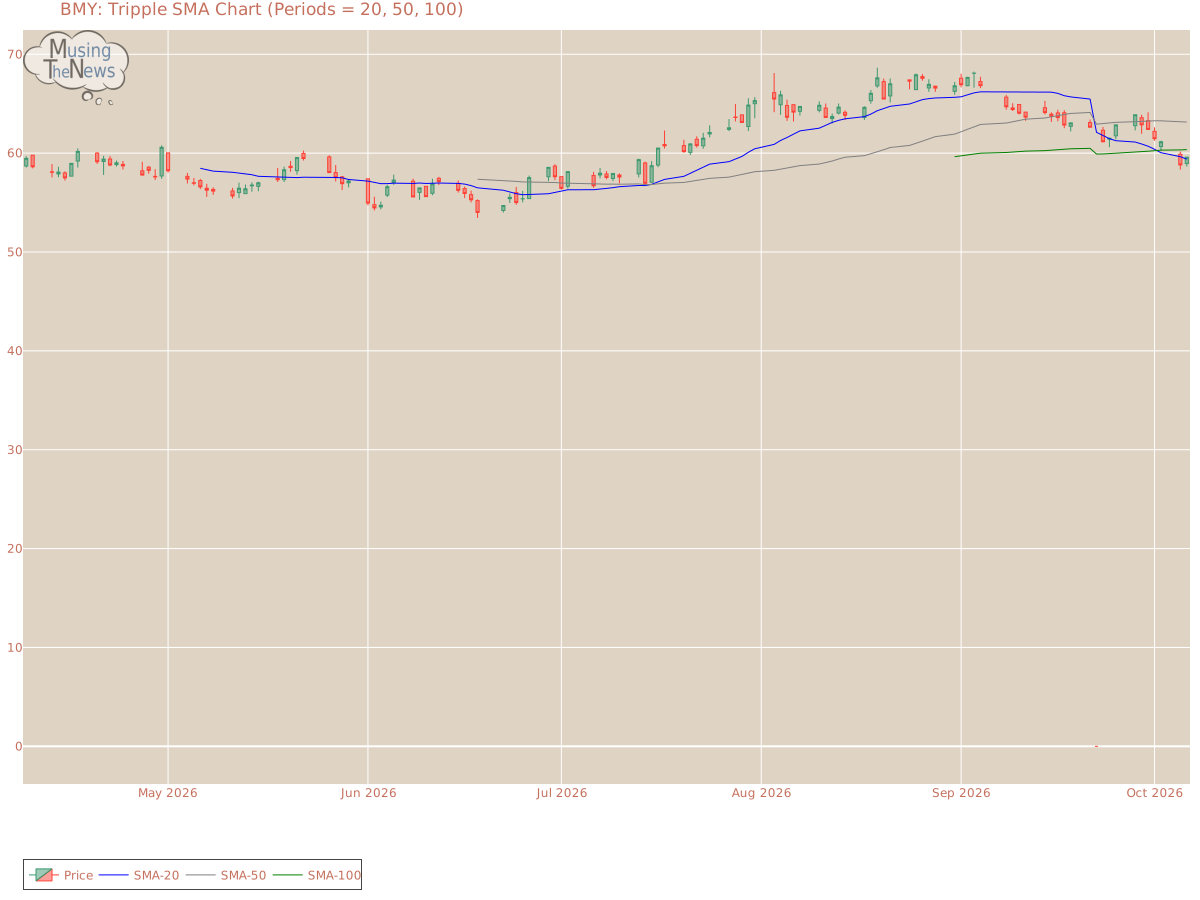
Support and Resistance: The current price is 59.59, with support at 57.27 and resistance at 60.17. This range suggests that the price might move between these levels, with 57.27 offering support and 60.17 capping further gains for Bristol-Myers Squibb Company.Support/Resistance for BMYAroon: The current state of the AROON is neutral for BMY, providing no clear indication of a trend in either direction. This suggests that the market may be lacking momentum, making it difficult to predict future movements.Aroon chart for Bristol-Myers Squibb CompanyBol. Bands: The current reading of the BOLL BANDS indicator suggests a neutral stance, with no clear signals indicating an upward or downward direction. This lack of directional bias suggests the market may be in a period of consolidation or uncertainty.Bolinger Bands chart for Bristol-Myers Squibb CompanyParabolic SAR: The PSAR for BMY continues to signal a bullish outlook, establishing a crucial support level that may help sustain the current upward momentum. This level of support suggests that the market is likely to continue trending higher, providing a foundation for ongoing bullish movement.Parabolic Stop and Reverse chart for Bristol-Myers Squibb CompanyStochastic: The stochastic indicator shows the K-line below the D-line but still above 80, suggesting the possible onset of a bearish price move. This setup hints that the market's recent gains could be reversing, potentially leading to a decline. Traders should monitor this development for further signs of weakness.Stochastic chart for Bristol-Myers Squibb CompanyTripple Moving Agerage: The Tripple MOVING AVG is showing a neutral reading, with no clear direction indicated for upward or downward movement. This neutral position suggests a possible period of consolidation.Tripple SMA chart for Bristol-Myers Squibb Company A thorough analysis of a company involves looking beyond its stock price movements and trading patterns. You must also examine its fundamentals, which include profitability, growth prospects, and competitive advantages. Additionally, the industry in which the company operates provides important context, as factors like technological innovations, regulation, and market demand influence performance. By integrating this information with technical analysis, more accurate predictions about the company's future can be made.