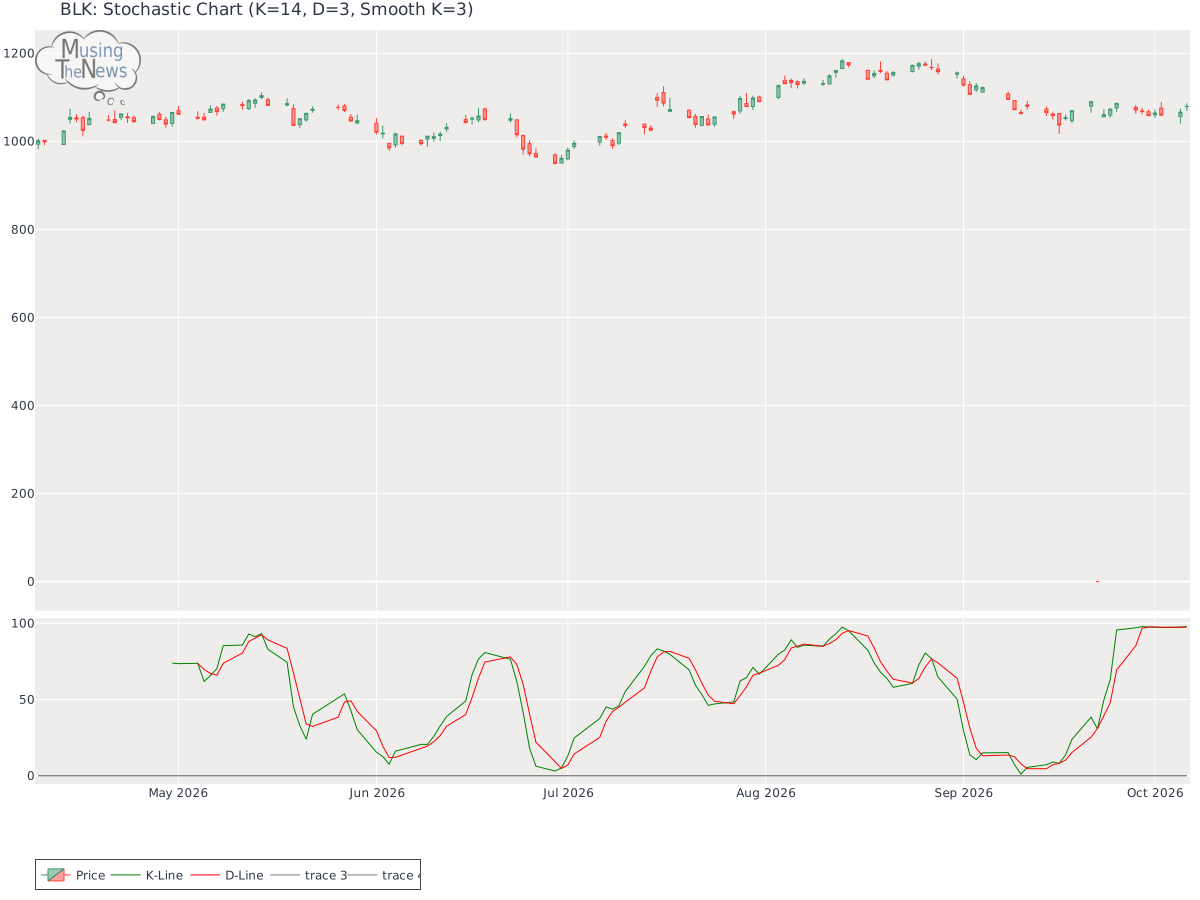
With the K-line above both the D-line and the 80 mark, the stochastic indicator signals a bullish trend. This configuration suggests that the market is experiencing strong ...
By MusingTheNews
Updated 2026-10-07 23:25:52
Overall Technical outlook
Price Summary
On 2026-10-06, BlackRock, Inc.'s stock began at 1079.01, peaked at 1086.45, declined to 1069.42, and ended the day 0.04% up at 1079.42, with 539100 shares traded. In the past year, the highest stock price was 1202.59, and the lowest was 0.0.
Technicals
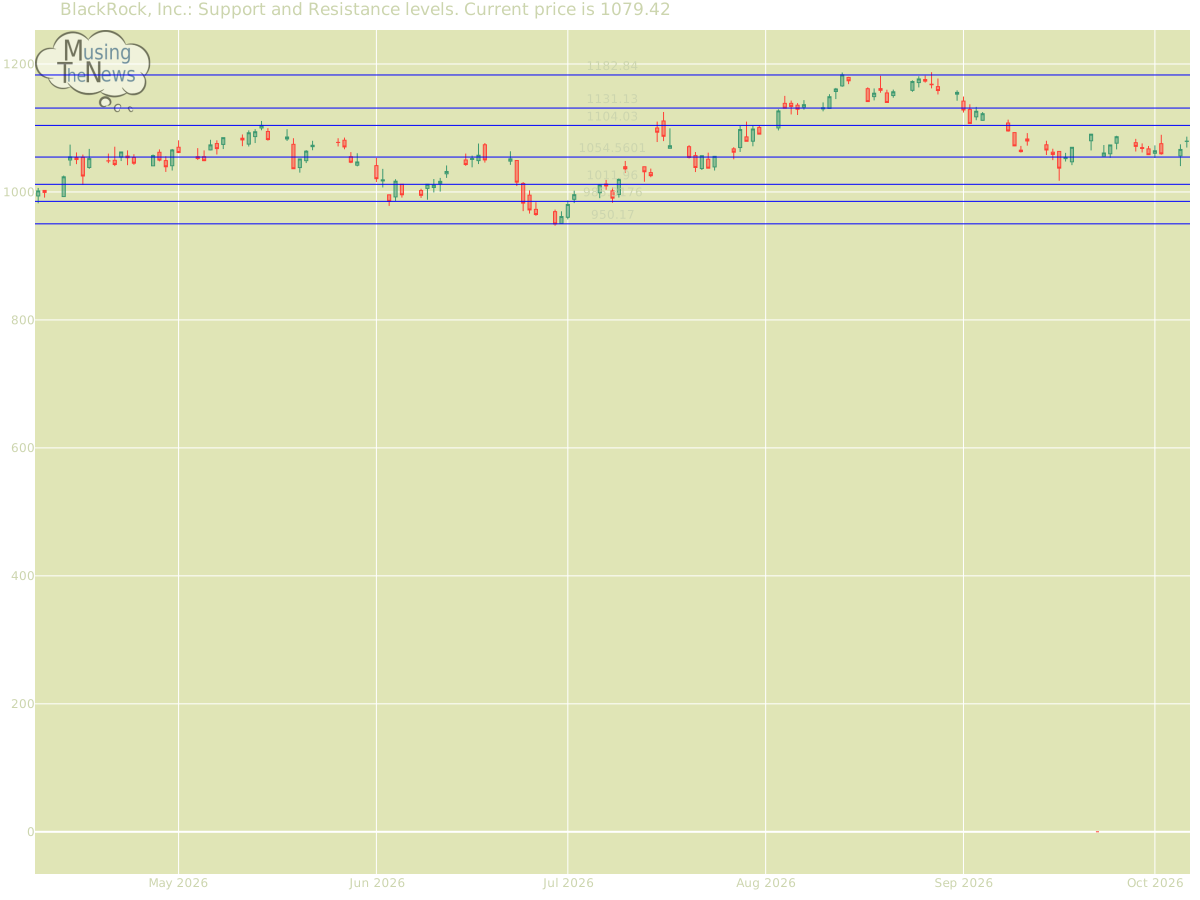
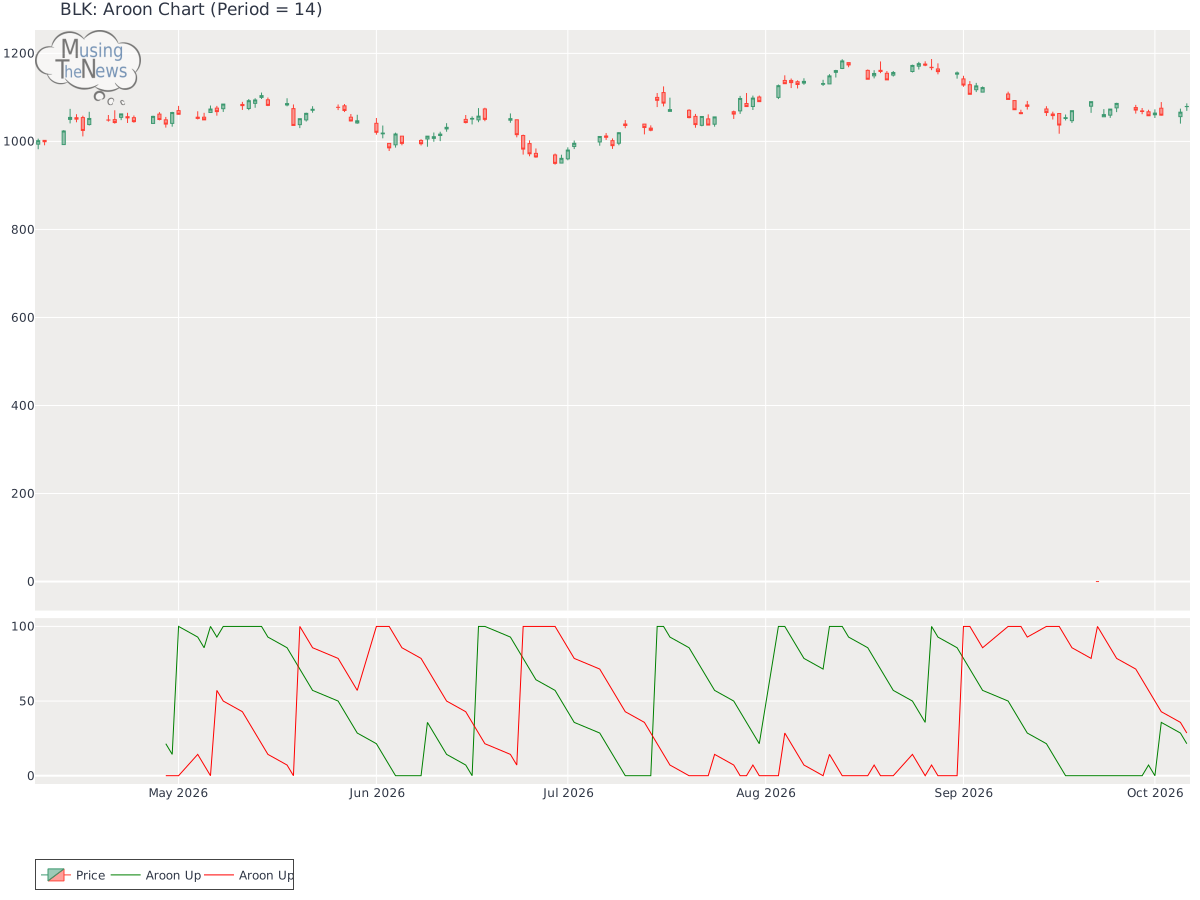
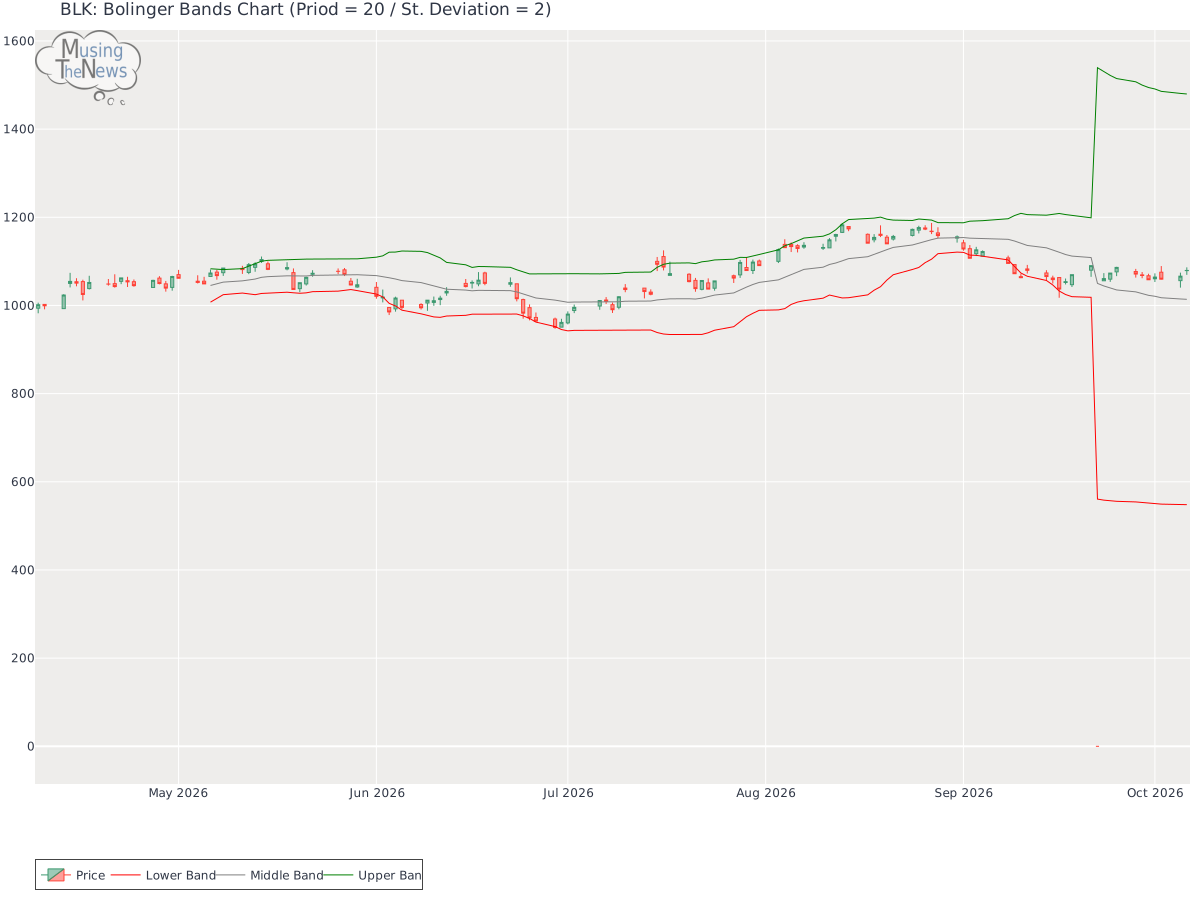
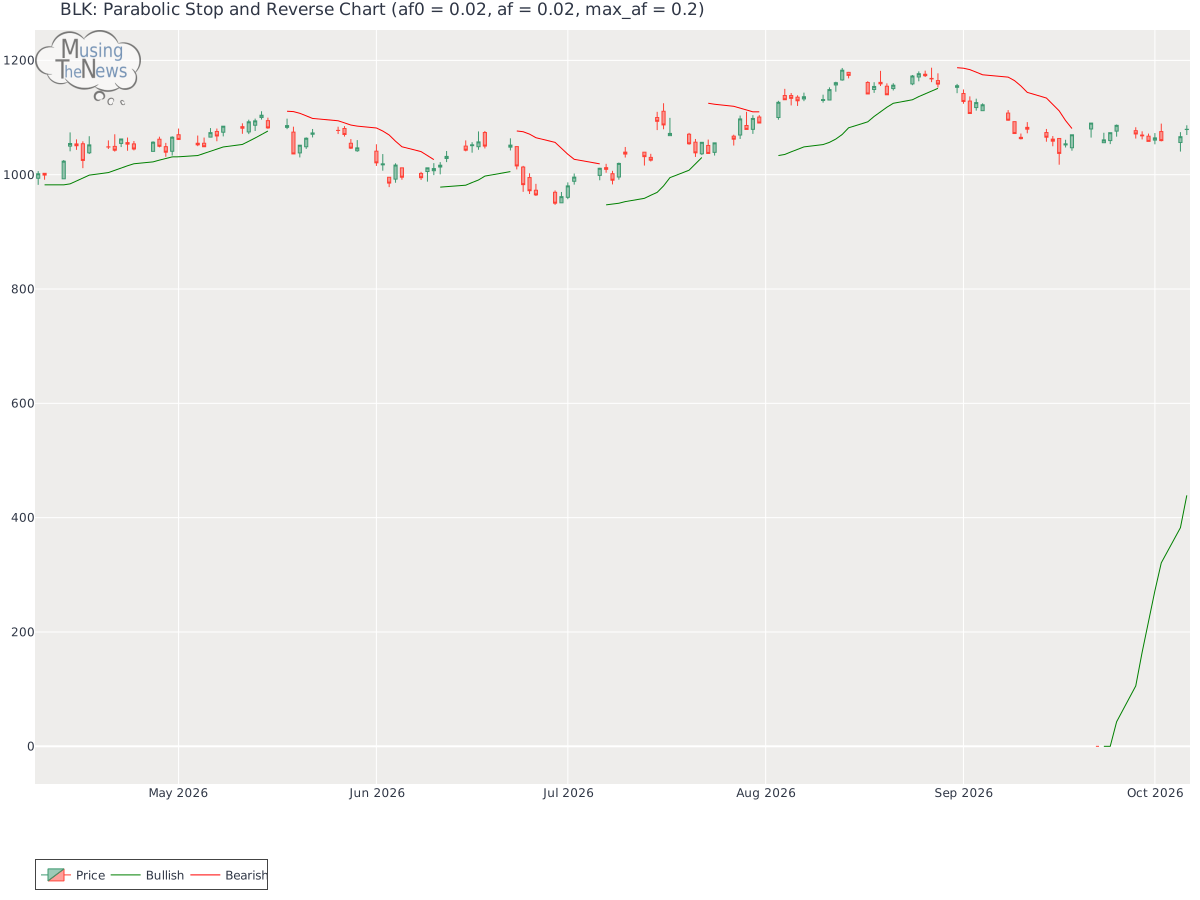
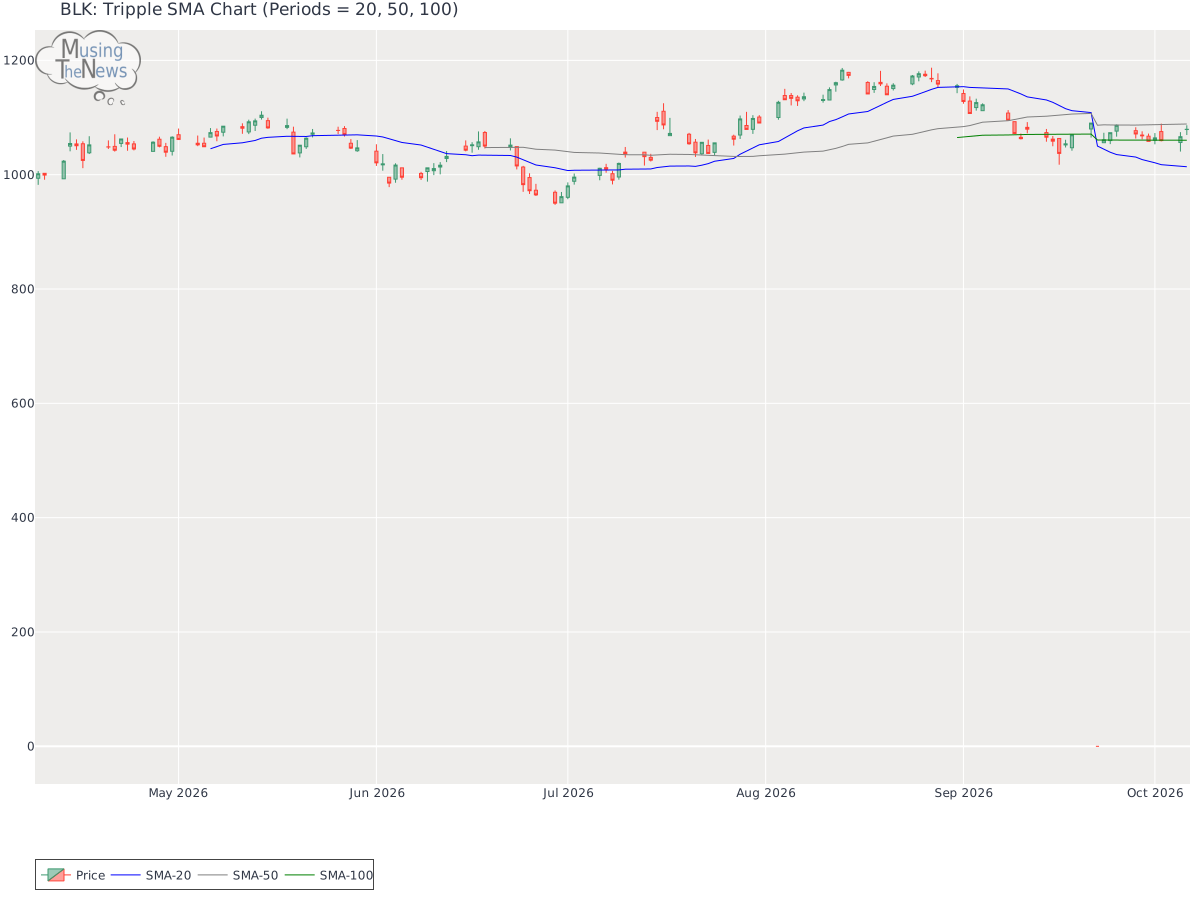
Support and Resistance: The current price of 1079.42 is supported at 1054.56, with resistance at 1104.03. This suggests that the price for BLK might remain between these levels, where 1054.56 acts as a floor and 1104.03 as a ceiling in the market.Support/Resistance for BLKAroon: The AROON is neutral, showing no definitive signals of a trend either upward or downward. This neutral stance indicates a period of market indecision, where the direction is unclear.Aroon chart for BlackRock, Inc.Bol. Bands: The current reading of the BOLL BANDS indicator suggests a neutral stance, with no clear signals indicating an upward or downward direction. This lack of directional bias suggests the market may be in a period of consolidation or uncertainty.Bolinger Bands chart for BlackRock, Inc.Parabolic SAR: The PSAR continues to signal a bullish outlook, establishing a key support level that reinforces the market's upward momentum. This support could serve as a base for continued gains, suggesting that the bullish trend is likely to persist.Parabolic Stop and Reverse chart for BlackRock, Inc.Stochastic: With the K-line above both the D-line and the 80 mark, the stochastic indicator signals a bullish trend. This configuration suggests that the market is experiencing strong upward momentum, likely leading to further gains. Investors may see this as a favorable condition for potential growth.Stochastic chart for BlackRock, Inc.Tripple Moving Agerage: The Tripple MOVING AVG is currently neutral, showing no clear bias toward an upward or downward trend. This suggests that the market may be in a phase of indecision or consolidation.Tripple SMA chart for BlackRock, Inc. A company's technical data, including stock price and trading volume, can provide valuable insights when considered alongside its fundamentals. These include financial performance, market share, and growth strategy, as well as broader industry dynamics. Examining these factors helps investors or analysts make more informed decisions, as the company's fundamentals offer context for understanding how and why certain technical patterns may emerge in the market.