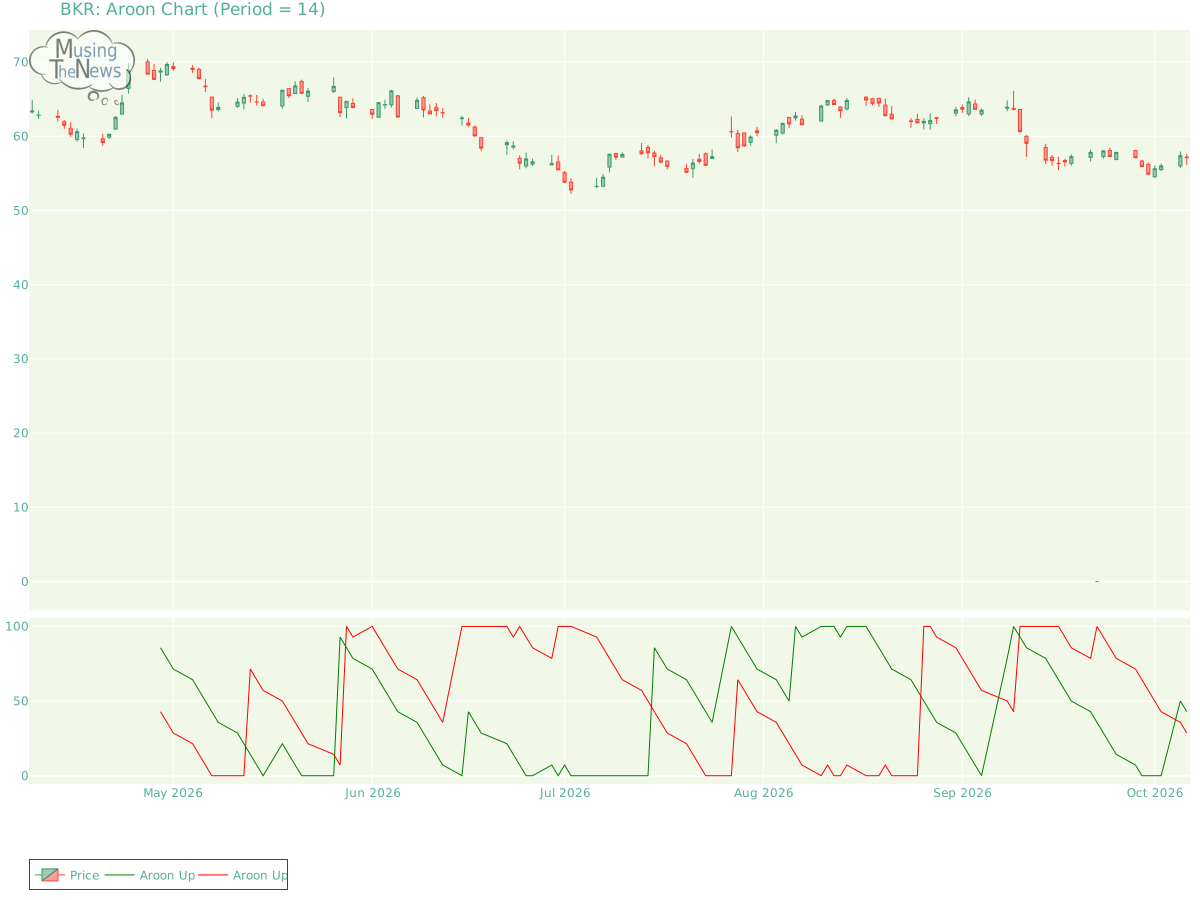
The current reading of the AROON is neutral for BKR, with no clear signals for an upward or downward trend. This indicates that the market may be in a state of uncertainty,...
By MusingTheNews
Updated 2026-10-07 23:25:50
Overall Technical outlook
Price Summary
2026-10-06, saw BKR's stock open at 57.19, hit a peak of 57.61, fall to a low of 56.15, and close lower -0.1% at 57.13, with 4548700 shares changing hands. The stock reached its highest price of 69.67 and lowest price of 0.0 over the last 52 weeks.
Technicals
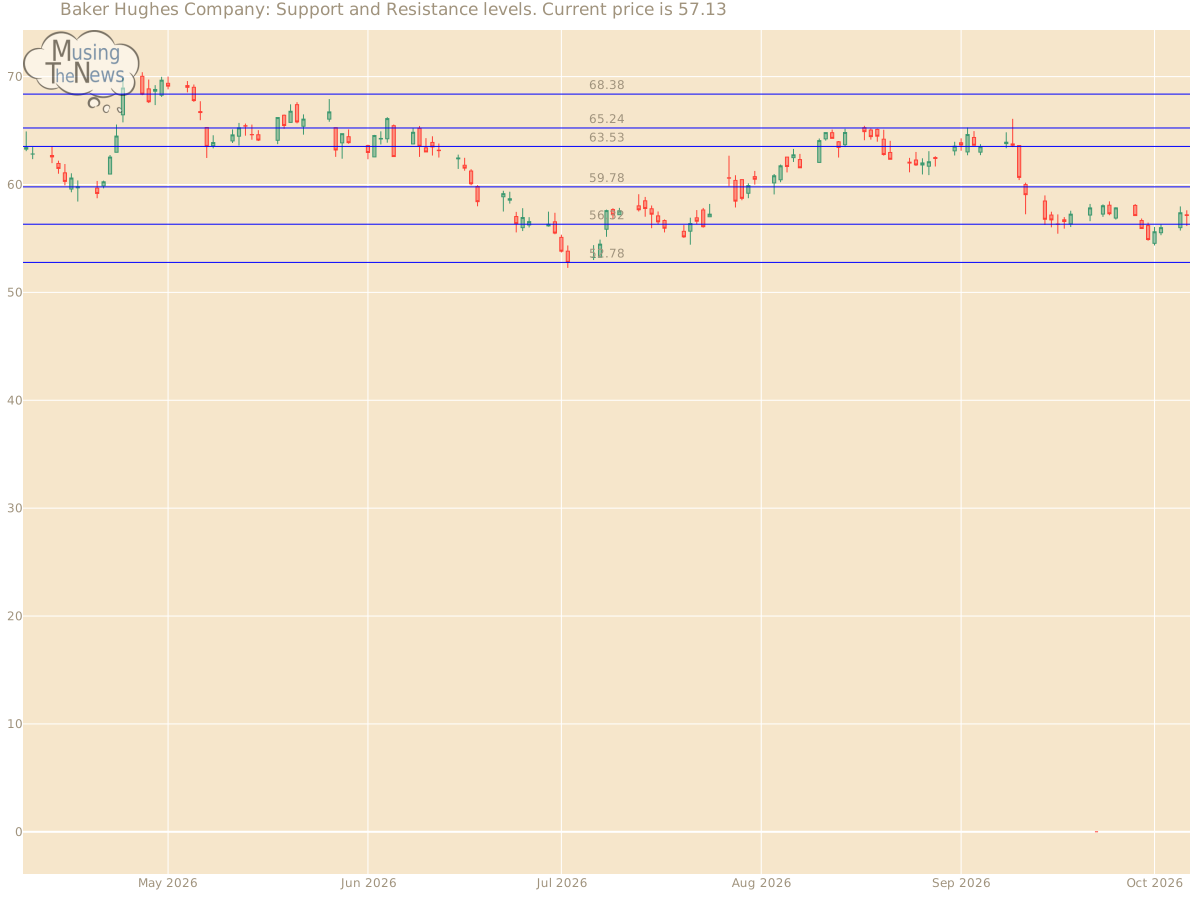
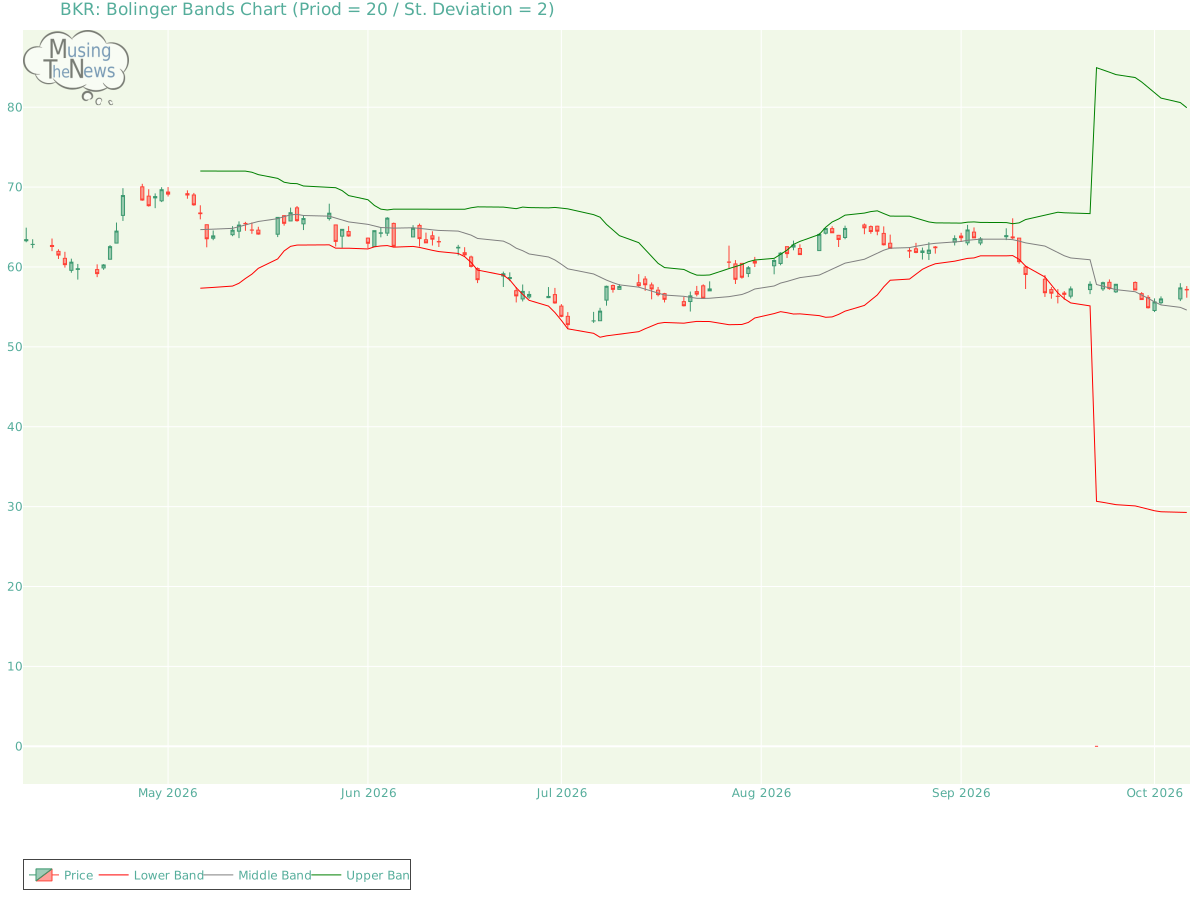
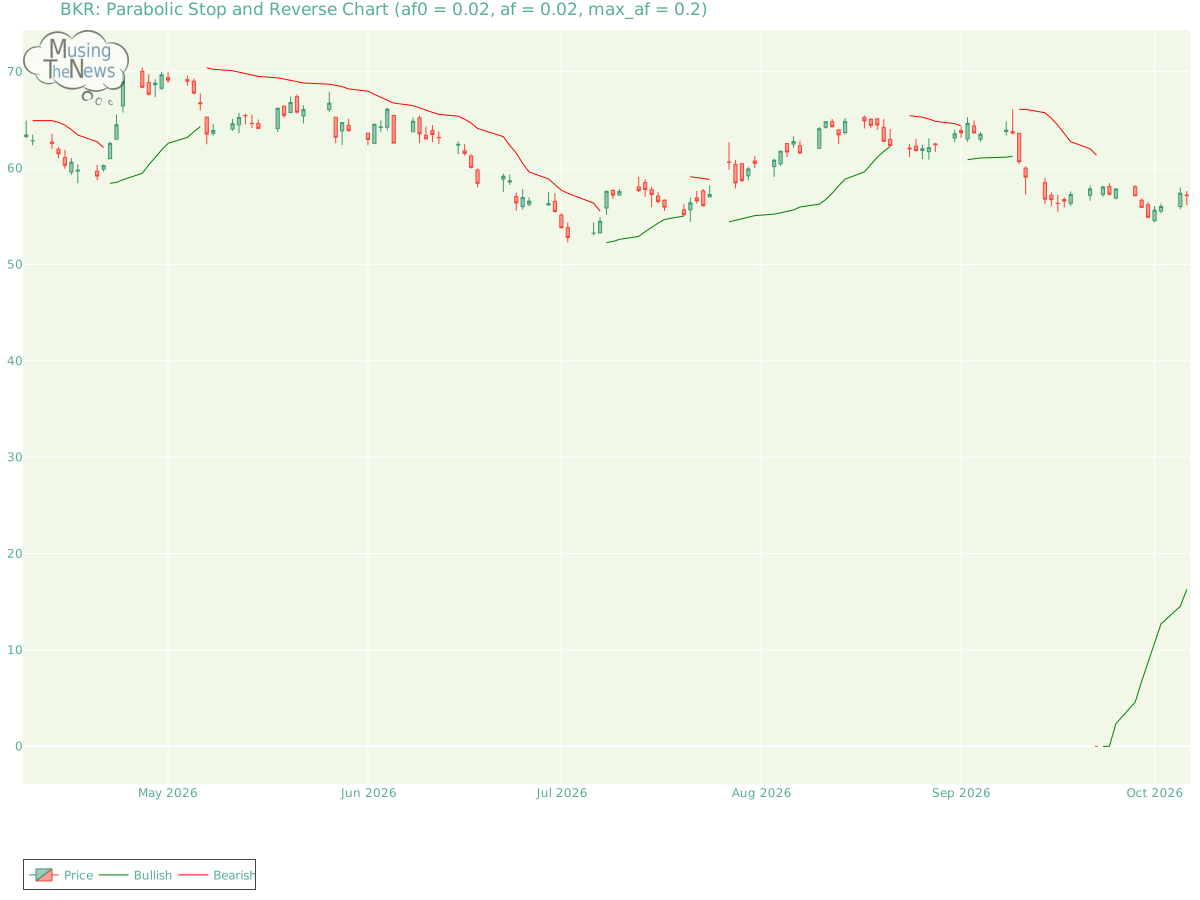
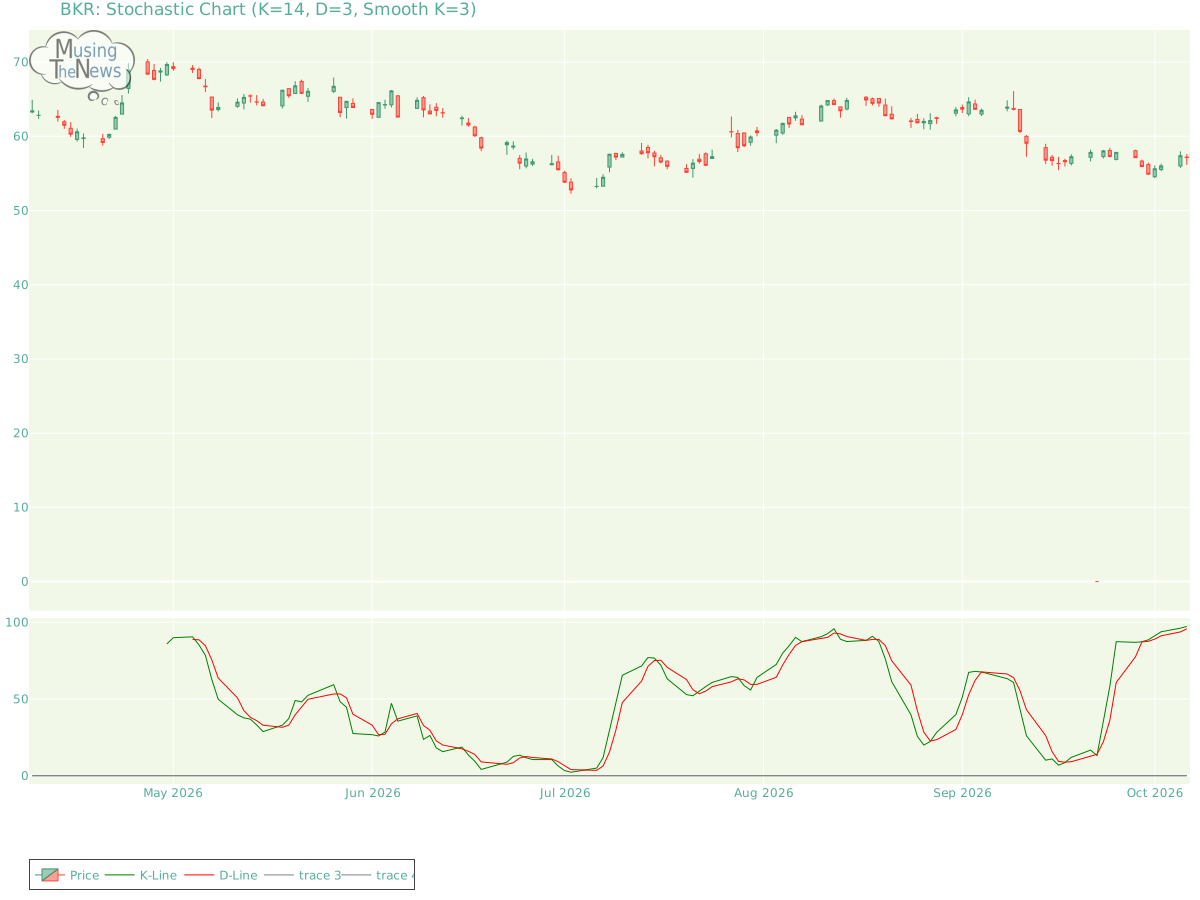
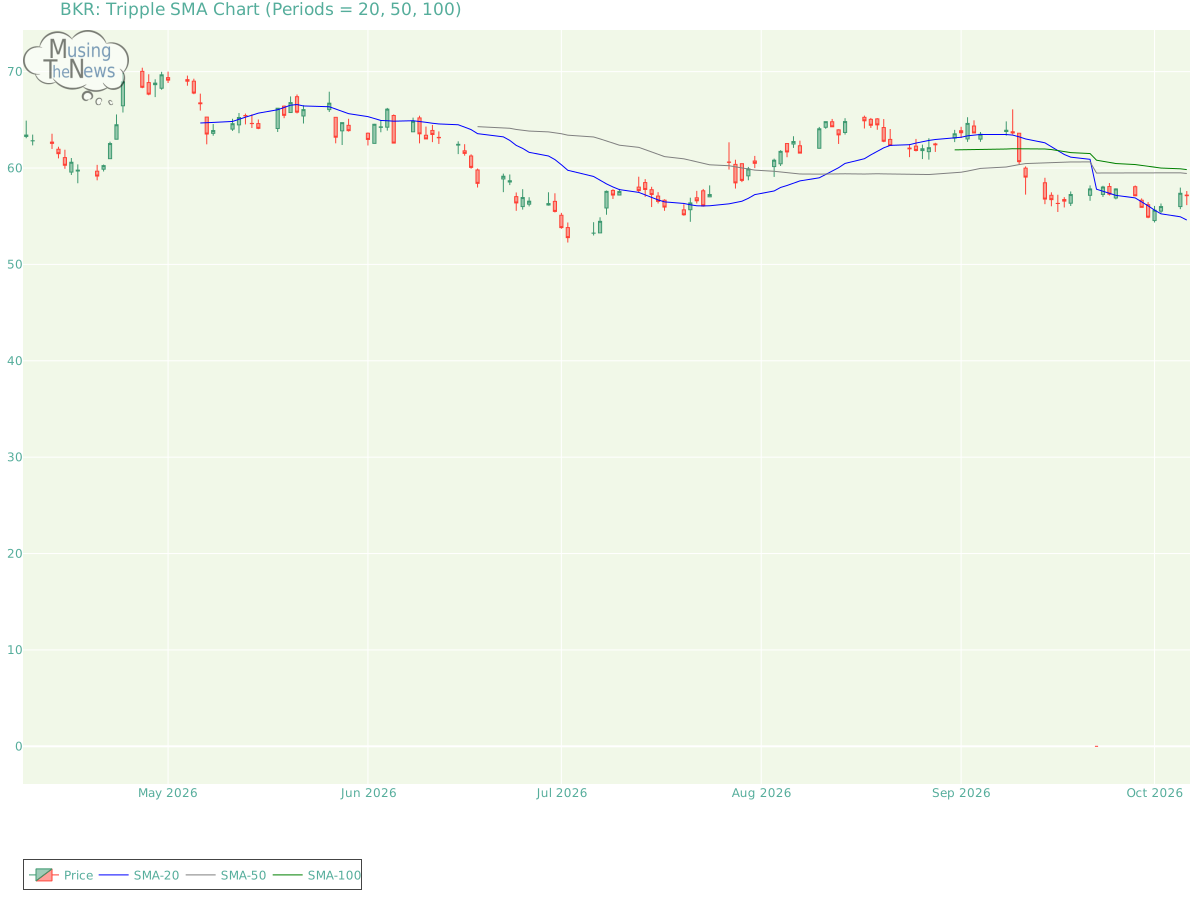
Support and Resistance: The current price of 57.13 for BKR is supported at 56.32 and faces resistance at 59.78. These levels indicate that 56.32 could act as a floor, while 59.78 might limit any further price increases.Support/Resistance for BKRAroon: The current reading of the AROON is neutral for BKR, with no clear signals for an upward or downward trend. This indicates that the market may be in a state of uncertainty, with no dominant force driving the direction.Aroon chart for Baker Hughes CompanyBol. Bands: The BOLL BANDS is in a neutral stance, with no clear direction indicated for the market. This lack of clarity suggests that the market may be in a state of equilibrium for BKR, with no strong trend emerging.Bolinger Bands chart for Baker Hughes CompanyParabolic SAR: The PSAR continues its bullish outlook, reinforcing a crucial support level that may help sustain the current upward trend. This support suggests that the market is likely to continue climbing, with the bullish momentum remaining strong.Parabolic Stop and Reverse chart for Baker Hughes CompanyStochastic: The stochastic indicator for Baker Hughes Company reflects a bullish sentiment, as the K-line is above both the D-line and the 80 threshold. This setup points to strong upward momentum, implying that the market may continue to rise. Traders could consider this as an indication of sustained bullish activity.Stochastic chart for Baker Hughes CompanyTripple Moving Agerage: The alignment of the 20-50-100 period moving averages suggests a bullish trend, but the potential for a reversal is hinted at by the slopes of the shorter-term averages. These faster-moving averages show signs of weakening momentum, indicating that while the overall trend is still upward, a reversal could be approaching.Tripple SMA chart for Baker Hughes Company Understanding a company's fundamentals—such as revenue, earnings, and debt levels—provides a solid foundation for analyzing its technical performance. Similarly, knowledge of the industry, including key competitors and market trends, is critical. Combining this fundamental analysis with technical indicators like stock charts, moving averages, and trading volume enables a more comprehensive approach to evaluating the company's overall health and potential future performance.