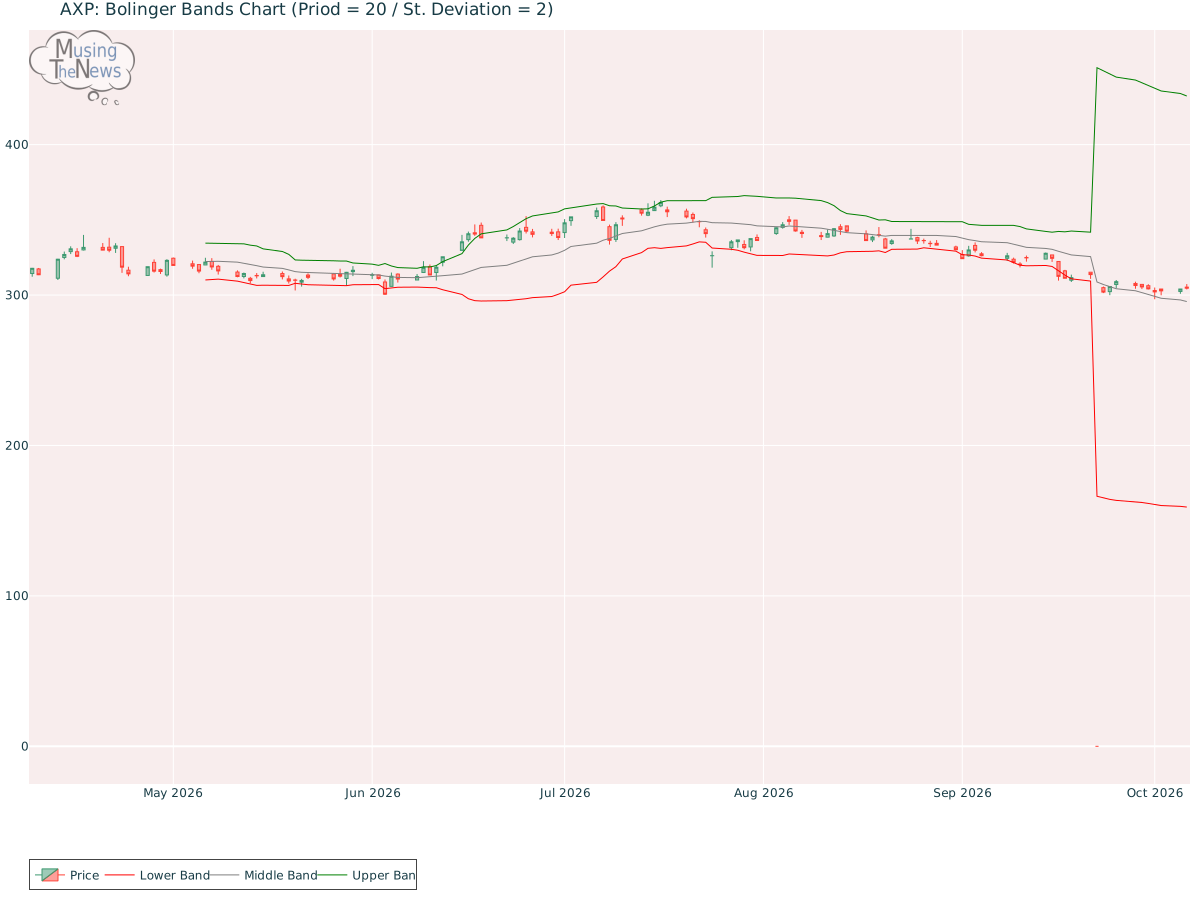
The BOLL BANDS is currently neutral, offering no clear guidance on market direction. This suggests that the market may be in a state of pause, with no strong trend emerging...
By MusingTheNews
Updated 2026-10-07 23:25:45
Overall Technical outlook
Price Summary
On 2026-10-06, American Express Company's stock started at 305.26, soared to 307.3, dropped to 303.74, and finished the day -0.23% down at 304.55, with a trading volume of 2330800 shares. During the 52-week span, the stock hit a high of 384.89 and a low of 0.0.
Technicals
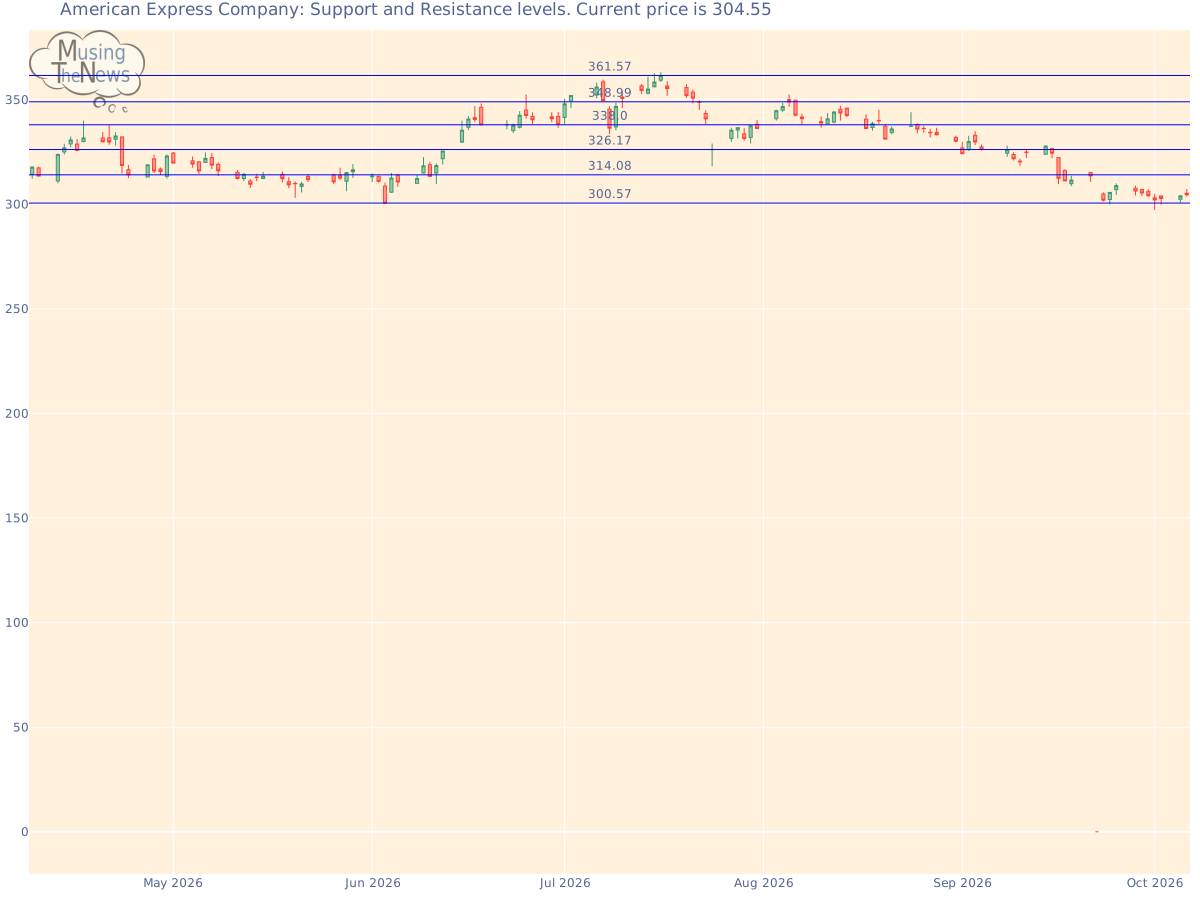
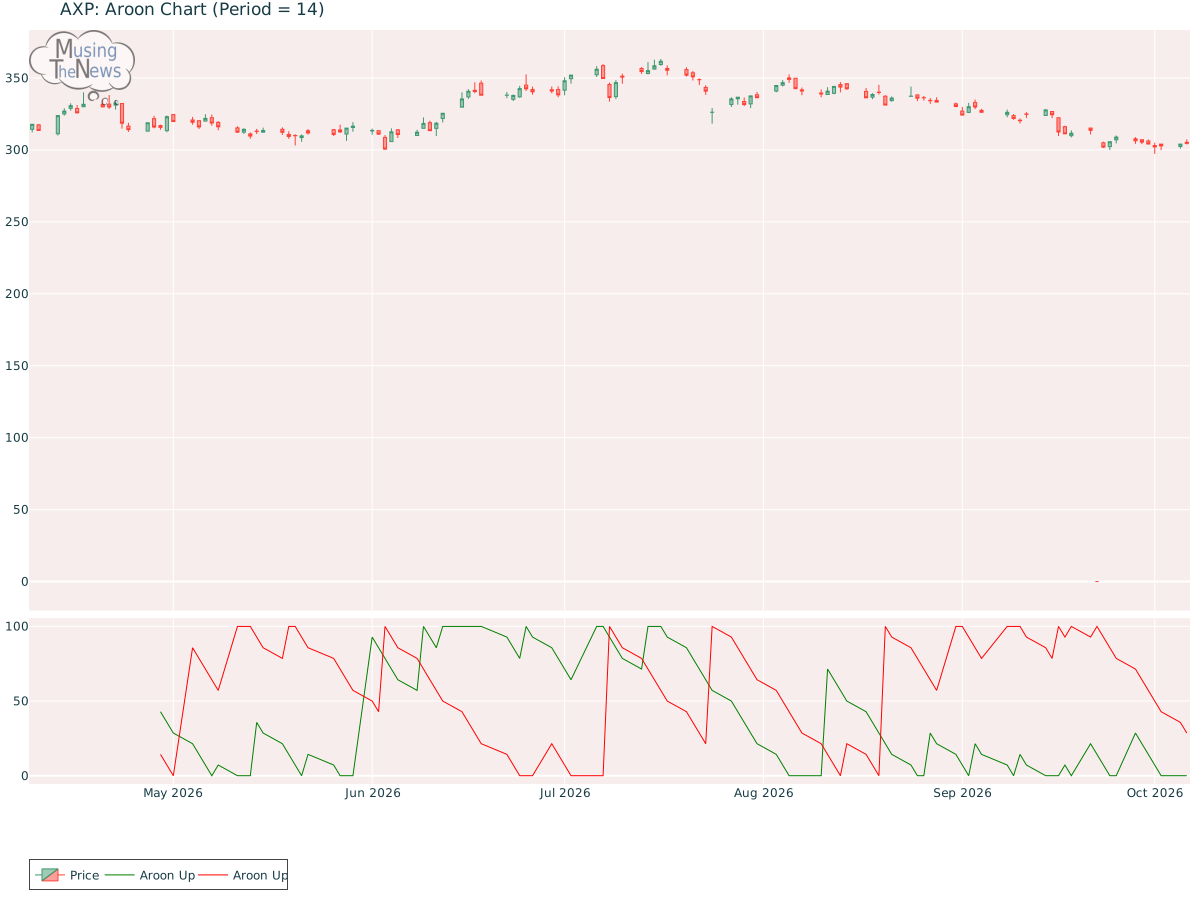
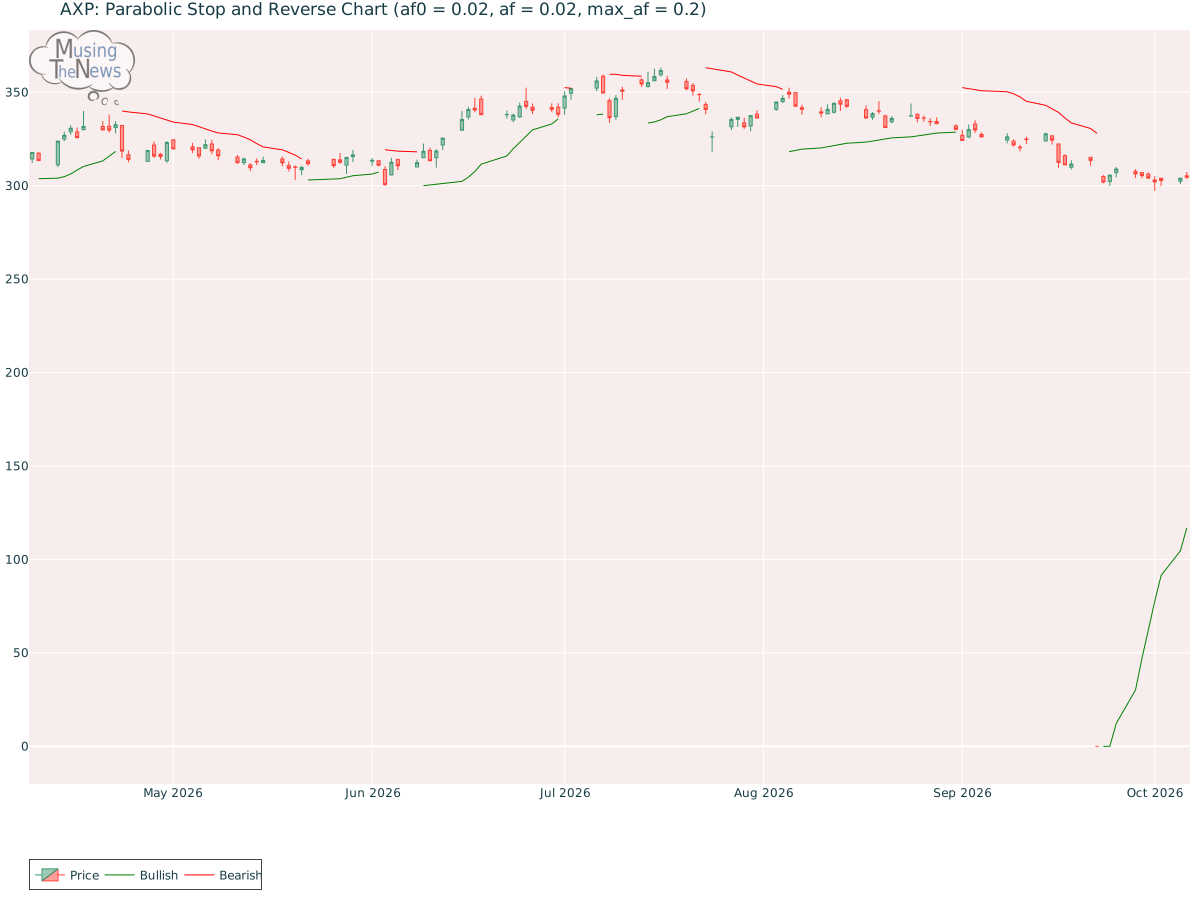
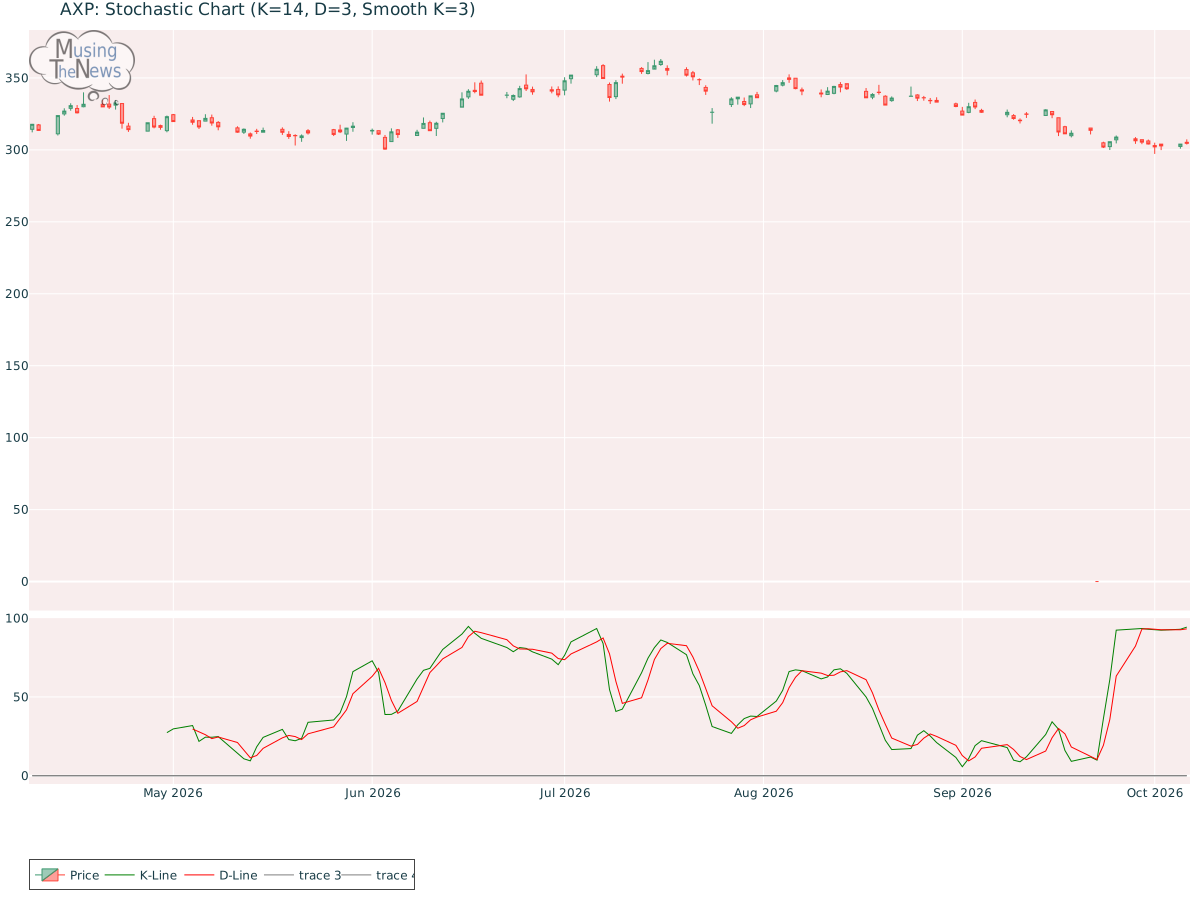
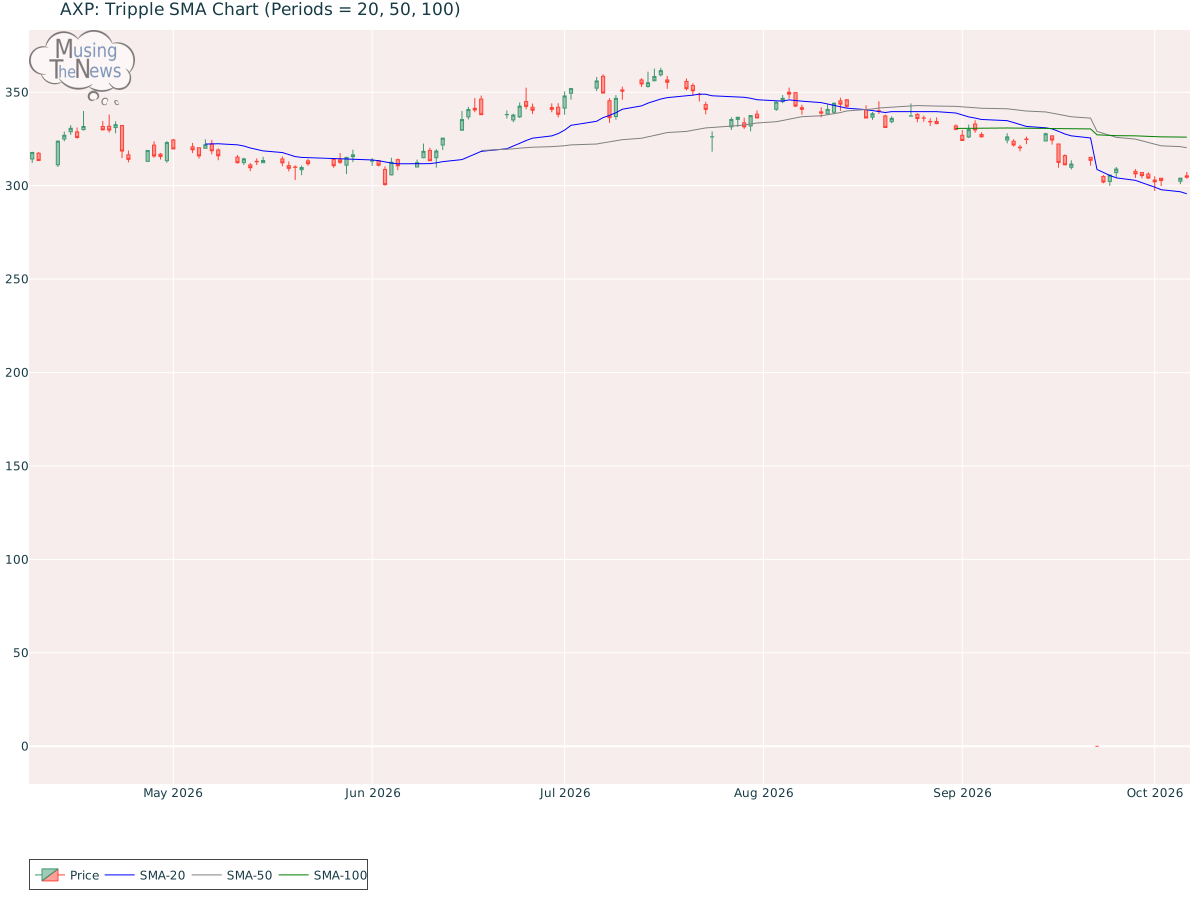
Support and Resistance: At 304.55, the price for AXP is supported at 300.57 and resisted at 314.08. This indicates a trading range where 300.57 serves as a support level, potentially preventing further decline, while 314.08 could limit upward movement.Support/Resistance for AXPAroon: The current reading of the AROON indicator suggests a neutral stance, with no clear signals indicating an upward or downward direction. This lack of directional bias suggests the market may be in a period of consolidation or uncertainty.Aroon chart for American Express CompanyBol. Bands: The BOLL BANDS is currently neutral, offering no clear guidance on market direction. This suggests that the market may be in a state of pause, with no strong trend emerging.Bolinger Bands chart for American Express CompanyParabolic SAR: The PSAR remains bullish, setting a strong support level that could underpin further upward movement. This persistent bullish outlook suggests that the market may continue its positive trajectory, with the established support acting as a safety net.Parabolic Stop and Reverse chart for American Express CompanyStochastic: The stochastic indicator is in a bullish phase, as the K-line is above the D-line and the 80 mark. This setup suggests strong upward momentum, implying that AXP may continue to experience gains. Investors may consider this a positive signal for continued market growth.Stochastic chart for American Express CompanyTripple Moving Agerage: The alignment of the 20-50-100 period moving averages suggests a bullish trend, but the slopes of the faster averages hint at a potential reversal. The weakening signals from these shorter-term averages indicate that the current upward momentum may be fading, suggesting that a change in direction could be near.Tripple SMA chart for American Express Company Before focusing on technical indicators like stock price and volume, it's important to consider a company's fundamentals. These include financial metrics such as profitability, revenue growth, and debt levels. Furthermore, understanding the industry landscape, including competition and consumer trends, provides essential context. By combining this fundamental analysis with technical data, investors can make more informed decisions and draw deeper conclusions about the company's potential for future growth and success.