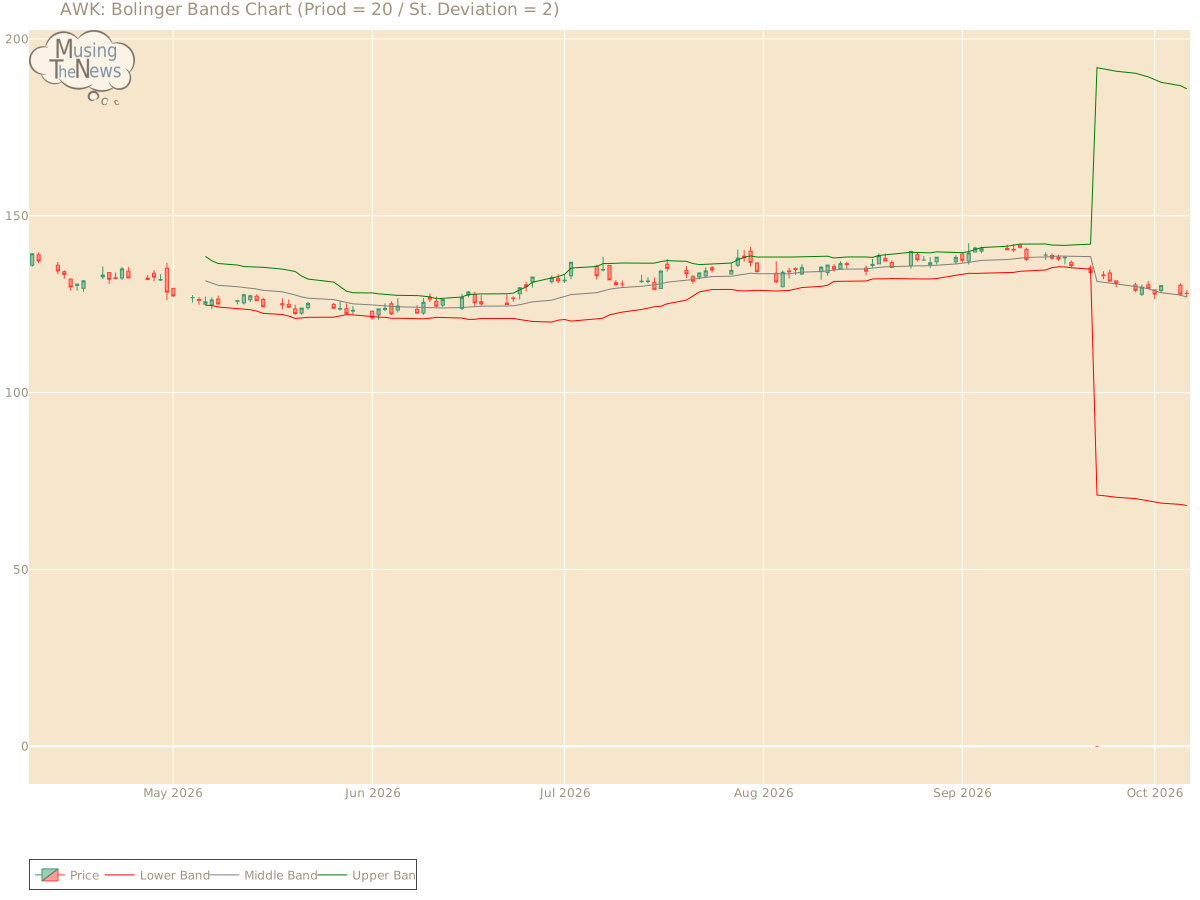
The BOLL BANDS is currently neutral, showing no clear bias toward a rising or falling trend. This lack of directional clarity suggests that the market may be in a holding p...
By MusingTheNews
Updated 2026-10-07 23:25:46
Overall Technical outlook
Price Summary
American Water Works Company, Inc.'s stock, on 2026-10-06 opened at 128.07, climbed to a high of 128.99, dropped to a low of 127.02, and closed up -0.02% at 128.04, with 2067400 shares traded. The stock reached its highest price of 145.43 and its lowest price of 0.0 during the 52-week period.
Technicals
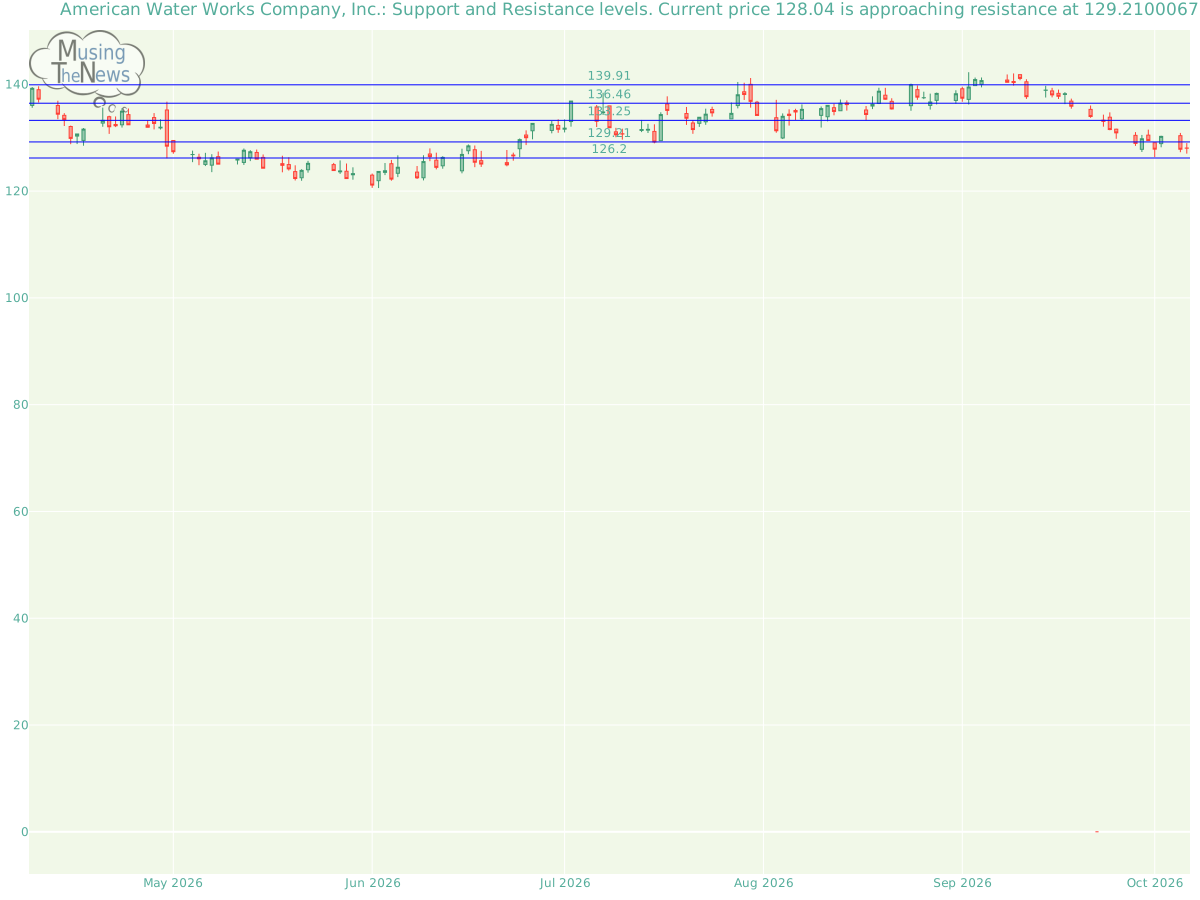
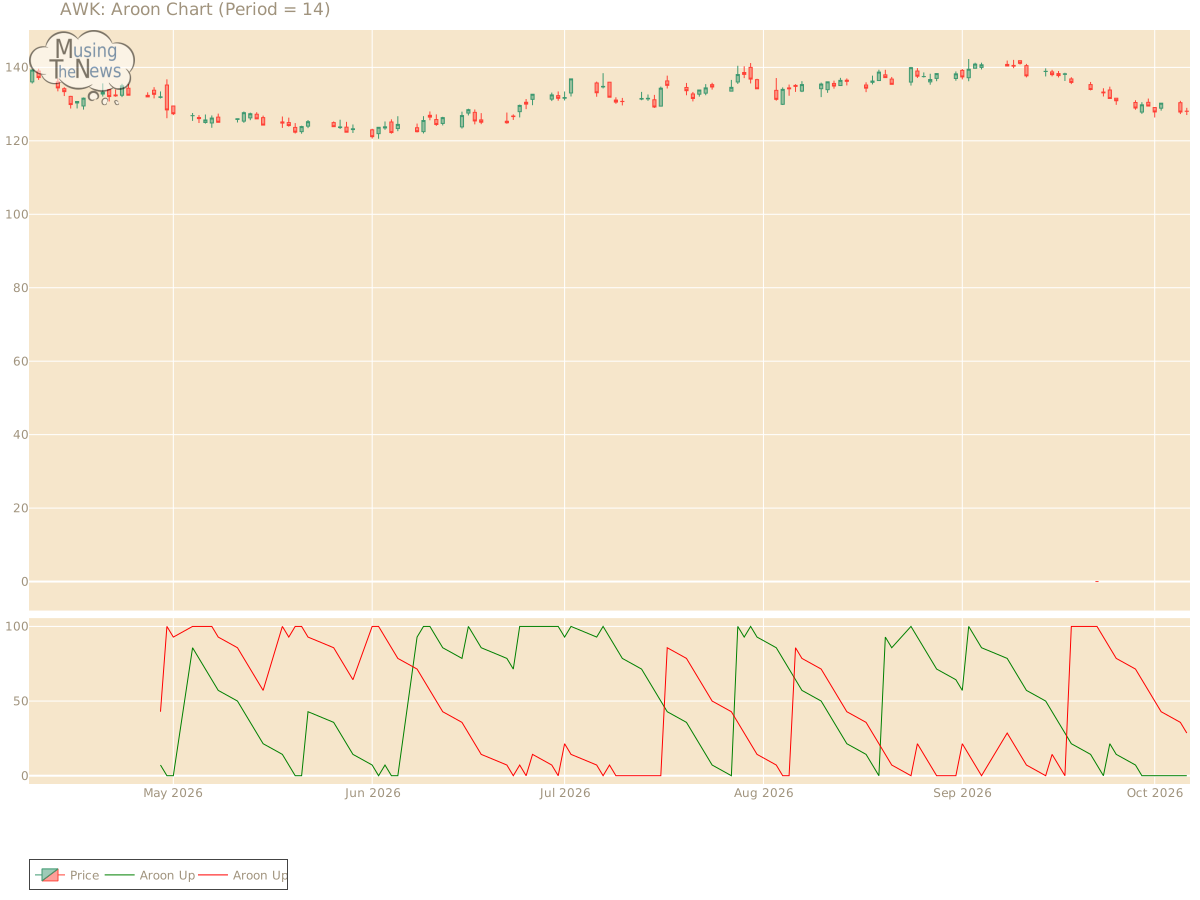
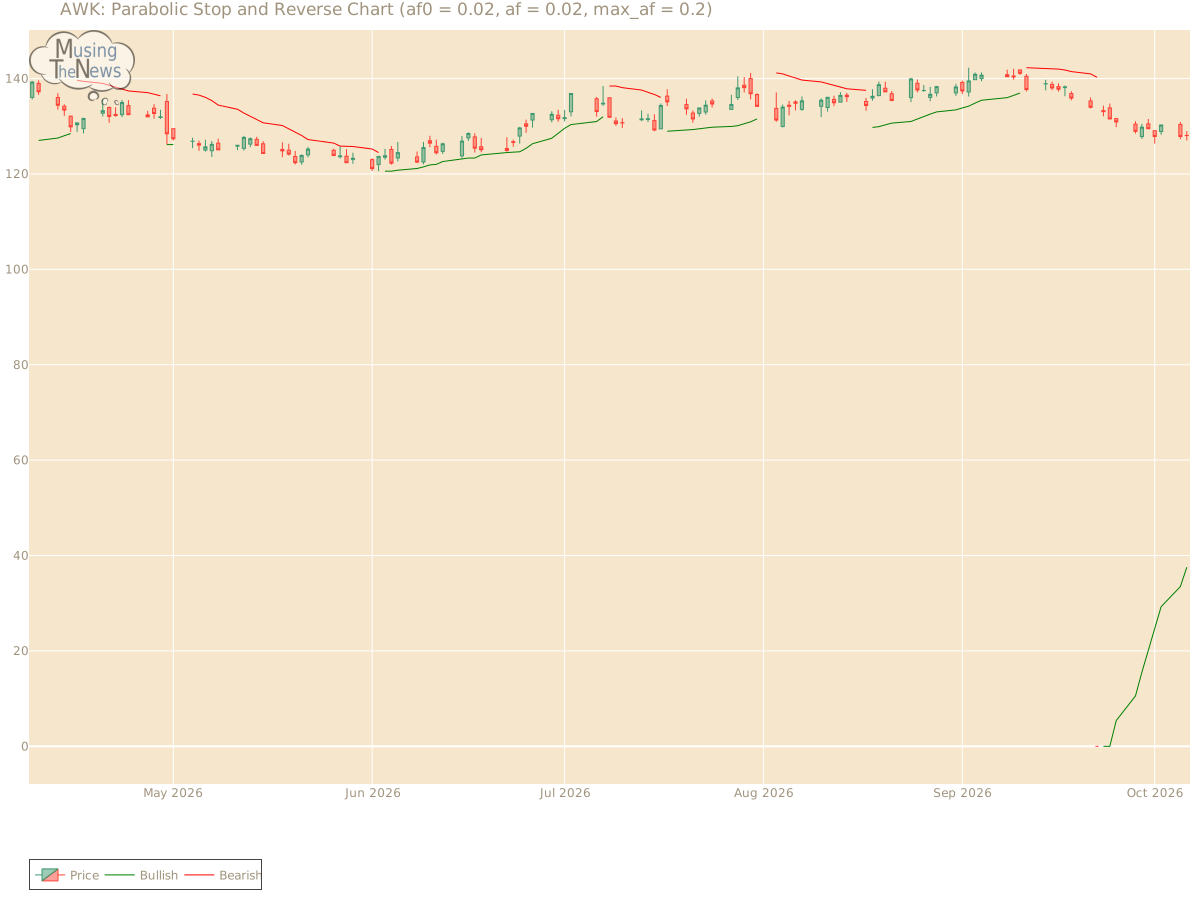
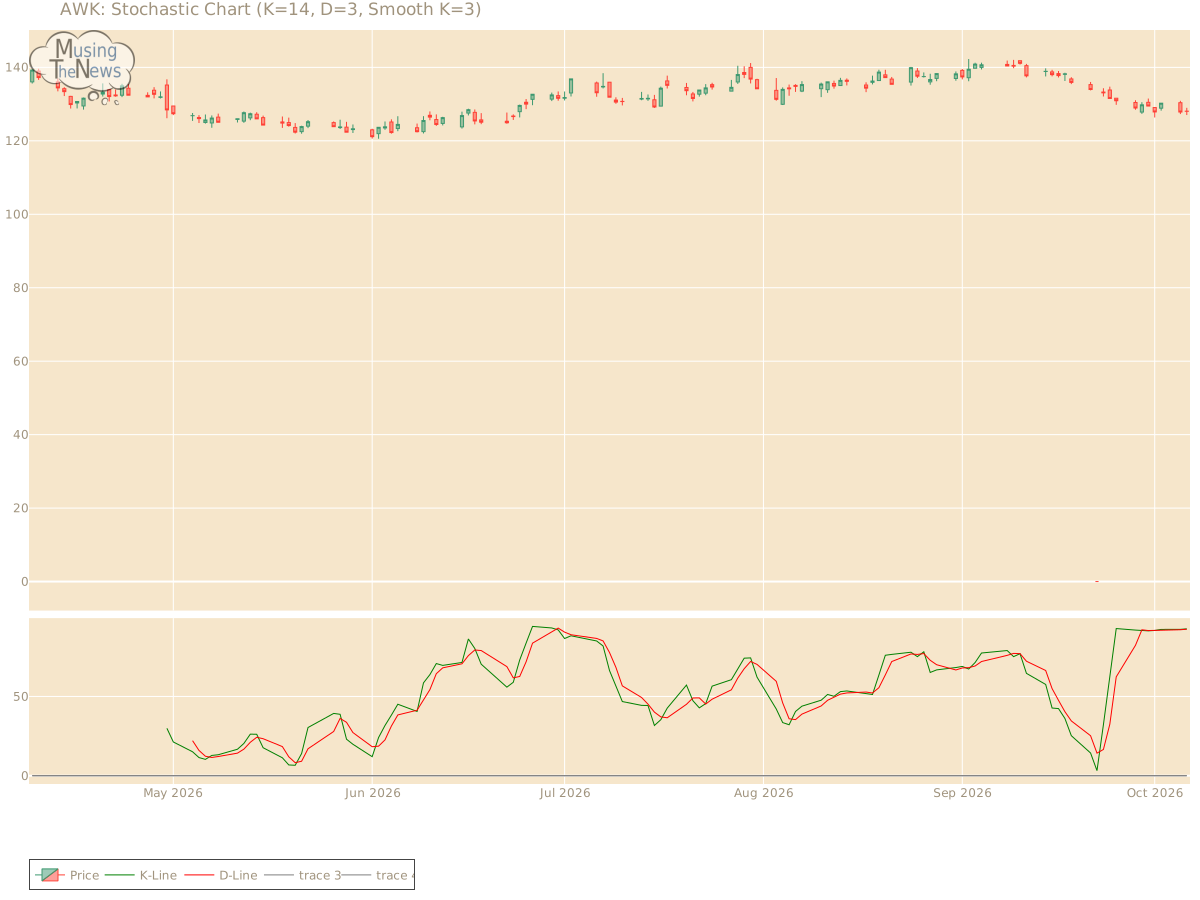
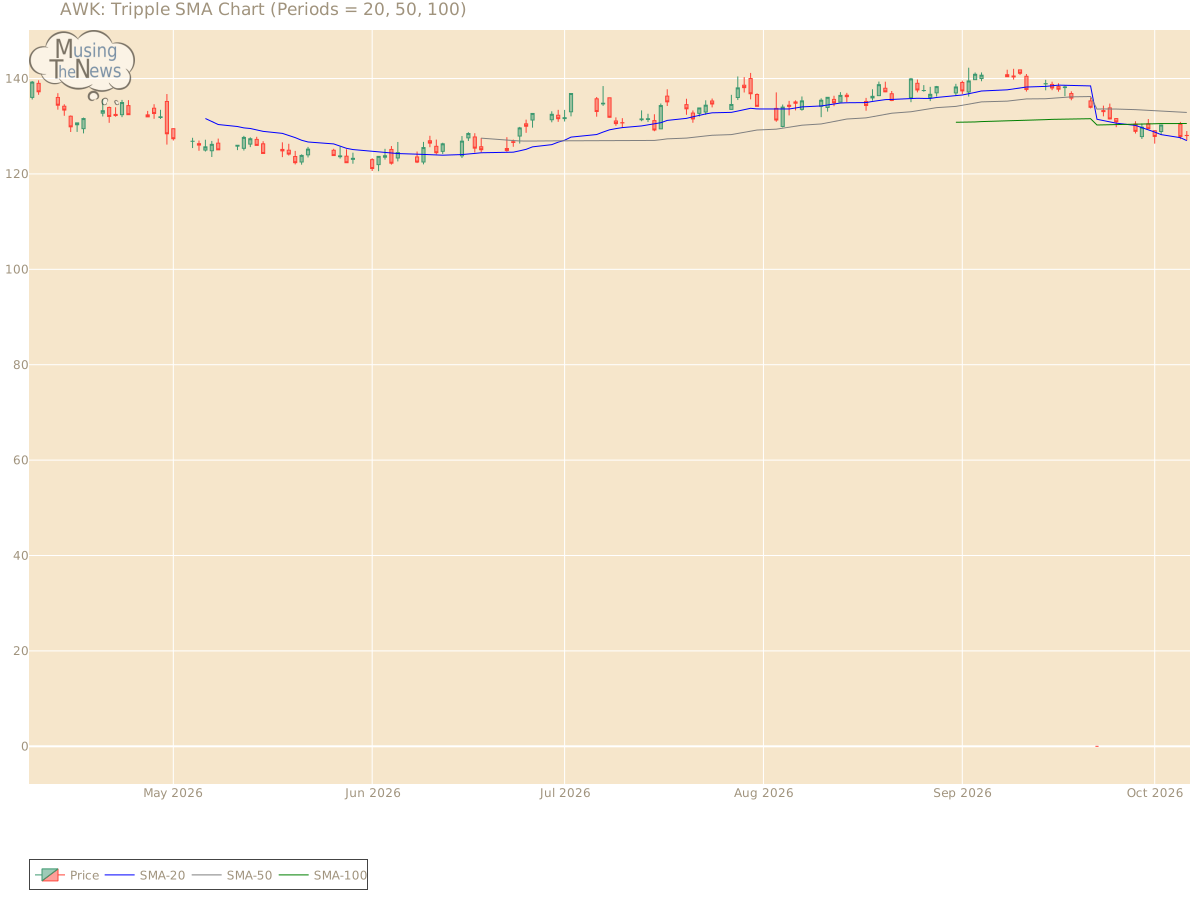
Support and Resistance: At 128.04, the price is supported at 126.2 and faces resistance at 129.21. This range suggests that the price for AWK might stay between these levels, with 126.2 acting as a floor and 129.21 as a ceiling.Support/Resistance for AWKAroon: The AROON is showing a neutral stance, with no definitive indication of an upward or downward trend for AWK. This neutral position suggests a period of indecision in the market, making it difficult to predict the next move.Aroon chart for American Water Works Company, Inc.Bol. Bands: The BOLL BANDS is currently neutral, showing no clear bias toward a rising or falling trend. This lack of directional clarity suggests that the market may be in a holding pattern, awaiting further developments.Bolinger Bands chart for American Water Works Company, Inc.Parabolic SAR: The PSAR continues to indicate a bullish outlook, establishing a key support level that could sustain the market's upward trend. This support suggests that the bullish momentum is likely to persist, offering a foundation for further growth.Parabolic Stop and Reverse chart for American Water Works Company, Inc.Stochastic: The stochastic indicator is in a bullish phase, with the K-line positioned above the D-line and the 80 threshold. This alignment suggests strong upward momentum for AWK, indicating that the market may continue to trend higher. Traders might see this as a positive signal for sustained strength.Stochastic chart for American Water Works Company, Inc.Tripple Moving Agerage: The Tripple MOVING AVG is showing a neutral stance, with no definitive indication of an upward or downward trend for AWK. This neutral position suggests a period of indecision in the market, making it difficult to predict the next move.Tripple SMA chart for American Water Works Company, Inc. To derive valuable insights from a company's technical performance, it is essential to first understand its fundamentals. This includes its financial health, business model, and market share. Equally important is the industry context, such as competition, consumer demand, and market trends. By examining these aspects together, investors can gain a more comprehensive view of how the company's stock behaves and whether it's aligned with its underlying value.
American Water Works Company Inc.AWK share priceAWK technical chartAWK stock chartAWK techncal analysisAWK price trendsAWK stock signalsAWK stock pricestock marketNSE stock chart