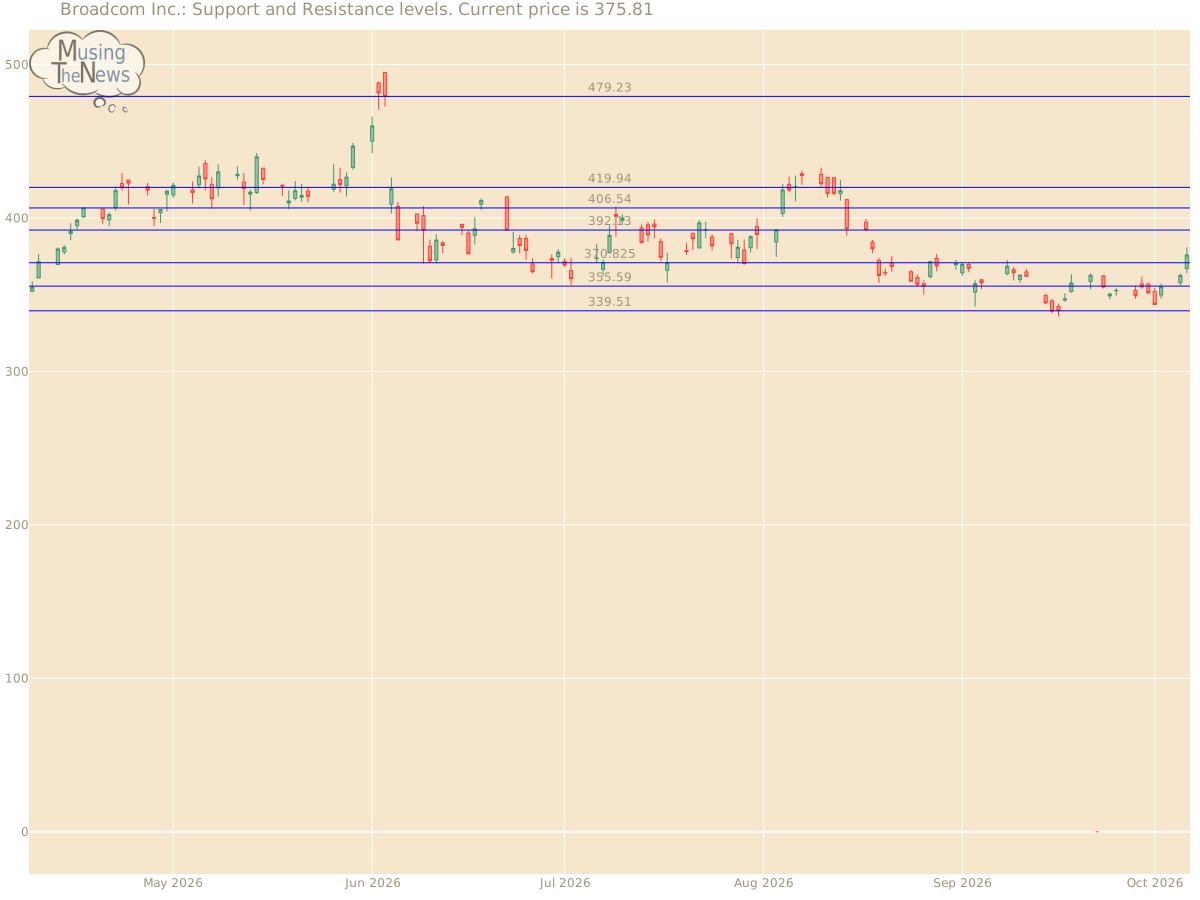
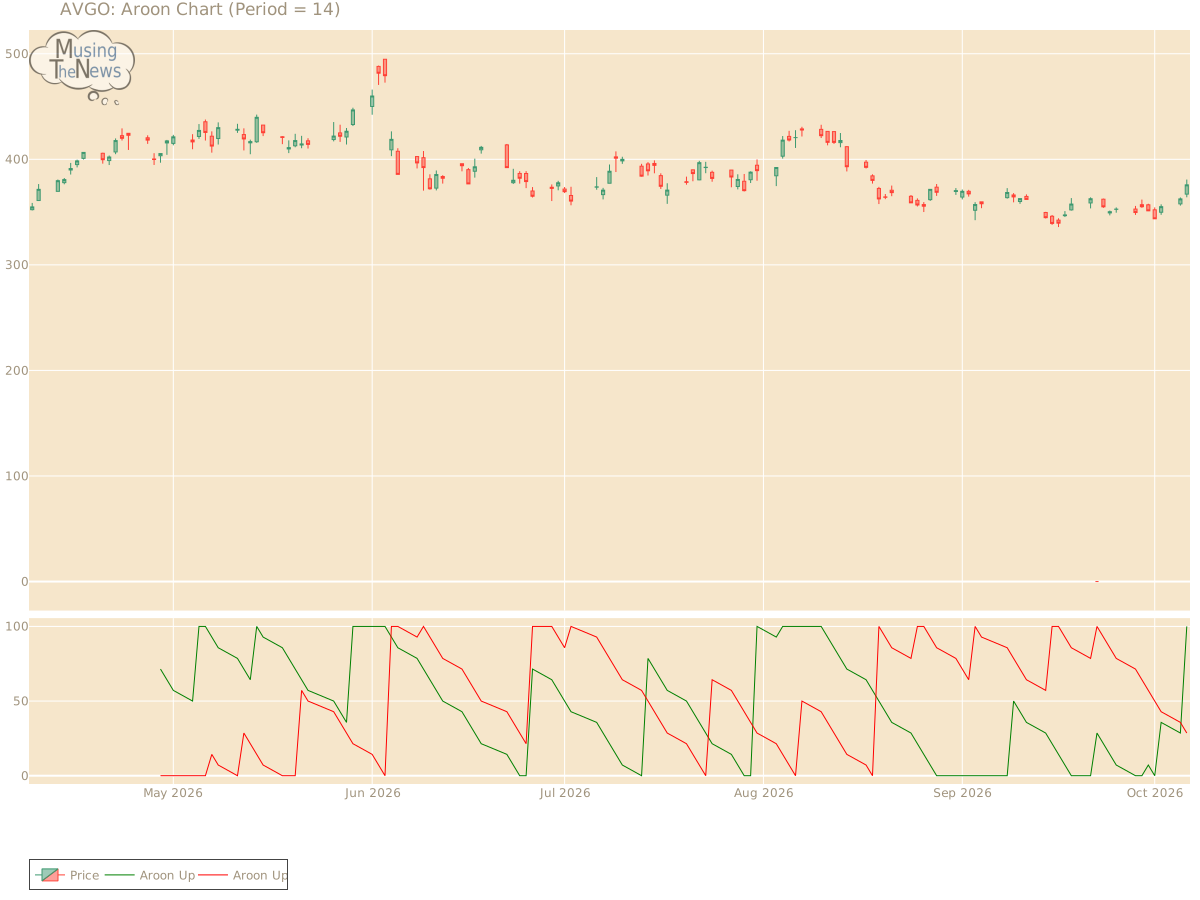
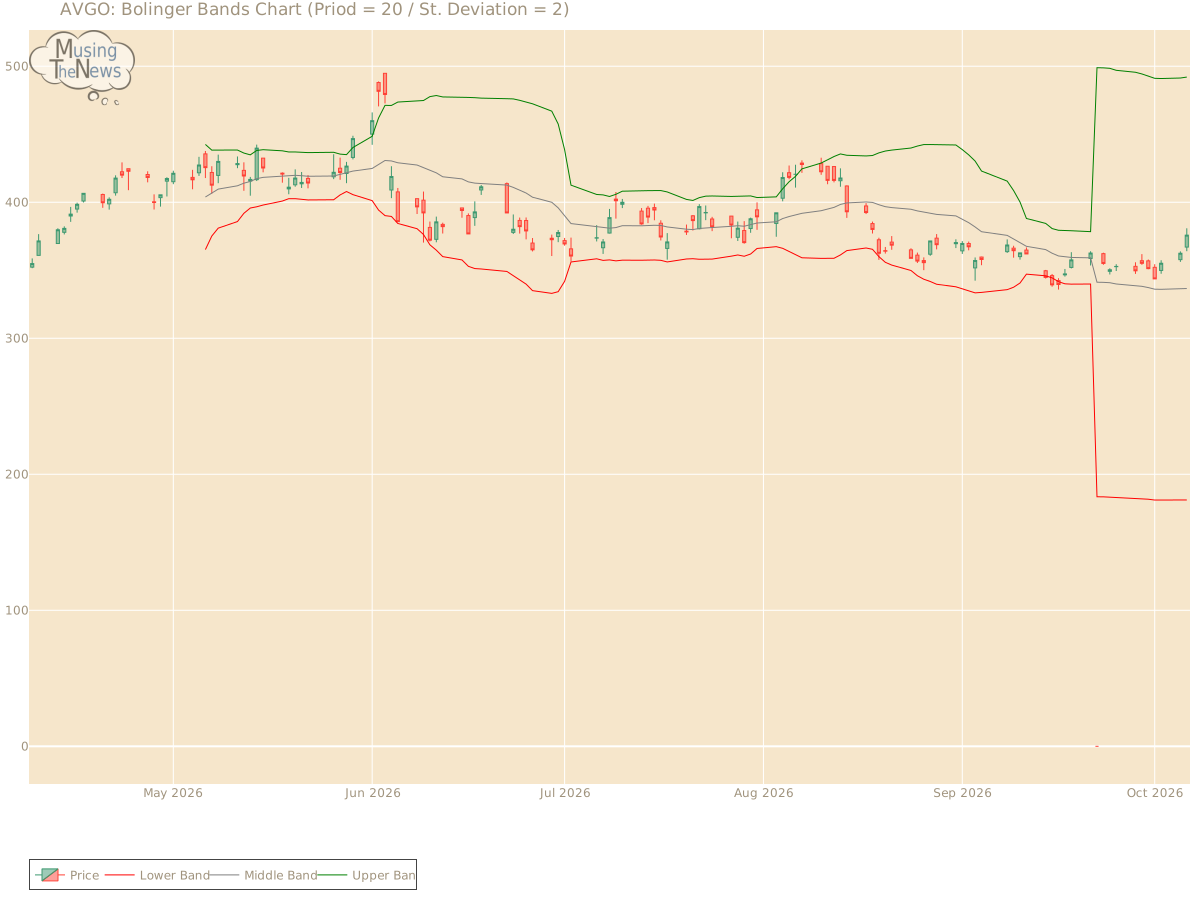
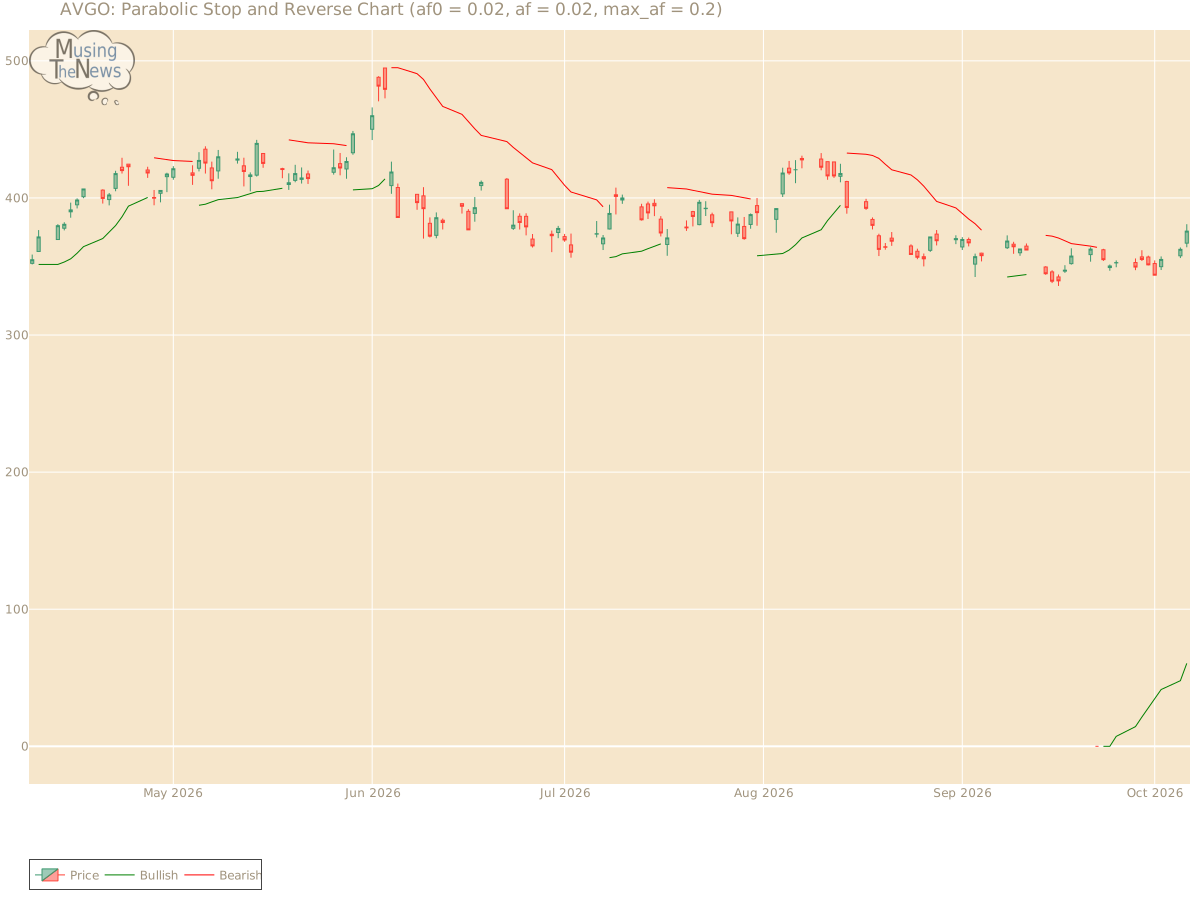
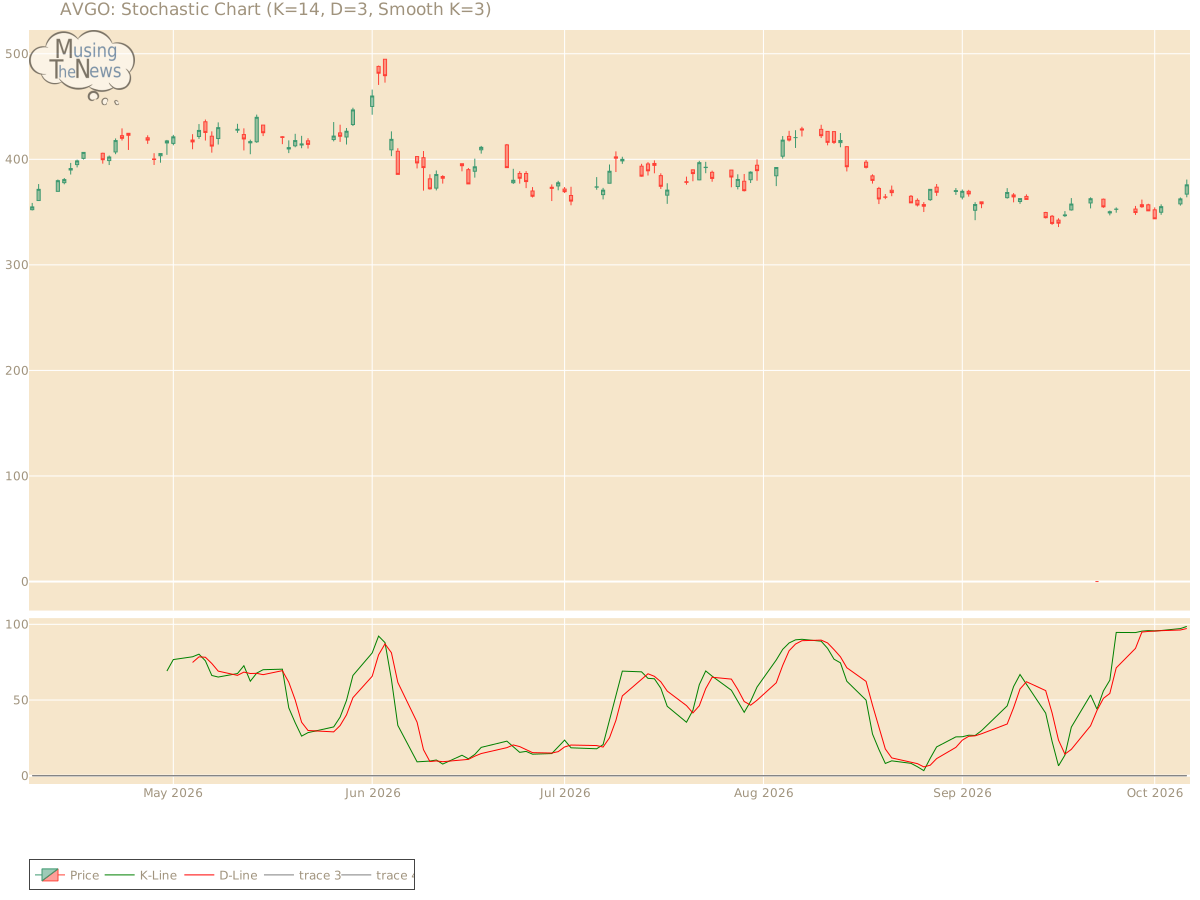
The stochastic indicator shows bullish conditions, with the K-line positioned above the D-line and exceeding the 80 level. This setup suggests strong upward momentum, indic...
By MusingTheNews
Updated 2026-10-07 23:25:53
Overall Technical outlook
Price Summary
The stock of Broadcom Inc. experienced a 2.39% increase, showcasing a outstanding market performance. On 2026-10-06, Broadcom Inc.'s stock started at 367.03, soared to 380.84, dropped to 364.01, and finished the day 2.39% up at 375.81, with a trading volume of 30791100 shares. Throughout the 52-week period, the stock hit a high of 481.57 and a low of 0.0.
Technicals
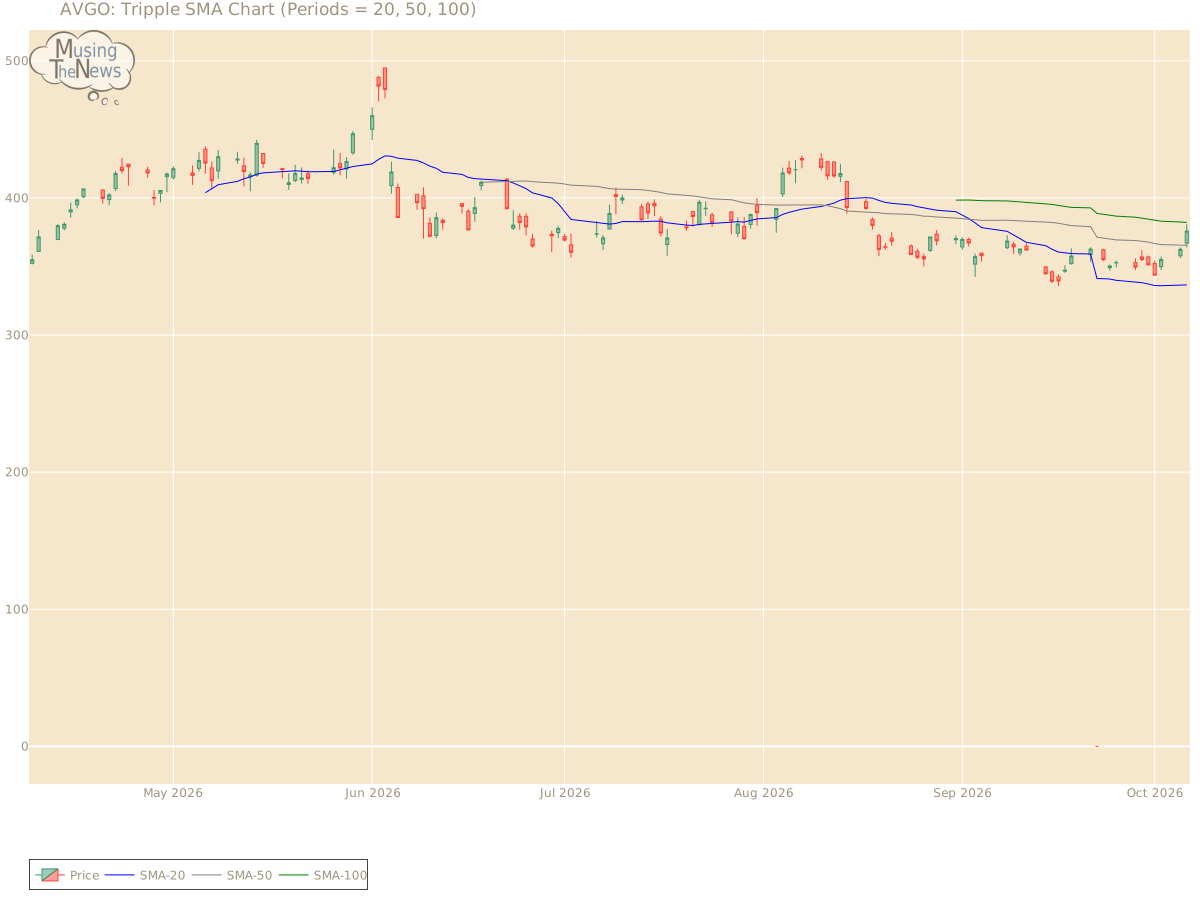
Support and Resistance: The current price is 375.81, with support at 370.83 and resistance at 392.13. This range suggests that the price might move between these levels, with 370.83 offering support and 392.13 capping further gains for Broadcom Inc..Support/Resistance for AVGOAroon: The AROON indicator suggests a robust bullish trend, with the Aroon Up rising and the Aroon Oscillator reversing. This indicates a potential upward trend reversal, signaling that market sentiment is becoming more positive. Investors may anticipate continued upward movement, as the AROON's signals point to a shift in market dynamics favoring a bullish outlook.Aroon chart for Broadcom Inc.Bol. Bands: The BOLL BANDS is in a neutral stance, with no clear signals for movement up or down. This neutral position indicates a potential period of consolidation or uncertainty in the market.Bolinger Bands chart for Broadcom Inc.Parabolic SAR: The PSAR maintains its bullish stance, setting a significant support level that could help sustain the market's upward movement. This strong support suggests that Broadcom Inc. is likely to continue trending higher, providing investors with confidence in the ongoing bullish momentum.Parabolic Stop and Reverse chart for Broadcom Inc.Stochastic: The stochastic indicator shows bullish conditions, with the K-line positioned above the D-line and exceeding the 80 level. This setup suggests strong upward momentum, indicating that the market may continue to rise. Investors might view this as a favorable sign for continued growth.Stochastic chart for Broadcom Inc.Tripple Moving Agerage: The Tripple MOVING AVG is currently in a neutral position, offering no clear indication of movement up or down. This suggests that the market may be experiencing a period of equilibrium, with no strong trend in play.Tripple SMA chart for Broadcom Inc. A thorough analysis of a company involves looking at both its fundamentals and technical data. The fundamentals, including revenue, profitability, and management quality, offer insight into the company's long-term value. Additionally, understanding the broader industry context, such as market competition and regulatory challenges, helps to better interpret the company's stock performance. By combining both fundamental and technical analysis, you can derive more meaningful inferences about the company's future prospects.