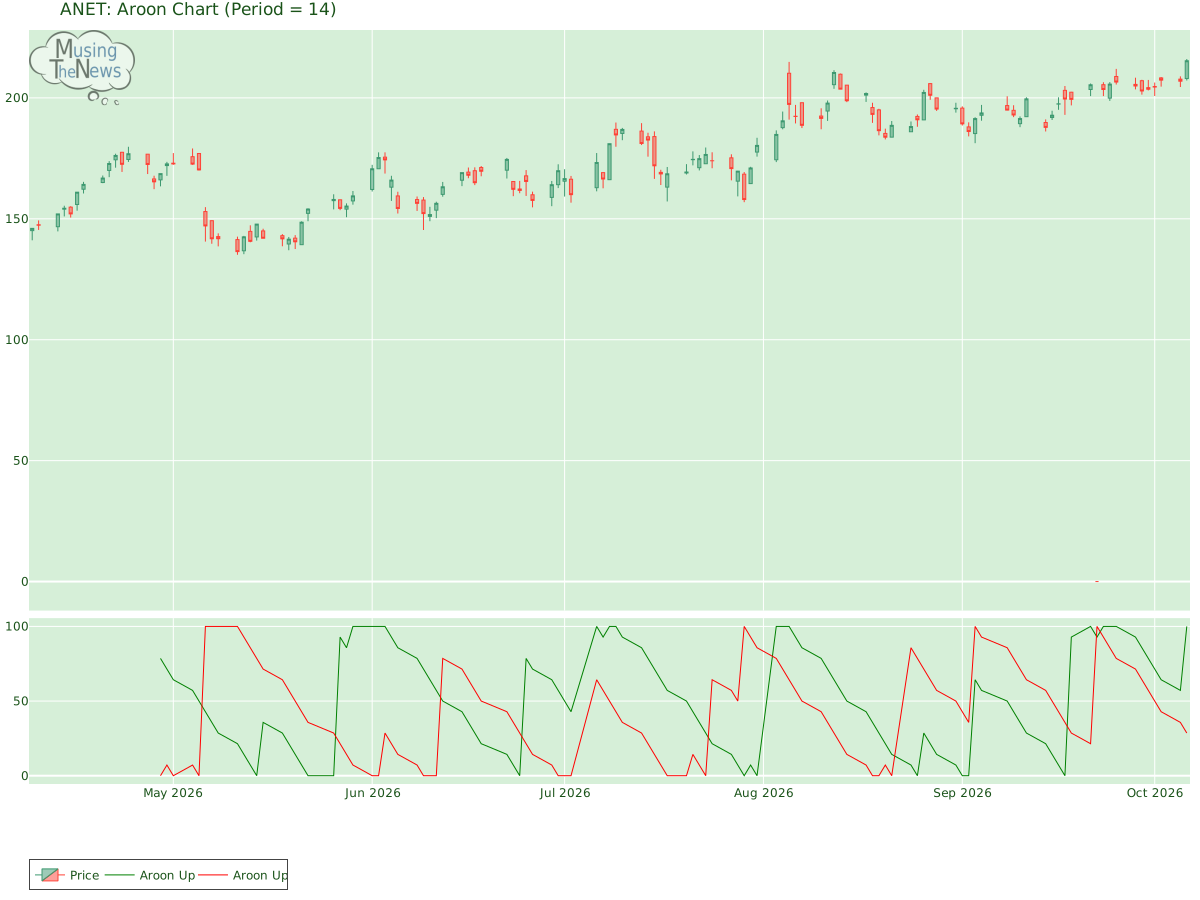
Aroon's bullish trend continues, with Aroon Up at the 100 level, indicating sustained market strength for ANET. This trend warrants further exploration alongside other indi...
By MusingTheNews
Updated 2026-10-07 23:25:48
Overall Technical outlook
Price Summary
Arista Networks, Inc. had a phenomenal day at the stock market, and its shares rose 3.54%. On 2026-10-06, Arista Networks, Inc.'s stock opened at 208.0, spiked to 216.07, declined to 207.2, and closed 3.54% up at 215.36, with 6969400 shares traded. The stock's highest price in the past 52 weeks is 215.36, while its lowest price during the same period is 0.0.
Technicals
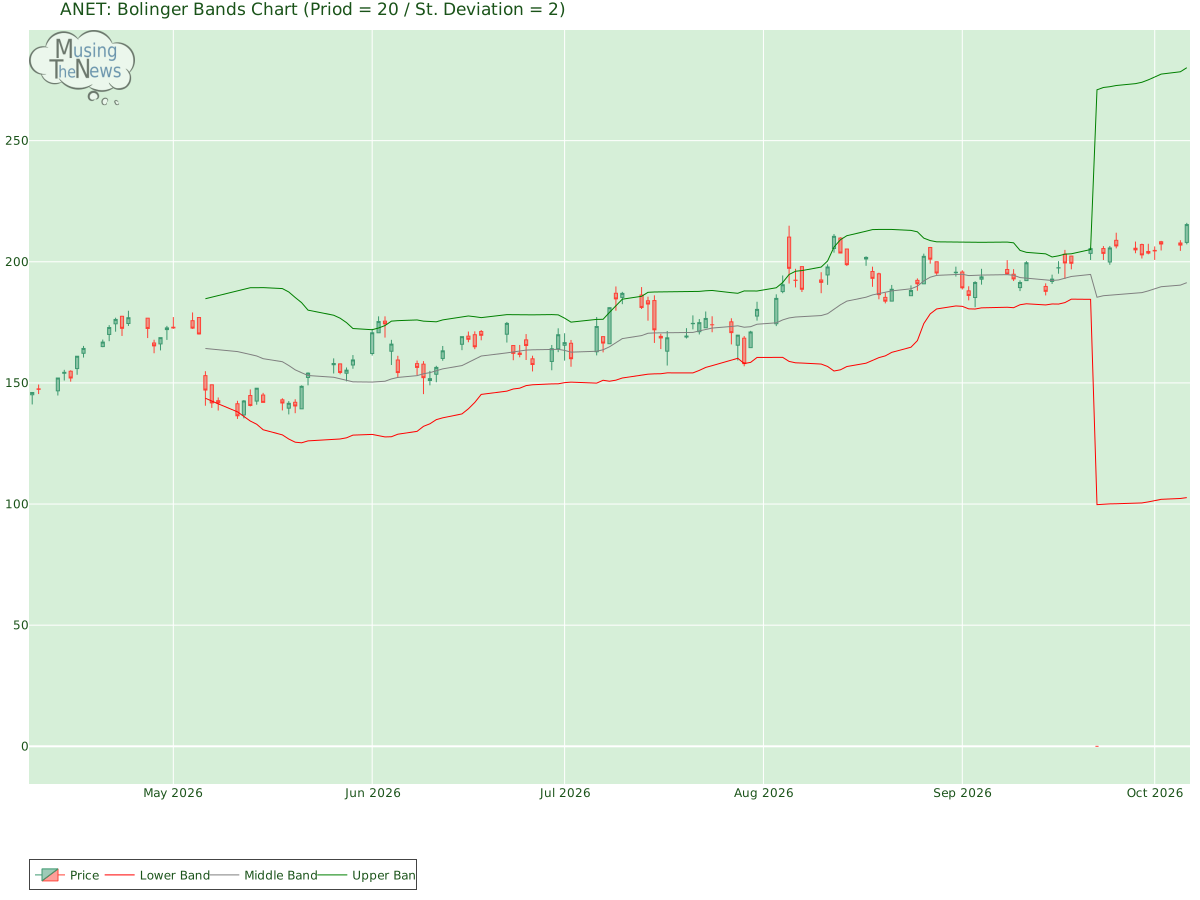
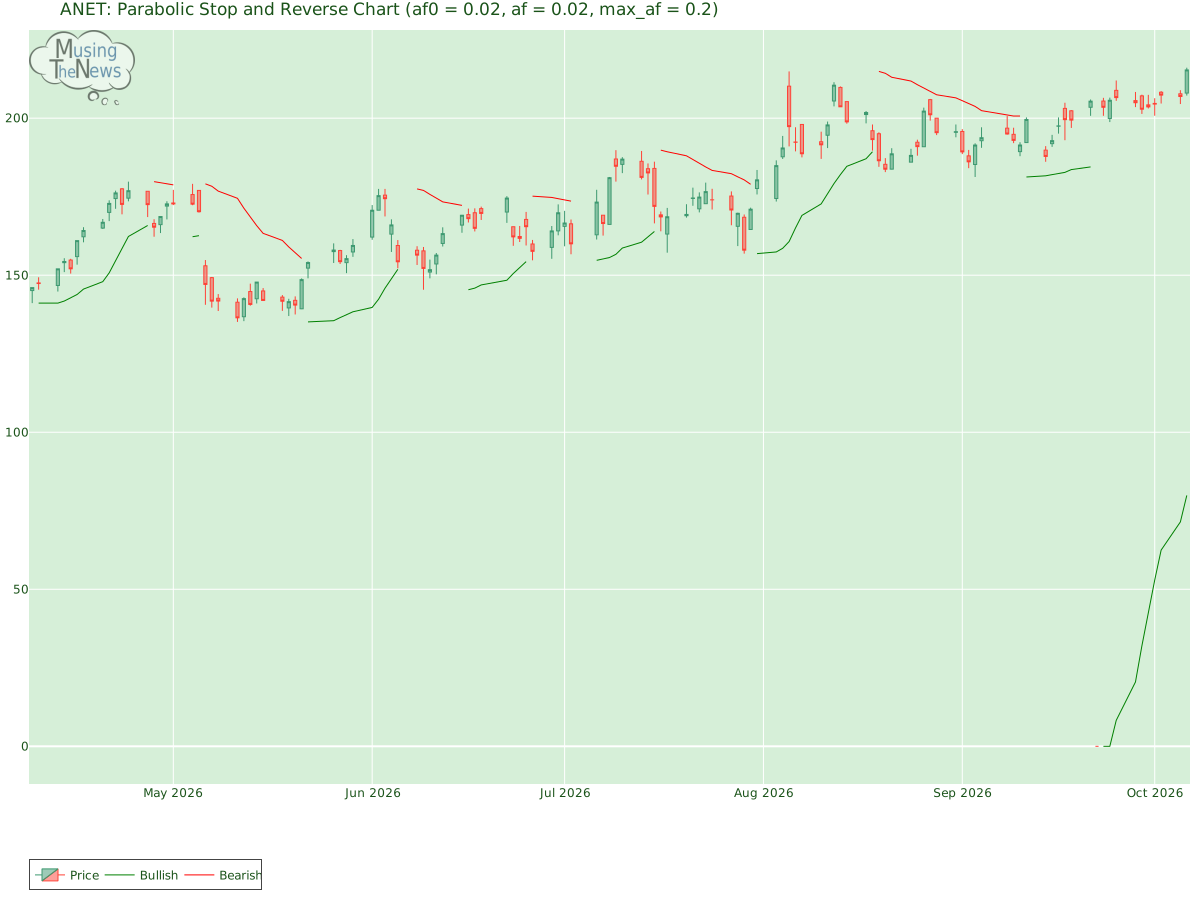
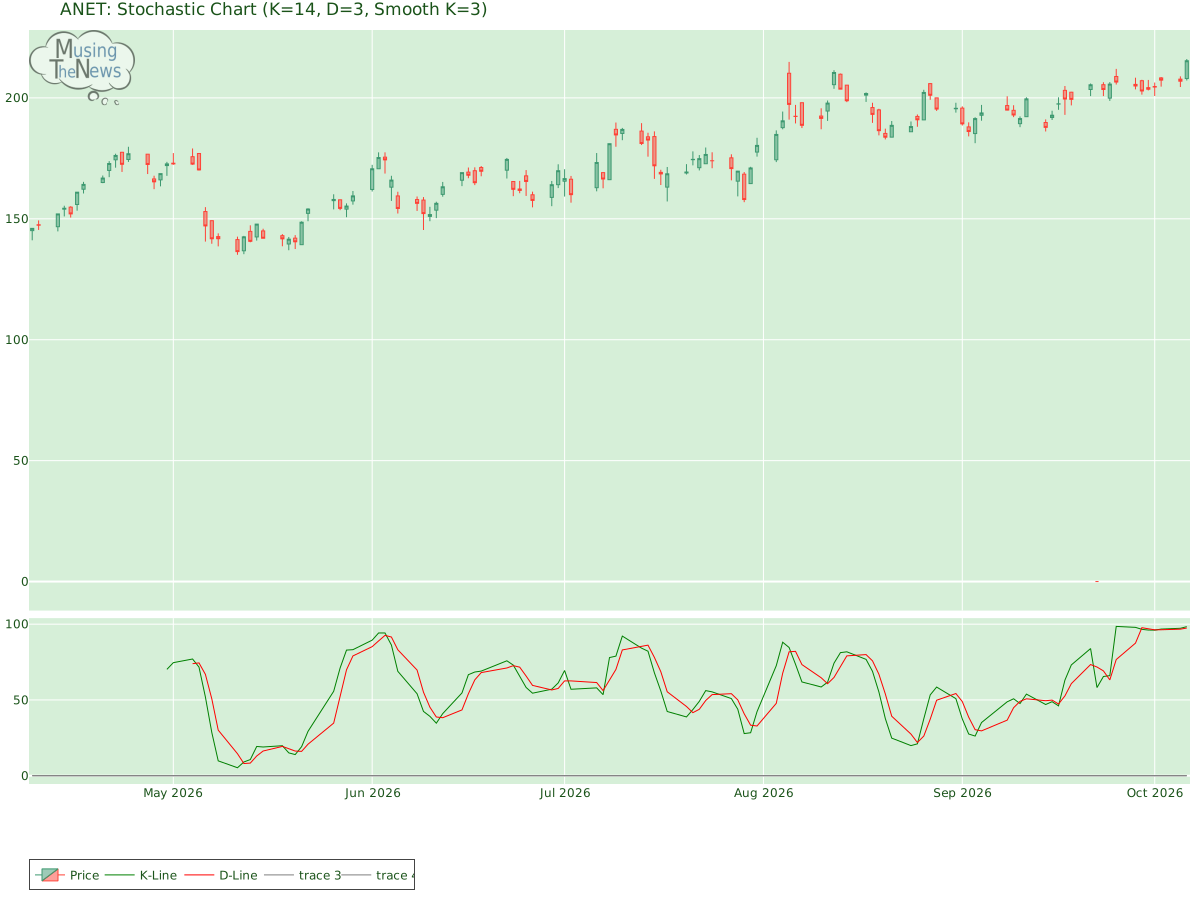
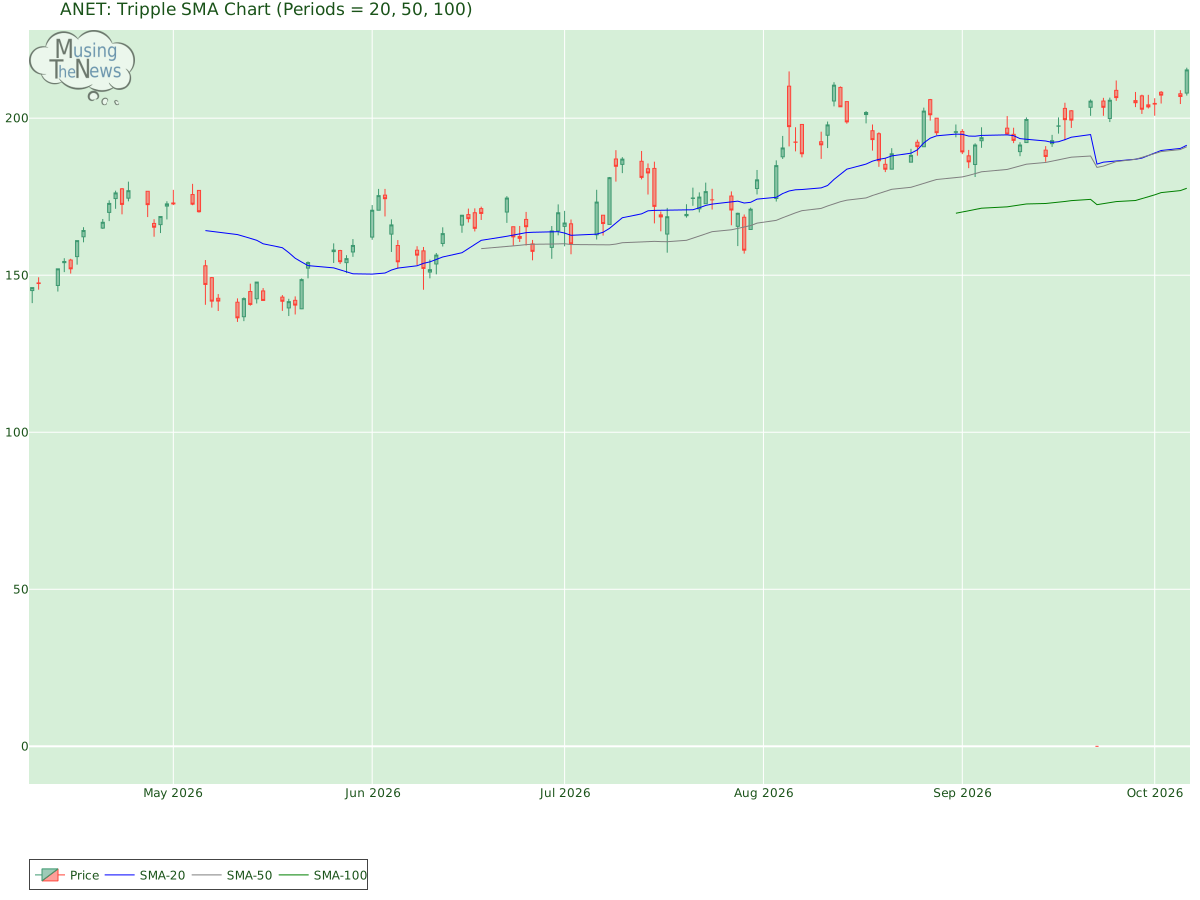
Aroon: Aroon's bullish trend continues, with Aroon Up at the 100 level, indicating sustained market strength for ANET. This trend warrants further exploration alongside other indicators to fully understand its implications and potential future direction.Aroon chart for Arista Networks, Inc.Bol. Bands: The BOLL BANDS is showing a neutral stance, with no definitive indication of an upward or downward trend for ANET. This neutral position suggests a period of indecision in the market, making it difficult to predict the next move.Bolinger Bands chart for Arista Networks, Inc.Parabolic SAR: The PSAR continues to indicate a bullish outlook, setting a crucial support level. This strong support could bolster the ongoing upward trend, suggesting that the market may remain in a positive trajectory. Investors may view this as a sign of sustained bullish momentum.Parabolic Stop and Reverse chart for Arista Networks, Inc.Stochastic: The stochastic indicator is in a bullish state, with the K-line crossing above both the D-line and the 80 mark. This alignment suggests strong upward momentum, implying that the market may continue its positive trajectory. Traders may see this as a sign of ongoing strength for Arista Networks, Inc..Stochastic chart for Arista Networks, Inc.Tripple Moving Agerage: The alignment of the 20, 50, and 100 moving averages suggests a bearish trend, but the wavering slopes of the 20 and 50 SMAs hint at a potential shift. This weakening of momentum could indicate that the bearish trend is running out of steam, possibly leading to a bullish reversal in the near future. Investors should be aware of the possibility of a market turnaround as the current downtrend weakens for Arista Networks, Inc..Tripple SMA chart for Arista Networks, Inc. A company's technical data, including stock price and trading volume, can provide valuable insights when considered alongside its fundamentals. These include financial performance, market share, and growth strategy, as well as broader industry dynamics. Examining these factors helps investors or analysts make more informed decisions, as the company's fundamentals offer context for understanding how and why certain technical patterns may emerge in the market.