More about Exxon Mobil Corporation
Regulatory Filings for Exxon Mobil Corporation
Fundamentals for Exxon Mobil Corporation

AI Learns to Read the Federal Reserve

AI Subscriptions Rewrite the Inflation Playbook

Diversification Shielded U.S. Banks

Repo, Debt and Risk: The Fed's Untold Warning for 2026
Technicals for Exxon Mobil Corporation



Price Summary
On 2026-08-20, Exxon Mobil Corporation's shares started at 167.02, peaked at 168.64, bottomed out at 166.07, and ended -0.52% lower at 166.15, with 13794800 shares traded.In the last 52 weeks, the stock's top price was 171.47 and the bottom price was 0.0.
Technicals
Support and Resistance: At 166.15, the price is supported by 158.81 and resisted by 171.47. This indicates that the price for Exxon Mobil Corporation might fluctuate between these levels, with 158.81 acting as a support and 171.47 limiting further upward movement.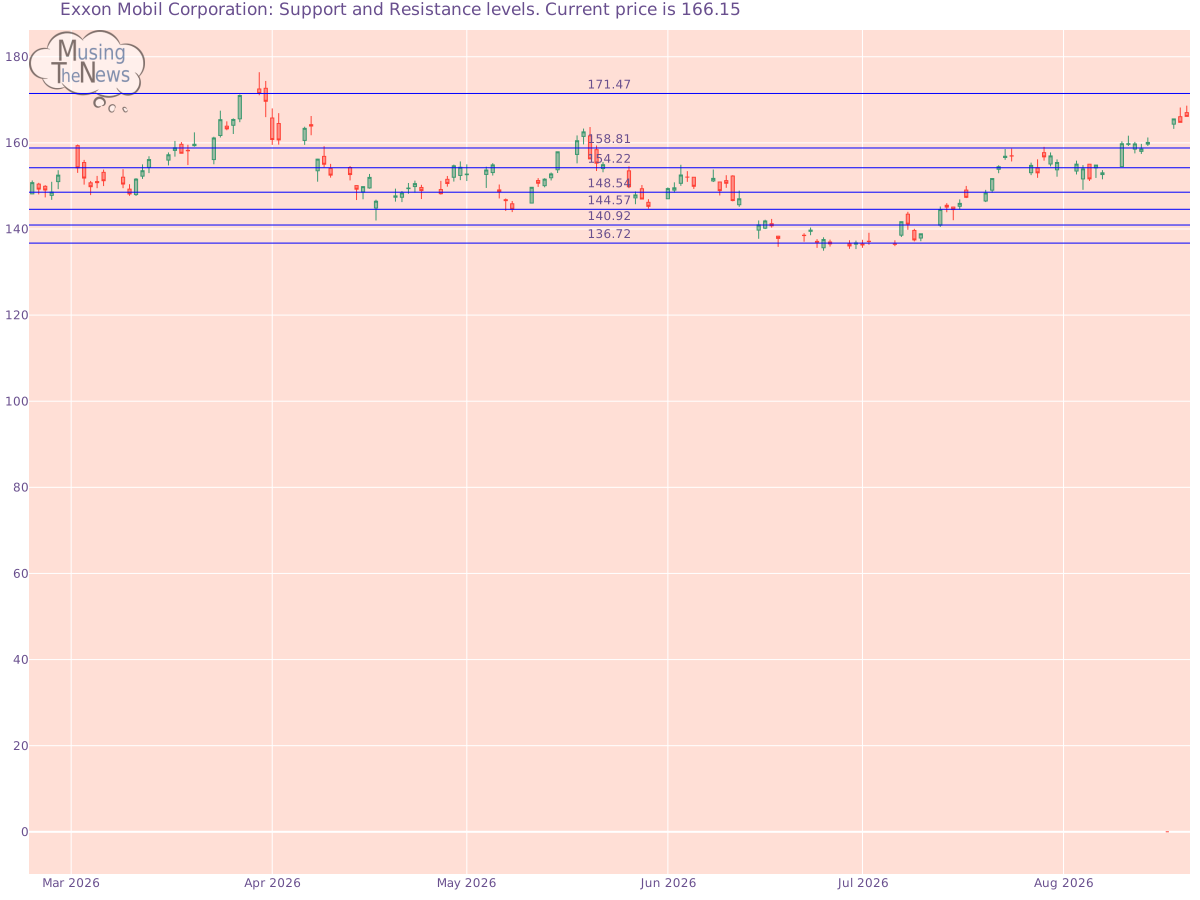
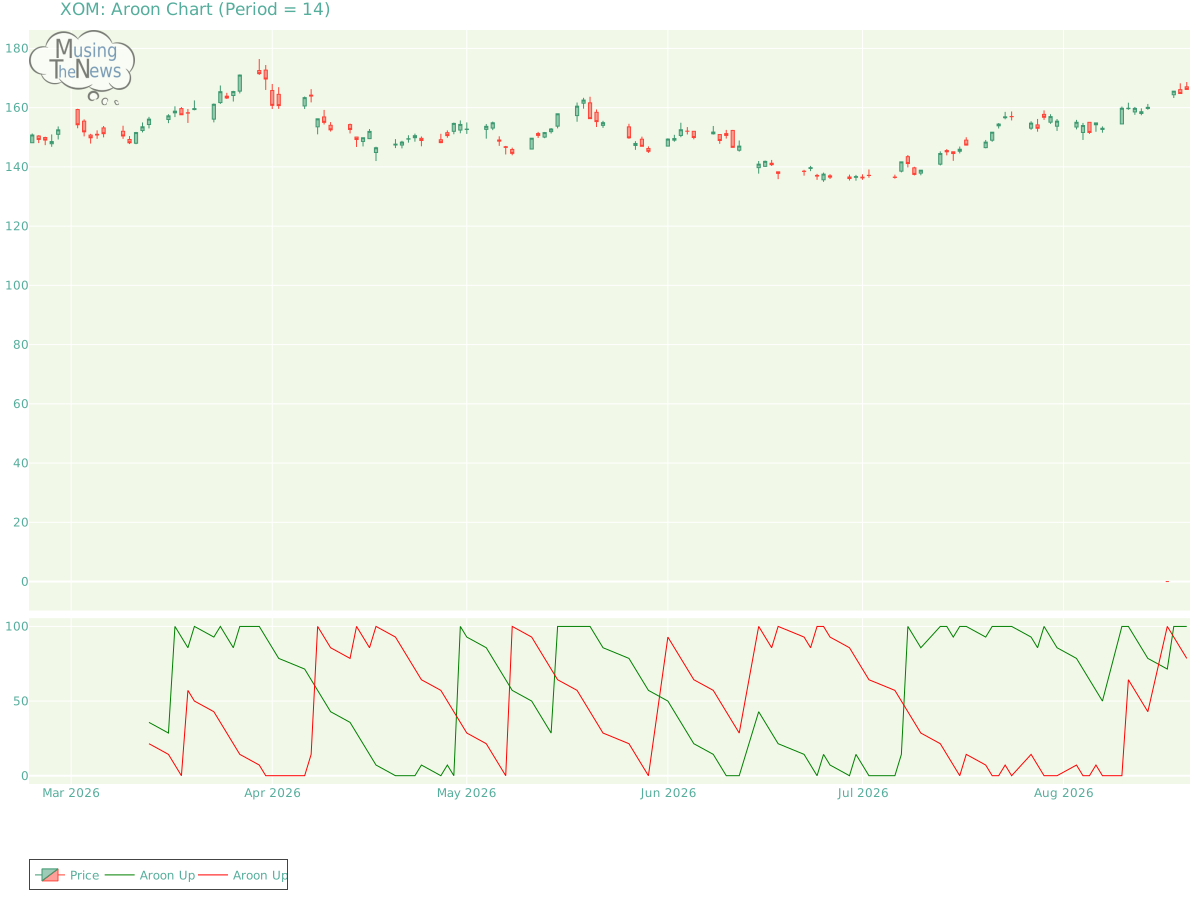
Aroon: The Aroon indicator shows a continued bullish trend, with Aroon Up staying at the 100 level. This sustained strength suggests a strong upward momentum. However, further analysis is required, especially when combined with other indicators, to confirm the trend's durability and potential future direction.
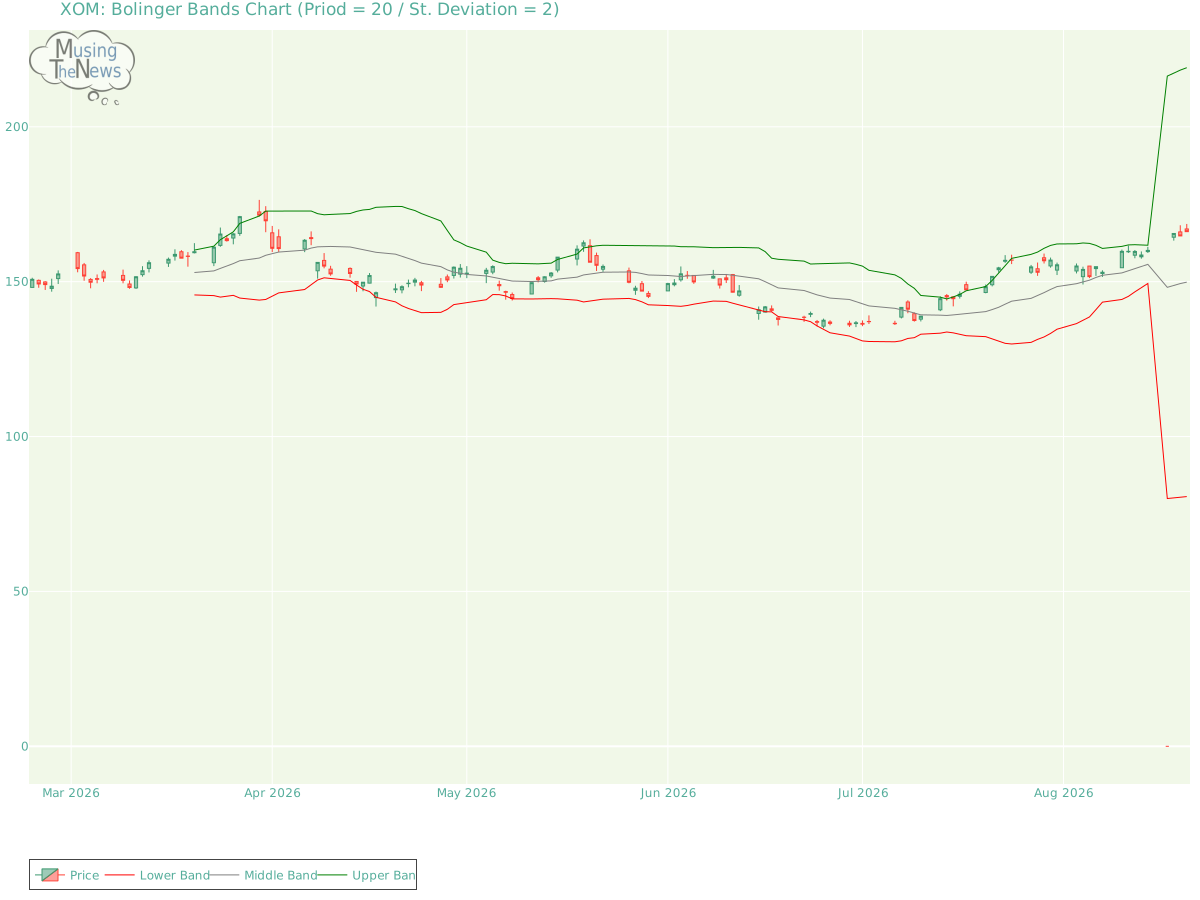
Bol. Bands: The BOLL BANDS is in a neutral stance, with no clear signals for movement up or down. This neutral position indicates a potential period of consolidation or uncertainty in the market.
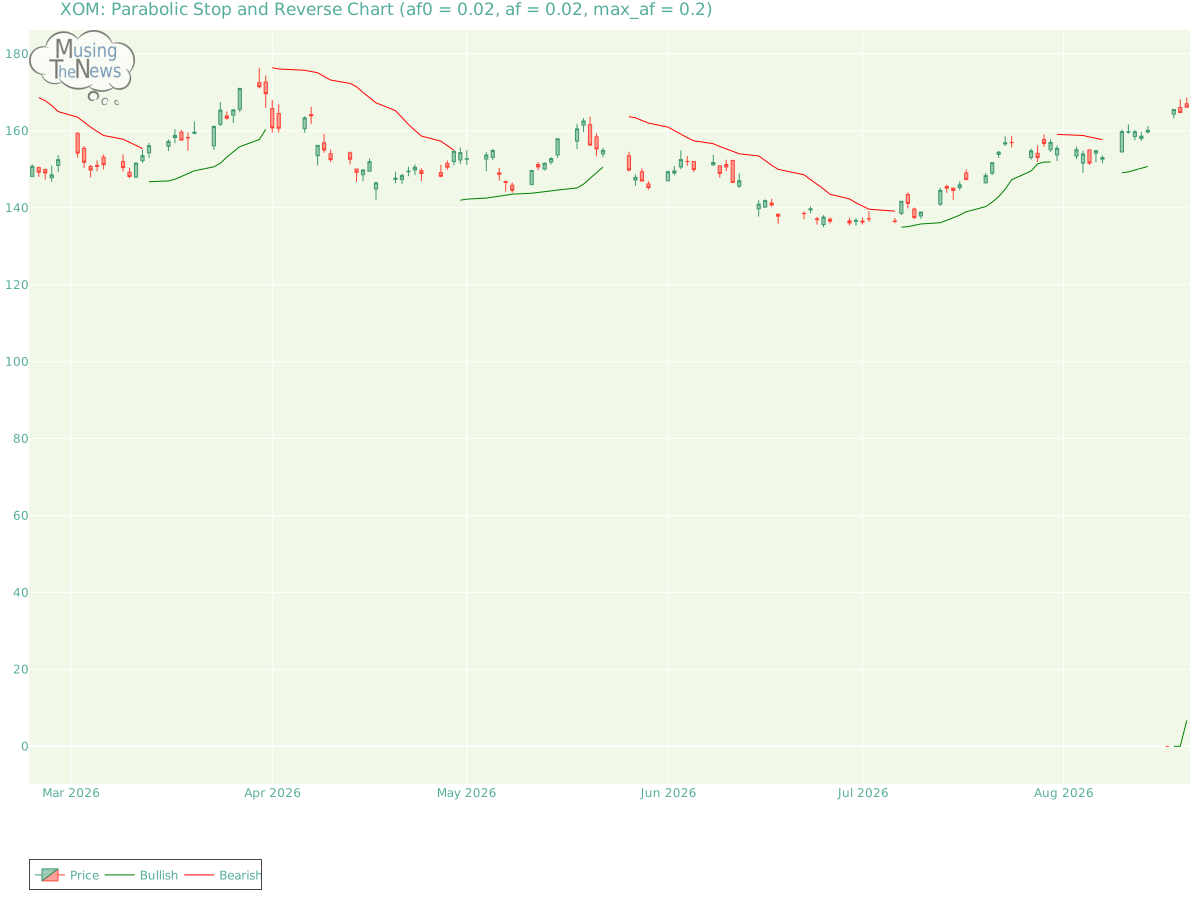
Parabolic SAR: The PSAR remains bullish, establishing a key support level that could help uphold the market's upward trajectory. This persistent bullish outlook suggests that the market may continue to rise, with the support providing a foundation for further gains.
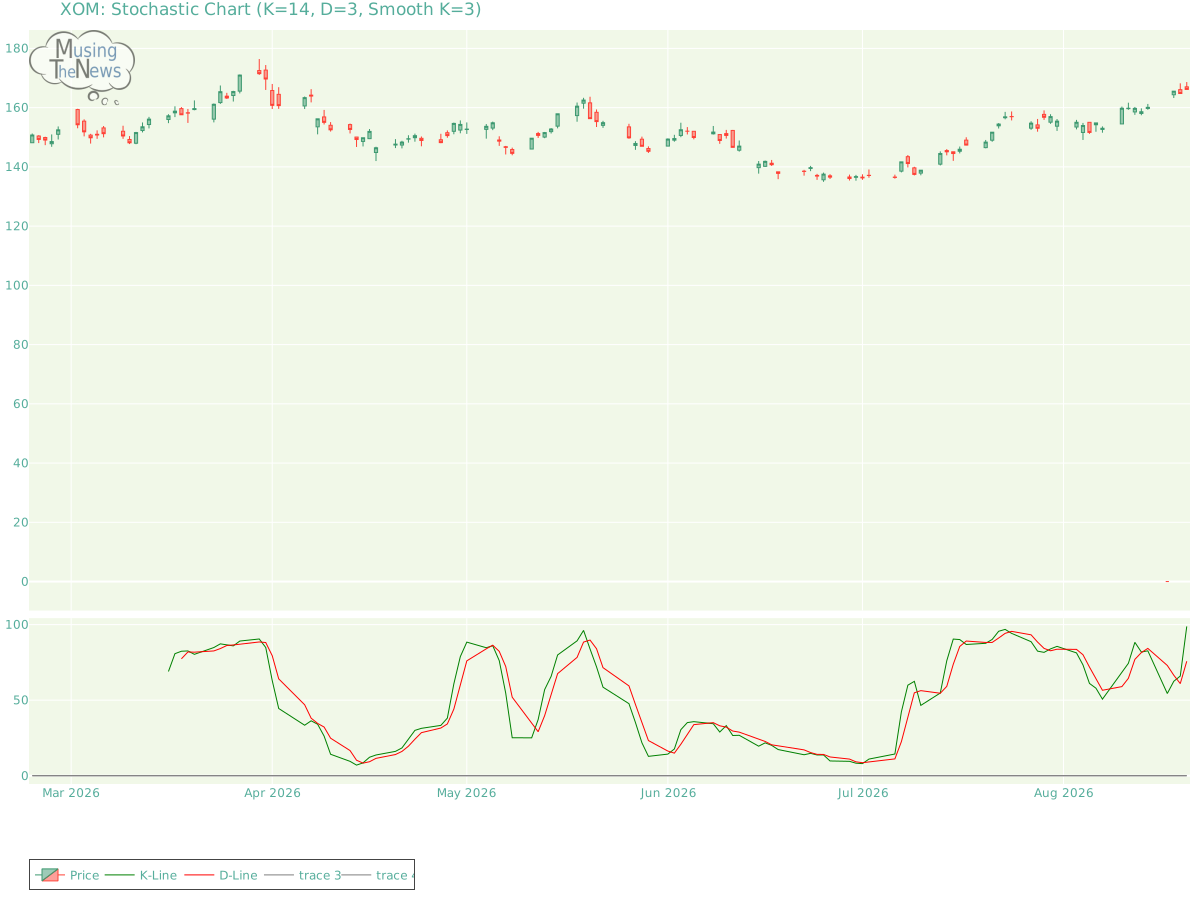
Stochastic: The stochastic indicator for Exxon Mobil Corporation reflects a bullish sentiment, as the K-line is above both the D-line and the 80 threshold. This setup points to strong upward momentum, implying that the market may continue to rise. Traders could consider this as an indication of sustained bullish activity.
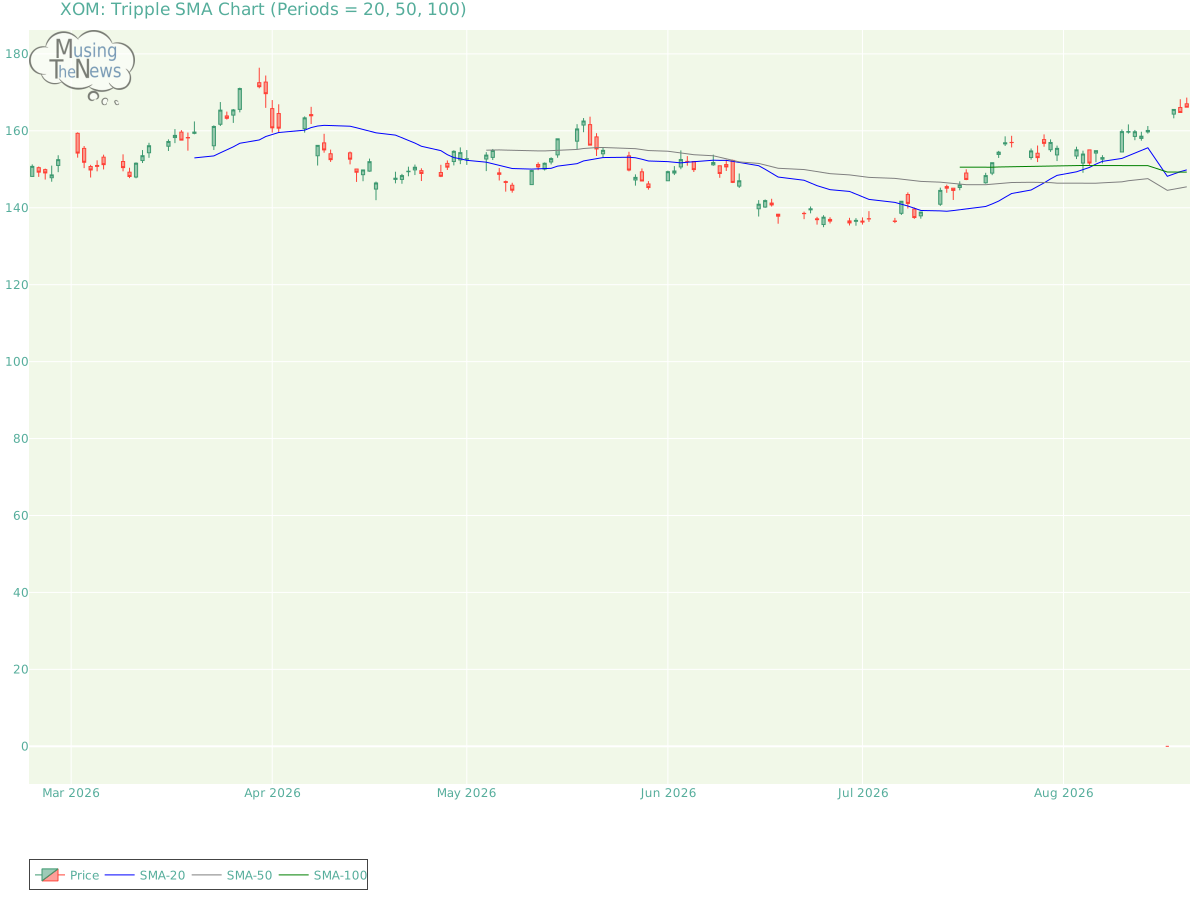
Tripple Moving Agerage: The Tripple MOVING AVG is showing a neutral stance, not indicating a clear upward or downward trend for Exxon Mobil Corporation. This suggests a period of market balance, where neither side is showing dominance.
In order to draw meaningful inferences from a company's technical data, it is essential to first consider its fundamentals. This includes reviewing financial metrics like revenue, profit margins, and debt-to-equity ratios. Additionally, understanding the broader industry landscape, including market trends and competitive pressures, is crucial. By integrating these insights with the company's technical performance, such as stock price fluctuations and trading volume, one can make more informed investment decisions.
If you have enjoyed reading, spread the word:
Good prospects:
Companies with the best and the worst technicals.
Latest Regulatory Filings for SP5
Companies with the best and the worst fundamentals.

When Losing Money Pays: America's Broken Market Logic

The Hidden Time Bomb in AI Finance
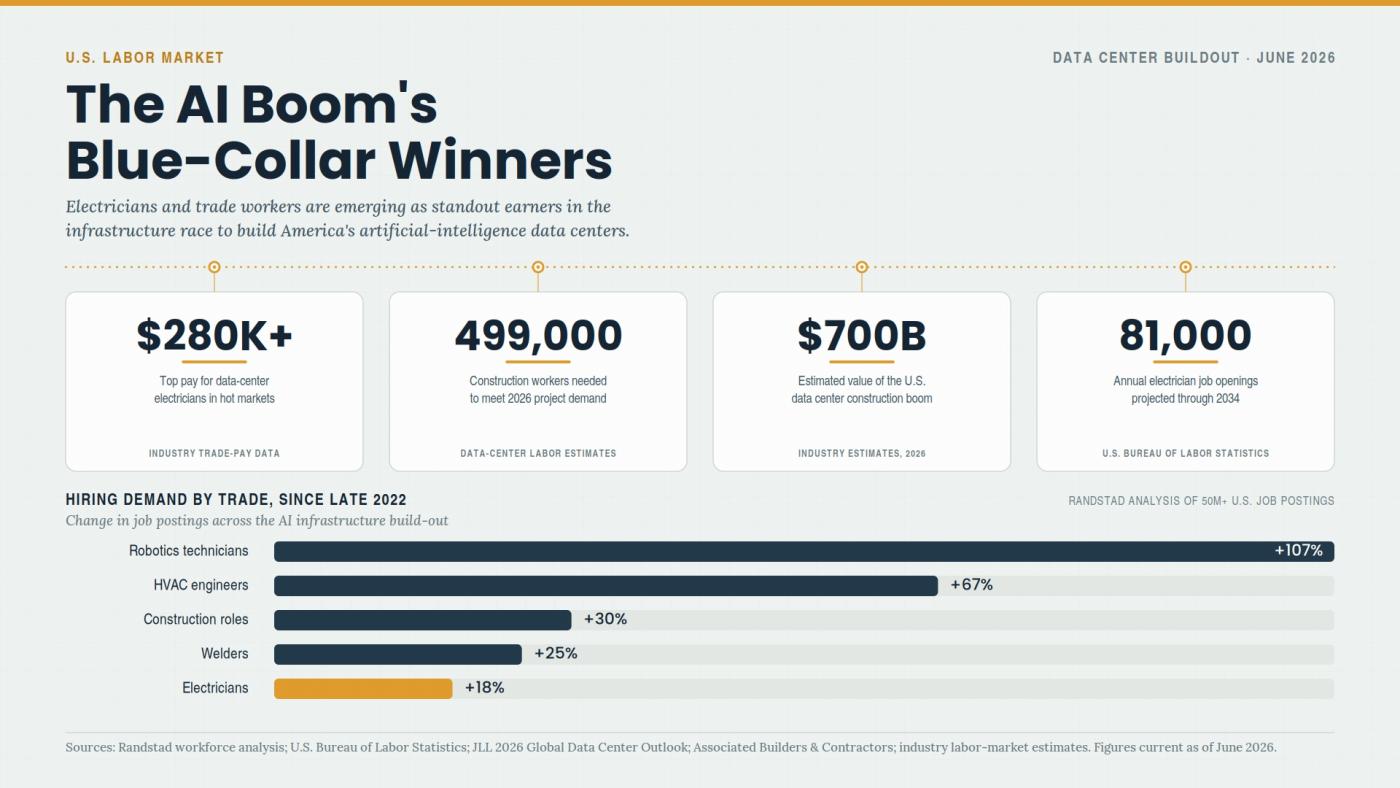
Why Electricians Now Out-Earn Software Engineers