More about Westinghouse Air Brake Technologies Corporation
Regulatory Filings for Westinghouse Air Brake Technologies Corporation
Fundamentals for Westinghouse Air Brake Technologies Corporation

Diversification Shielded U.S. Banks

Repo, Debt and Risk: The Fed's Untold Warning for 2026

When Losing Money Pays: America's Broken Market Logic

The Hidden Time Bomb in AI Finance
Technicals for Westinghouse Air Brake Technologies Corporation


Price Summary
Westinghouse Air Brake Technologies Corporation had a remarkable day at the stock market, and its shares surged 5.03%.2026-07-22, saw WAB's stock open at 276.11, hit a peak of 295.41, fall to a low of 271.44, and close up 5.03% at 290.0, with 3262143 shares changing hands.
The stock's highest value over the last 52 weeks is 290.0, and the lowest value is 185.65.
Technicals
Aroon: The AROON indicator suggests a significant bullish trend, with the Aroon Up moving higher and the Aroon Oscillator reversing. This indicates a potential reversal to an upward trend, suggesting that the market may be gaining momentum. Investors could view this as a signal of potential opportunities, with the market trend favoring a bullish outlook.

Bol. Bands: The latest price movement has seen the current price for WAB cross above the upper Bollinger Band, indicating a bullish trend. This breakout suggests that buying pressure is pushing prices higher, potentially leading to further gains. Such a move is often seen as a sign of strengthening market momentum.

Parabolic SAR: The PSAR for WAB has recently shifted from a bearish to a bullish direction, indicating a potential trend reversal. When combined with other indicators, this change could signal a strong bullish trend, provided it is supported by a broader market trend. Investors should consider this a positive development, especially if other indicators align with this shift.

Stochastic: The STOCHASTIC is currently neutral, showing no clear bias toward an upward or downward trend. This suggests that the market may be in a phase of indecision or consolidation.

Tripple Moving Agerage: The Tripple MOVING AVG is currently in a neutral position, offering no clear indication of movement up or down. This suggests that the market may be experiencing a period of equilibrium, with no strong trend in play.

To properly assess the technical data of a company, it's important to first look at its fundamentals, such as its earnings, growth potential, and management effectiveness. Equally, understanding the industry trends, competition, and external economic factors that influence the company is vital. This holistic view helps draw meaningful conclusions about the company's technical performance, allowing investors to better gauge its stock price behavior, volatility, and market trends.
If you have enjoyed reading, spread the word:
Good prospects:
Companies with the best and the worst technicals.
Latest Regulatory Filings for SP5
Companies with the best and the worst fundamentals.
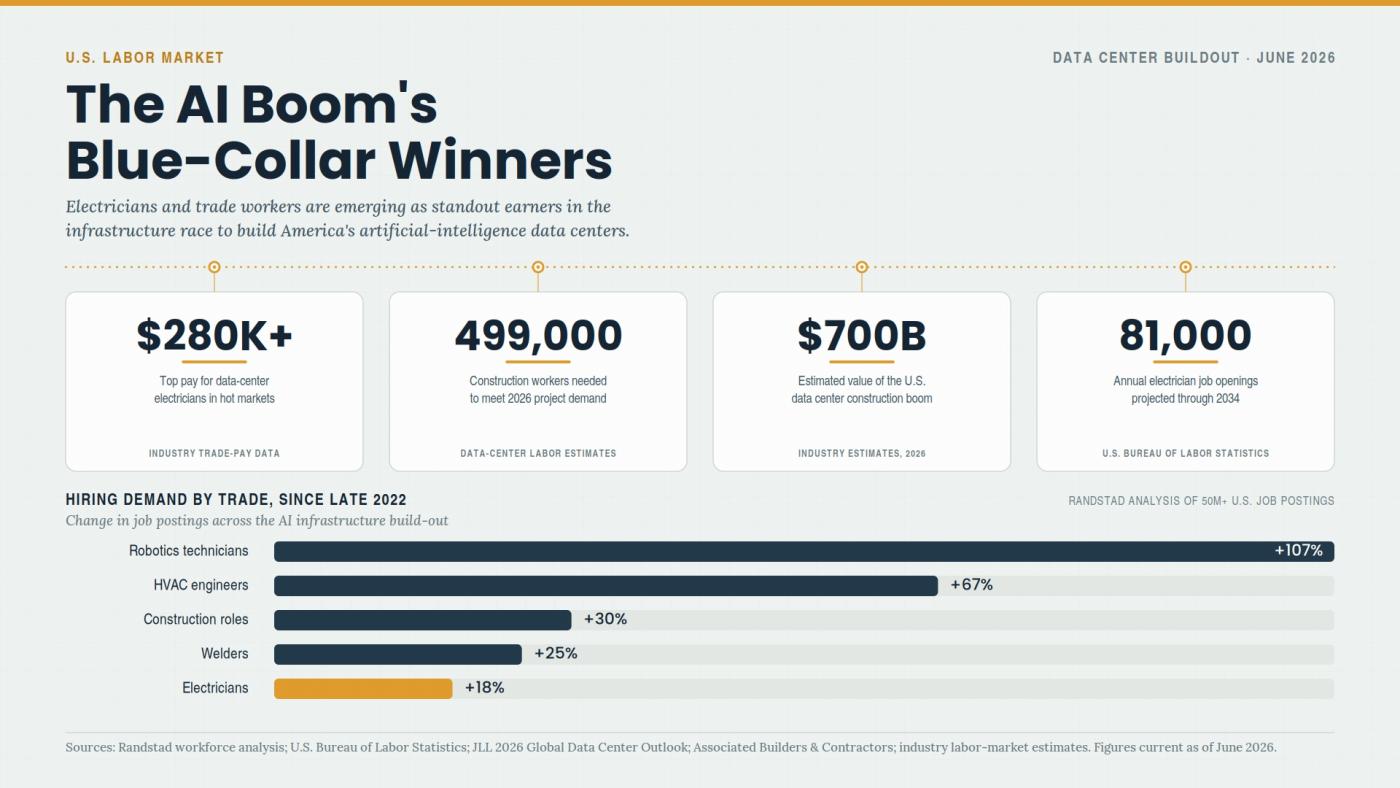
Why Electricians Now Out-Earn Software Engineers
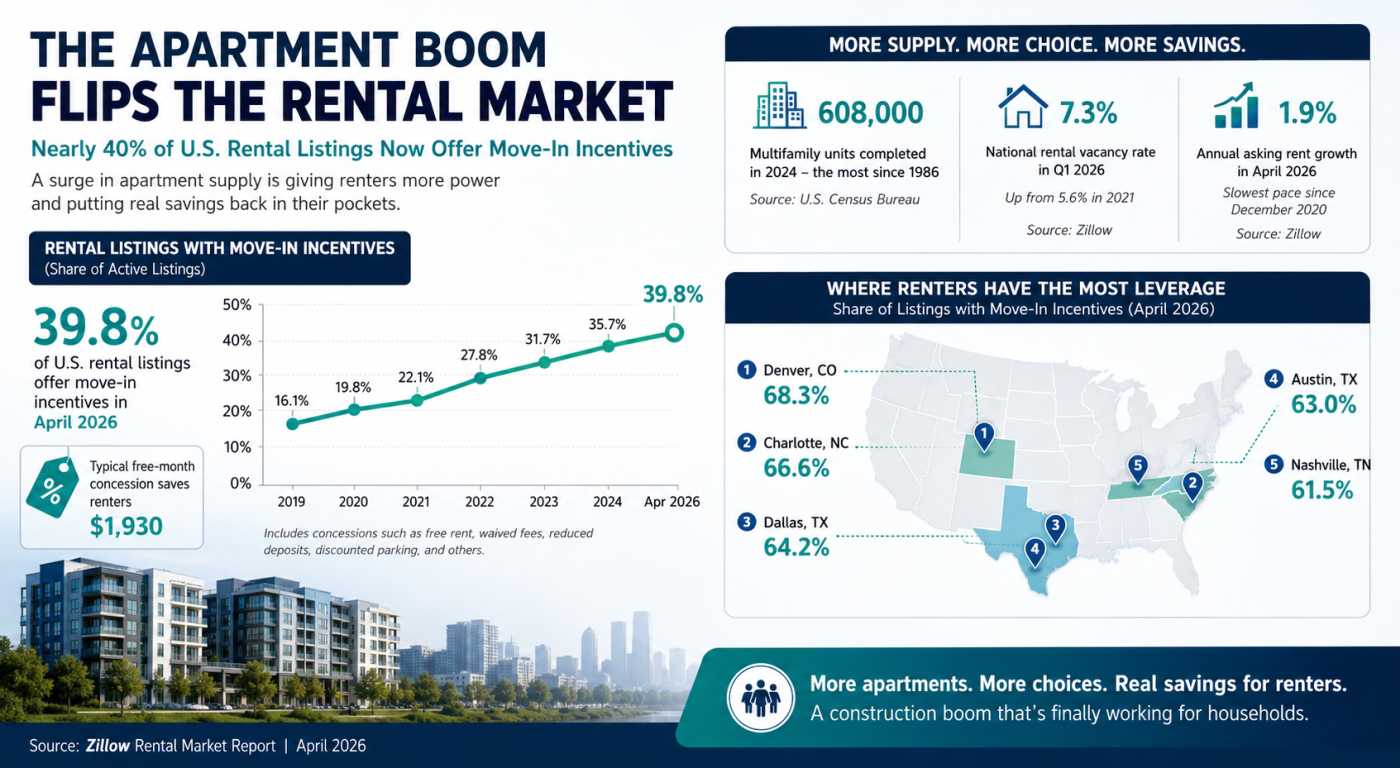
The Apartment Glut Changing America’s Rental Market

Why Community Colleges Are Winning Again
