More about Uber Technologies, Inc.
Regulatory Filings for Uber Technologies, Inc.
Fundamentals for Uber Technologies, Inc.

Diversification Shielded U.S. Banks

Repo, Debt and Risk: The Fed's Untold Warning for 2026

When Losing Money Pays: America's Broken Market Logic

The Hidden Time Bomb in AI Finance
Technicals for Uber Technologies, Inc.



Price Summary
On 2026-07-22, UBER's stock began at 71.47, peaked at 71.47, dipped to 69.96, and closed up -1.6% at 70.33, with a volume of 12077262 shares.For the 52-week period, the stock's highest price is 100.1, and the lowest price is 68.61.
Technicals
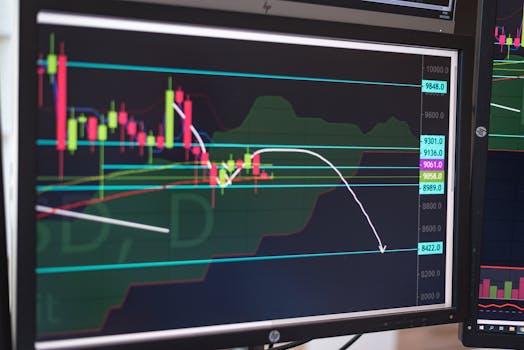
Support and Resistance: The current price is 70.33, with support at 69.99 and resistance at 73.86. This range suggests that the price might move between these levels, with 69.99 offering support and 73.86 capping further gains for Uber Technologies, Inc..
Aroon: The continuation of Aroon's bearish trend, with Aroon Down at the 100 level, indicates sustained bearish pressure. However, this trend should be analyzed further alongside other indicators to better understand its long-term implications.

Bol. Bands: The current price has crossed below the lower Bollinger Band, indicating that the market may be oversold. This move suggests that selling pressure has been strong enough to push prices below a key support level. While this breach could mean the bearish trend will persist, it might also signal a potential reversal if the market begins to attract buying interest at these lower prices.

Parabolic SAR: The PSAR maintains a bearish stance, establishing a resistance level that could act as a barrier to any upward trends. This ongoing bearish outlook suggests that the market may continue to face resistance, keeping prices in check.

Stochastic: The Stochastic K-line is positioned below the D-line and sits under 20, suggesting a mildly bearish scenario. This setup indicates that the market might face some downside pressure, though the bearish signal is not particularly strong. Investors should consider this as a cautious indicator and monitor for further developments.

Tripple Moving Agerage: The Tripple MOVING AVG is currently neutral, offering no clear guidance on market direction. This suggests that the market may be in a state of pause, with no strong trend emerging.

The technical analysis of a company's stock performance is valuable, but only when considered in conjunction with the company's fundamentals. These fundamentals, including financial strength, earnings growth, and leadership, provide a foundation for understanding market movements. Additionally, industry trends and competitive pressures play an important role. By integrating both fundamental and technical analysis, one can better evaluate the company's true potential and make more informed investment decisions.
If you have enjoyed reading, spread the word:
Good prospects:
Companies with the best and the worst technicals.
Latest Regulatory Filings for SP5
Companies with the best and the worst fundamentals.
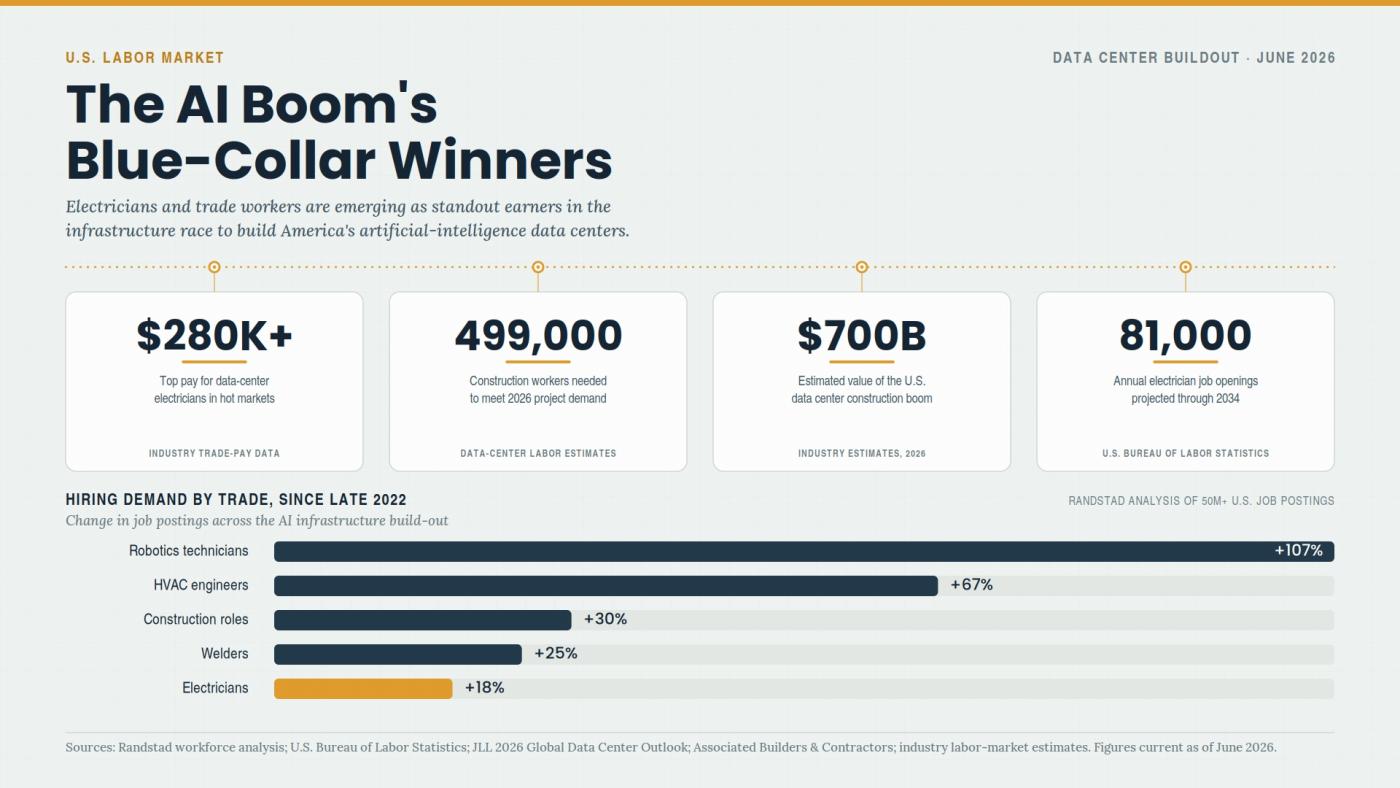
Why Electricians Now Out-Earn Software Engineers
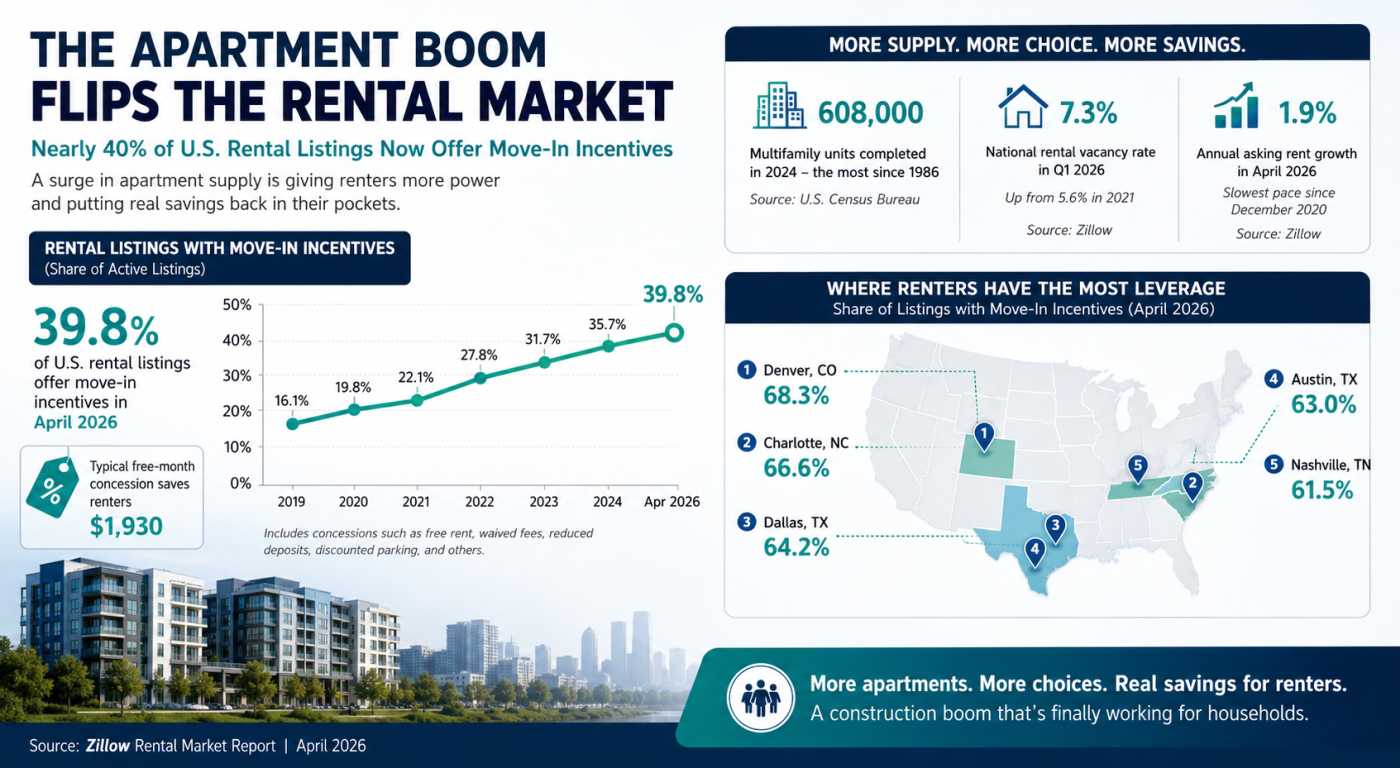
The Apartment Glut Changing America’s Rental Market
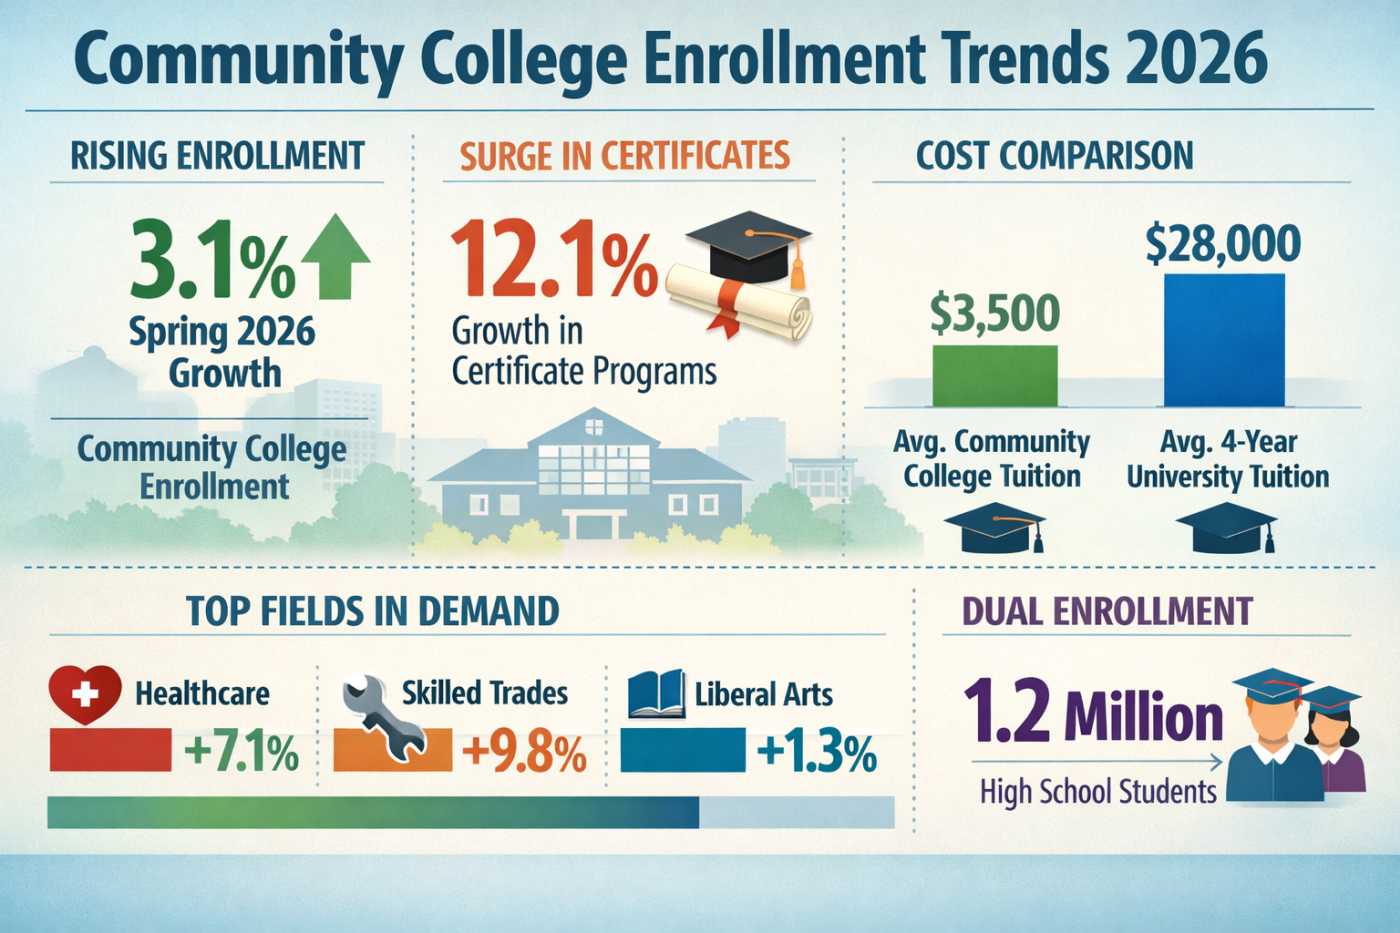
Why Community Colleges Are Winning Again