
Diversification Shielded U.S. Banks

Repo, Debt and Risk: The Fed's Untold Warning for 2026

When Losing Money Pays: America's Broken Market Logic

The Hidden Time Bomb in AI Finance
Technicals for AT&T Inc.


Price Summary
On 2026-07-21, T's stock began at 21.93, peaked at 22.39, dipped to 21.7, and closed up 1.5% at 22.26, with a volume of 130272208 shares.The peak price for the stock in the past 52 weeks is 29.62, with the lowest price being 20.48.
Technicals
Support and Resistance: At 22.26, the price is held up by support at 22.01 and faces resistance at 22.71 for T. This suggests a trading range where 22.01 provides a base and 22.71 limits upward movement.
Aroon: The current state of the AROON is neutral for T, providing no clear indication of a trend in either direction. This suggests that the market may be lacking momentum, making it difficult to predict future movements.

Bol. Bands: The BOLL BANDS is in a neutral stance, with no clear signals for movement up or down. This neutral position indicates a potential period of consolidation or uncertainty in the market.

Parabolic SAR: The PSAR for T maintains its bullish outlook, setting a strong support level that could underpin further gains. This suggests that the market is likely to continue its upward trajectory, with the established support providing a safety net for ongoing bullish momentum.

Stochastic: The current reading of the STOCHASTIC indicator suggests a neutral stance, with no clear signals indicating an upward or downward direction. This lack of directional bias suggests the market may be in a period of consolidation or uncertainty.

Tripple Moving Agerage: A bullish trend is reflected in the alignment of the 20-50-100 period moving averages, though the slopes of the faster averages hint at a possible reversal. This weakening momentum suggests that while the overall trend is still upward, traders should be cautious of a potential shift in the near future.

When analyzing a company, its fundamentals—such as earnings, management efficiency, and strategic initiatives—must be considered alongside technical data. The context of the industry in which the company operates also plays a key role, as market trends and competitive dynamics can significantly impact performance. By taking a comprehensive approach, combining both fundamental and technical analysis, one can gain a deeper understanding of the company's potential for growth or risk.
If you have enjoyed reading, spread the word:
Good prospects:
Companies with the best and the worst technicals.
Latest Regulatory Filings for SP5
Companies with the best and the worst fundamentals.
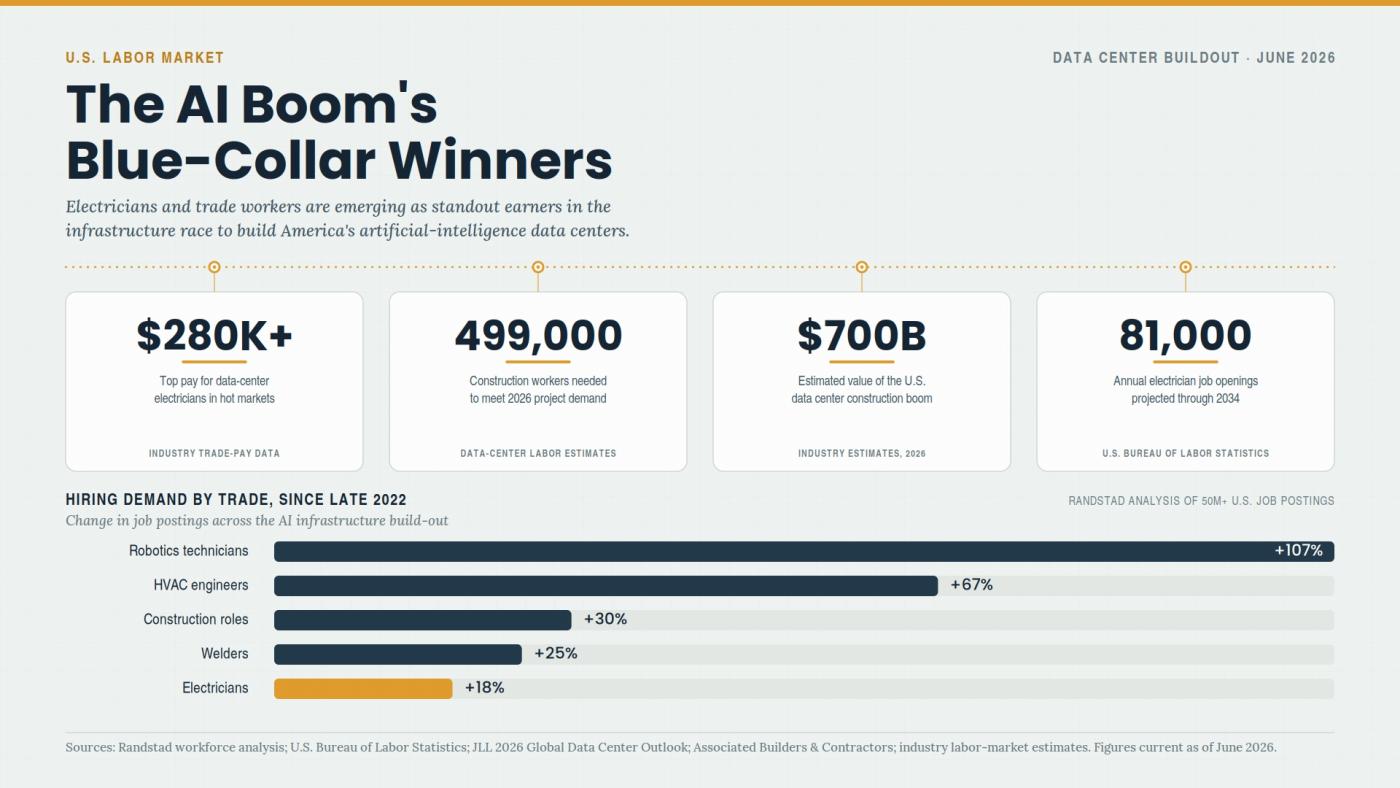
Why Electricians Now Out-Earn Software Engineers
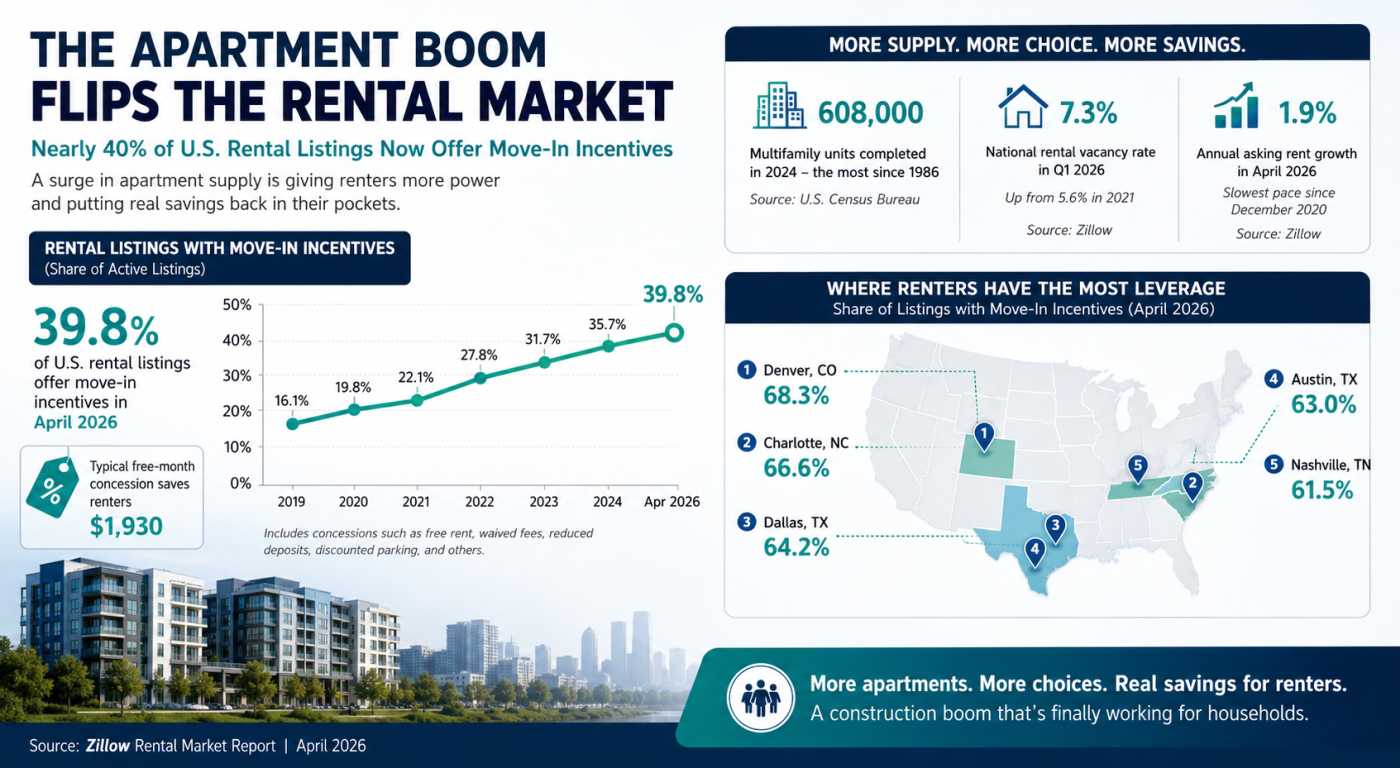
The Apartment Glut Changing America’s Rental Market

Why Community Colleges Are Winning Again
