More about TE Connectivity plc
Regulatory Filings for TE Connectivity plc
Fundamentals for TE Connectivity plc

Diversification Shielded U.S. Banks

Repo, Debt and Risk: The Fed's Untold Warning for 2026

When Losing Money Pays: America's Broken Market Logic

The Hidden Time Bomb in AI Finance
Technicals for TE Connectivity plc


Price Summary
On 2026-07-22, TE Connectivity plc's stock opened at 199.33, peaked at 200.9, hit a low of 190.27, and closed 0.48% higher at 200.28, with 7772479 shares changing hands.The peak price for the stock in the past 52 weeks is 249.0, with the lowest price being 195.84.
Technicals
Support and Resistance: At 200.28, the price is supported by 197.84 and resisted by 208.69. This indicates that the price for TE Connectivity plc might fluctuate between these levels, with 197.84 acting as a support and 208.69 limiting further upward movement.
Aroon: AROON is currently indicating a strong bearish trend, with Aroon Down moving higher and the Aroon Oscillator remaining low. This combination suggests that the downward price trend is likely to persist. The continued low level of the Aroon Oscillator points to ongoing bearish momentum.

Bol. Bands: The BOLL BANDS is currently neutral, showing no clear bias toward a rising or falling trend. This lack of directional clarity suggests that the market may be in a holding pattern, awaiting further developments.

Parabolic SAR: The PSAR has recently moved from bullish to bearish, indicating a possible market decline. If this reversal aligns with other market trends, it could be a very bearish signal for TEL. Investors should be vigilant and look for additional confirmation before making decisions.

Stochastic: The current state of the STOCHASTIC is neutral for TEL, providing no clear indication of a trend in either direction. This suggests that the market may be lacking momentum, making it difficult to predict future movements.

Tripple Moving Agerage: A bullish trend is signaled by the alignment of the 20-50-100 period moving averages, but the slopes of the faster averages suggest a potential reversal. The weakening momentum in the shorter-term averages hints that the current upward trend might be nearing its end, signaling the possibility of a shift in direction.

When evaluating a company's technical data, such as stock price charts or volume, it is essential to first consider its fundamentals. These fundamentals include financial stability, growth potential, and competitive advantages. Additionally, understanding the broader industry in which the company operates offers context that helps to make sense of technical patterns. By examining both the company's internal strengths and external environment, one can make more accurate and meaningful conclusions about its stock performance.
If you have enjoyed reading, spread the word:
Good prospects:
Companies with the best and the worst technicals.
Latest Regulatory Filings for SP5
Companies with the best and the worst fundamentals.
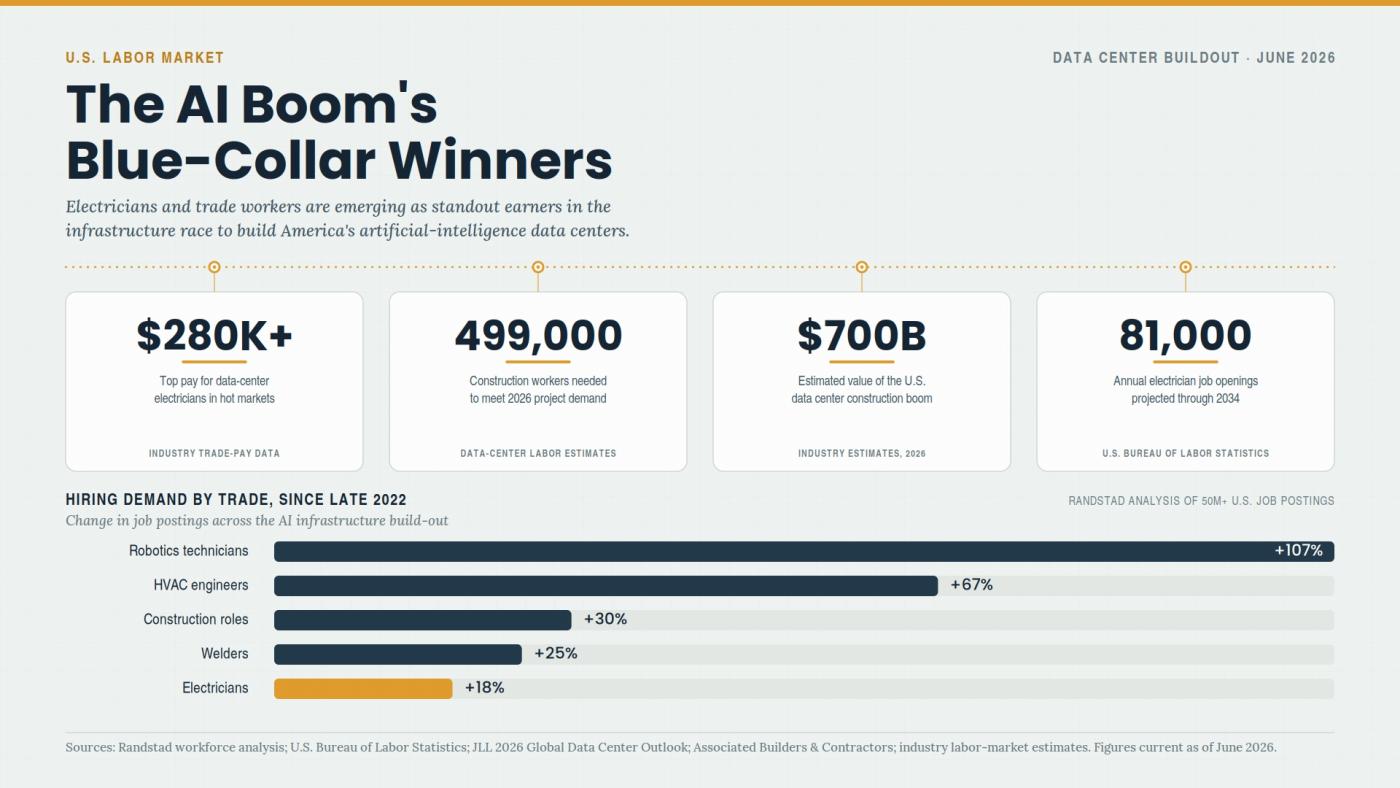
Why Electricians Now Out-Earn Software Engineers
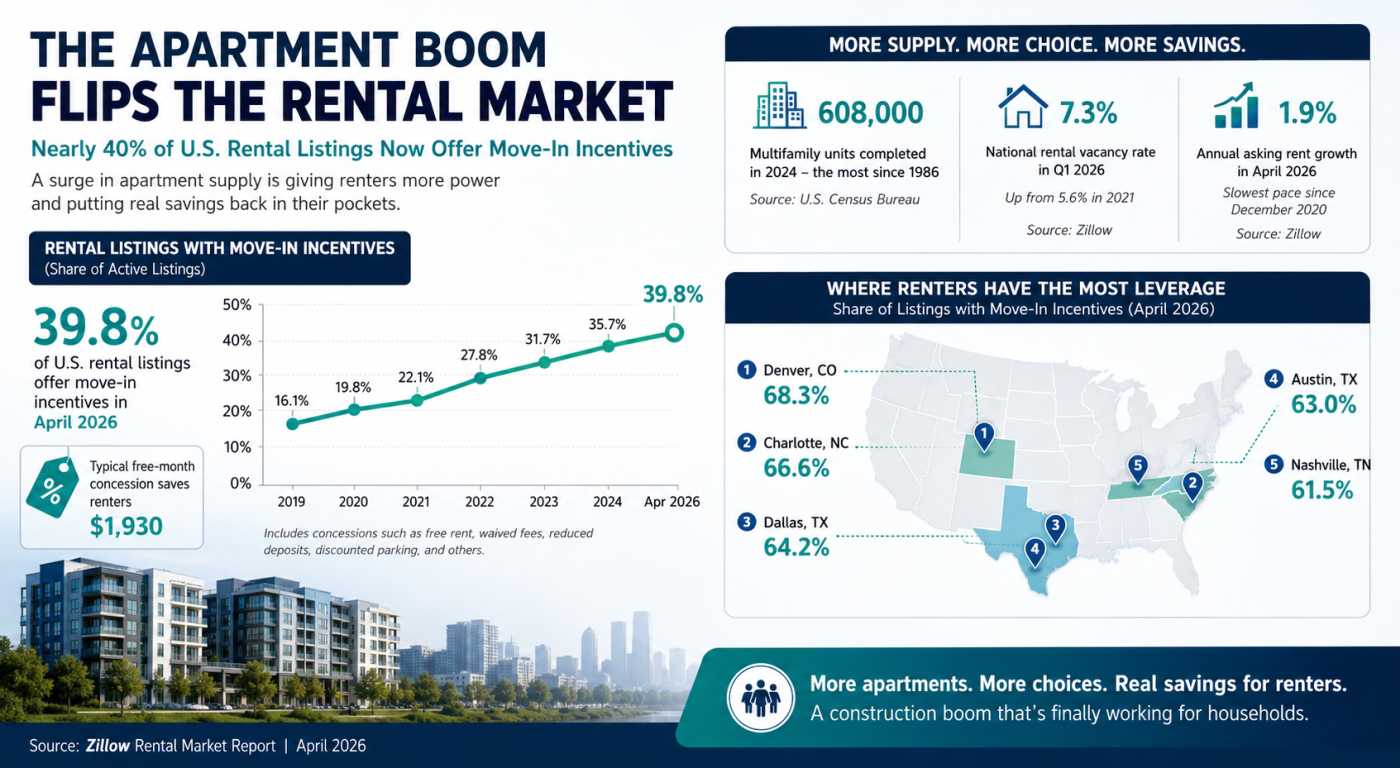
The Apartment Glut Changing America’s Rental Market

Why Community Colleges Are Winning Again
