More about Teledyne Technologies Incorporated
Regulatory Filings for Teledyne Technologies Incorporated
Fundamentals for Teledyne Technologies Incorporated

Diversification Shielded U.S. Banks

Repo, Debt and Risk: The Fed's Untold Warning for 2026

When Losing Money Pays: America's Broken Market Logic

The Hidden Time Bomb in AI Finance
Technicals for Teledyne Technologies Incorporated


Price Summary
On 2026-07-22, Teledyne Technologies Incorporated's stock opened at 653.5, spiked to 672.0, declined to 620.95, and closed -0.46% down at 650.5, with 1034881 shares traded.The stock's highest price over the 52-week span is 688.59, while the lowest price is 484.47.
Technicals
Support and Resistance: The price sits at 650.5, supported by 647.56 and resisted by 677.38. This indicates a trading range where 647.56 provides a floor, preventing declines, and 677.38 acts as a ceiling, limiting further price increases for TDY.
Aroon: The AROON is in a neutral stance, not pointing to a clear trend in either direction. This suggests that the market may be lacking strong momentum, making it difficult to predict the next move.

Bol. Bands: The current reading of the BOLL BANDS is neutral for TDY, with no clear signals for an upward or downward trend. This indicates that the market may be in a state of uncertainty, with no dominant force driving the direction.

Parabolic SAR: The PSAR continues to indicate a bullish outlook, establishing a key support level that could sustain the market's upward trend. This support suggests that the bullish momentum is likely to persist, offering a foundation for further growth.

Stochastic: The STOCHASTIC is currently neutral, offering no clear guidance on market direction. This suggests that the market may be in a state of pause, with no strong trend emerging.

Tripple Moving Agerage: The Tripple MOVING AVG is in a neutral stance, not pointing to a clear trend in either direction. This suggests that the market may be lacking strong momentum, making it difficult to predict the next move.

In order to draw meaningful inferences from a company's technical data, it is essential to first consider its fundamentals. This includes reviewing financial metrics like revenue, profit margins, and debt-to-equity ratios. Additionally, understanding the broader industry landscape, including market trends and competitive pressures, is crucial. By integrating these insights with the company's technical performance, such as stock price fluctuations and trading volume, one can make more informed investment decisions.
If you have enjoyed reading, spread the word:
Good prospects:
Companies with the best and the worst technicals.
Latest Regulatory Filings for SP5
Companies with the best and the worst fundamentals.
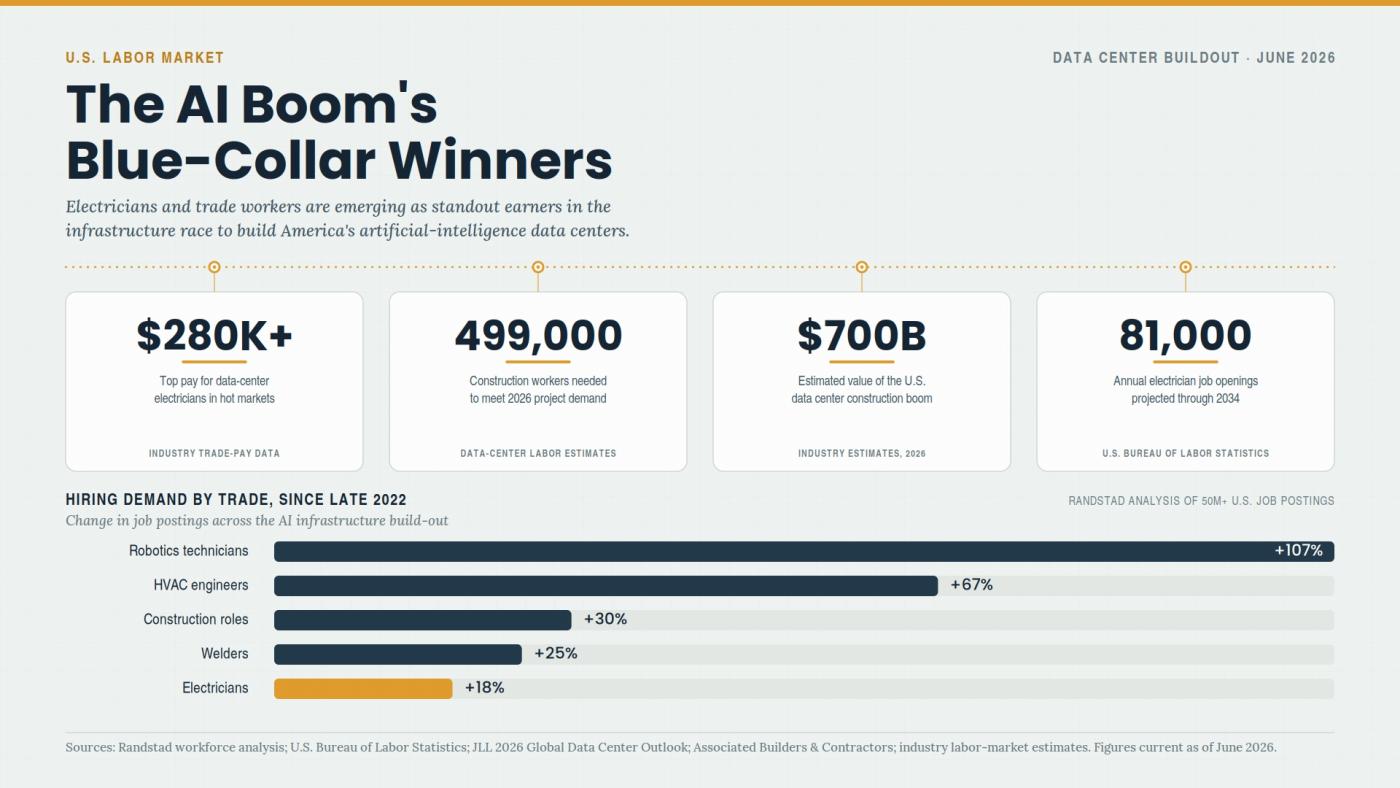
Why Electricians Now Out-Earn Software Engineers
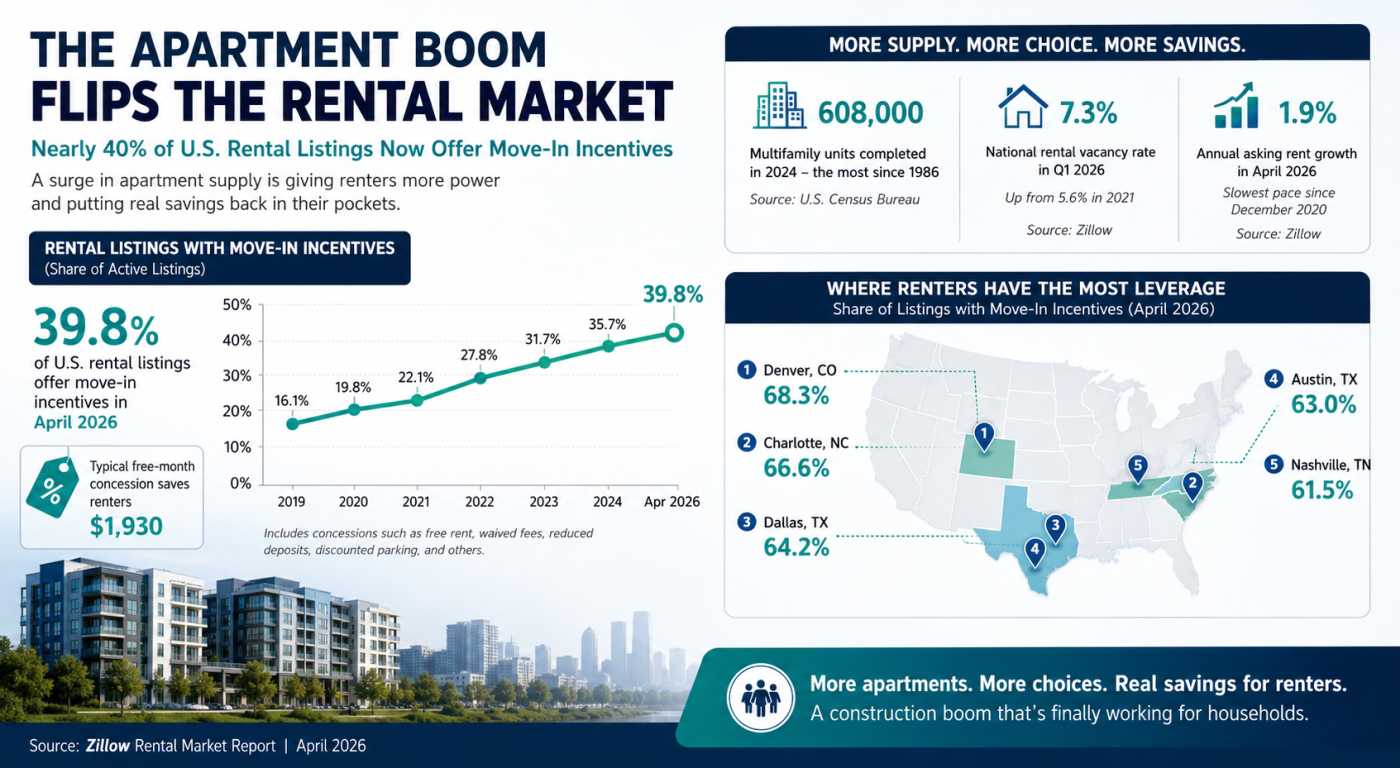
The Apartment Glut Changing America’s Rental Market

Why Community Colleges Are Winning Again
