
Fraud, Delays, and High Fees—Gone: The Underrated Fintech Shift Reshaping U.S. Local Economies
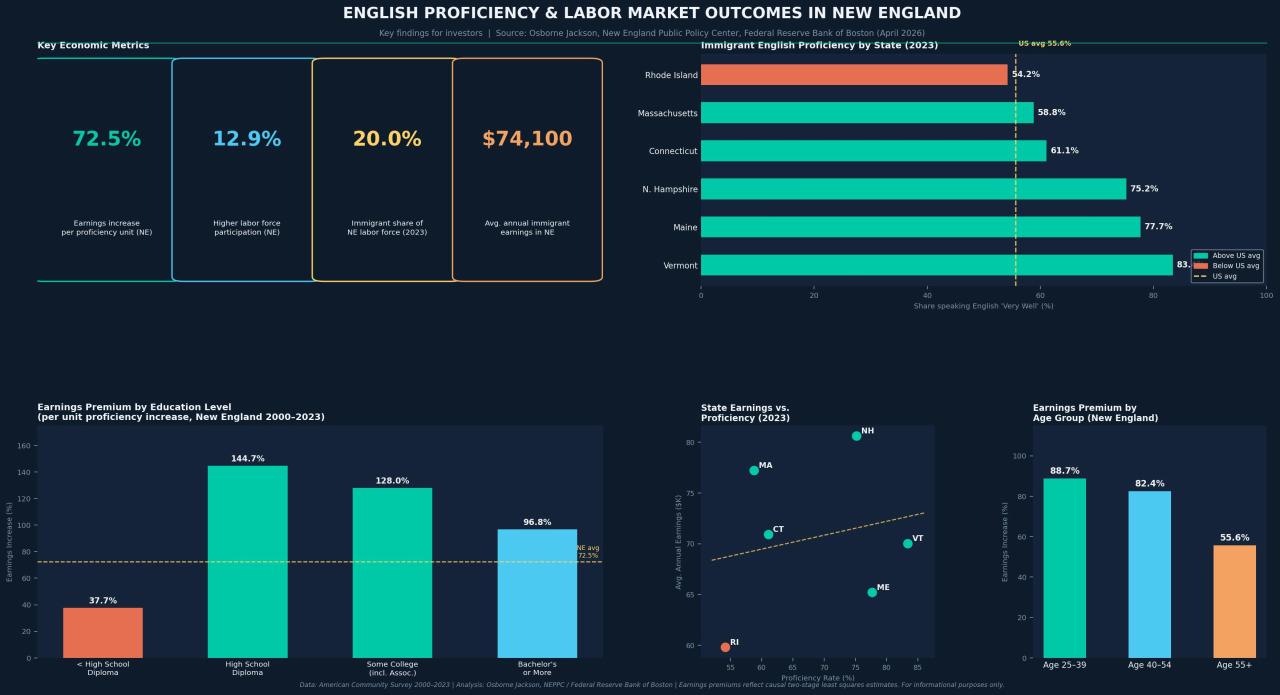
From Rhode Island to Vermont: The Proficiency Gap That's Quietly Dividing New England's Workforce
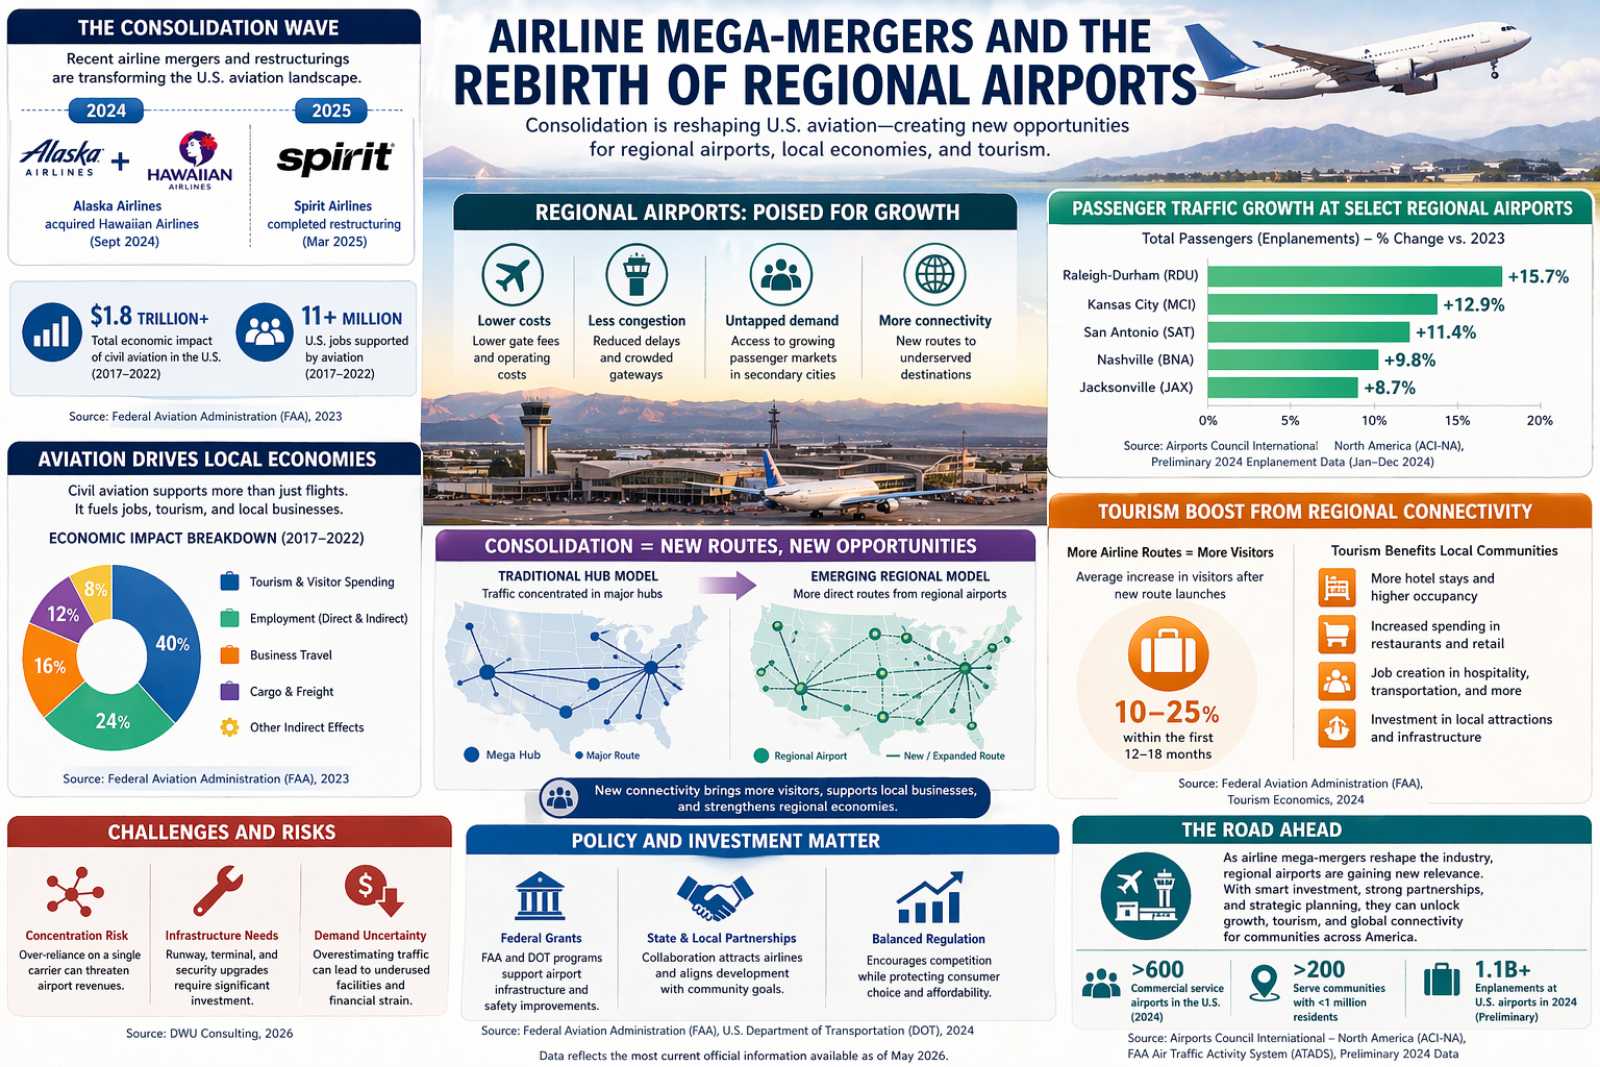
Regional Airports Poised for Growth Amid Airline Shakeups

From Fuel Shock to Factory Revival: The Surprising Rise of Hyper-Local Supply Chains in the U.S.
Technicals for Synopsys, Inc.


Price Summary
The stock of SNPS soared 6.63% today, reflecting a remarkable market performance.On 2026-04-24, Synopsys, Inc.'s stock started at 469.68, soared to 502.28, dropped to 469.19, and finished the day 6.63% higher at 500.82, with a trading volume of 2884357 shares.
In the 52-week period, the stock's peak price is 645.35, and the lowest price recorded is 380.47.
26 analysts predict that the future price of SNPS will be in the range of 403.85 to 650.0, with a mean expected price of about 534.6481.
Technicals
Support and Resistance: The price of 500.82 is supported at 477.26 and faces resistance at 505.34. This range suggests key levels for SNPS where the price may stabilize, with 477.26 acting as a support and 505.34 as a cap on gains.
Aroon: The continuation of Aroon's bullish trend, with Aroon Up holding at the 100 level, points to strong market momentum. However, to fully understand the trend's implications, it should be analyzed further in conjunction with other indicators.

Bol. Bands: The current price has recently crossed above the upper Bollinger Band, signaling a bullish move. This breakout suggests that buying interest is strong, pushing prices beyond their typical range. Traders may interpret this as a positive signal, indicating that the market might continue to rise as momentum builds.

Parabolic SAR: The PSAR continues to signal a bullish outlook, establishing a key support level that reinforces the market's upward momentum. This support could serve as a base for continued gains, suggesting that the bullish trend is likely to persist.

Stochastic: The stochastic indicator for Synopsys, Inc. reflects a bullish sentiment, as the K-line is above both the D-line and the 80 threshold. This setup points to strong upward momentum, implying that the market may continue to rise. Traders could consider this as an indication of sustained bullish activity.

Tripple Moving Agerage: The moving averages are signaling a bullish trend, with further confirmation coming from the upward slope of the 20, 50, and 100-day averages. This alignment indicates that market momentum is on the rise, supporting the potential for ongoing gains. Traders could view this as a strong indicator to maintain or increase their long positions.

To derive valuable insights from a company's technical performance, it is essential to first understand its fundamentals. This includes its financial health, business model, and market share. Equally important is the industry context, such as competition, consumer demand, and market trends. By examining these aspects together, investors can gain a more comprehensive view of how the company's stock behaves and whether it's aligned with its underlying value.
DISCLAIMER: We provide information and our musings based on events, but nothing on this site can be considered professional advice of any kind.
If you have enjoyed reading, spread the word:
Good prospects:
Companies with the best and the worst technicals.
Latest Regulatory Filings for SP5
Companies with the best and the worst fundamentals.

AI Data Centers Transform Small-Town USA: Jobs, Taxes, and Tech Ecosystems Explode
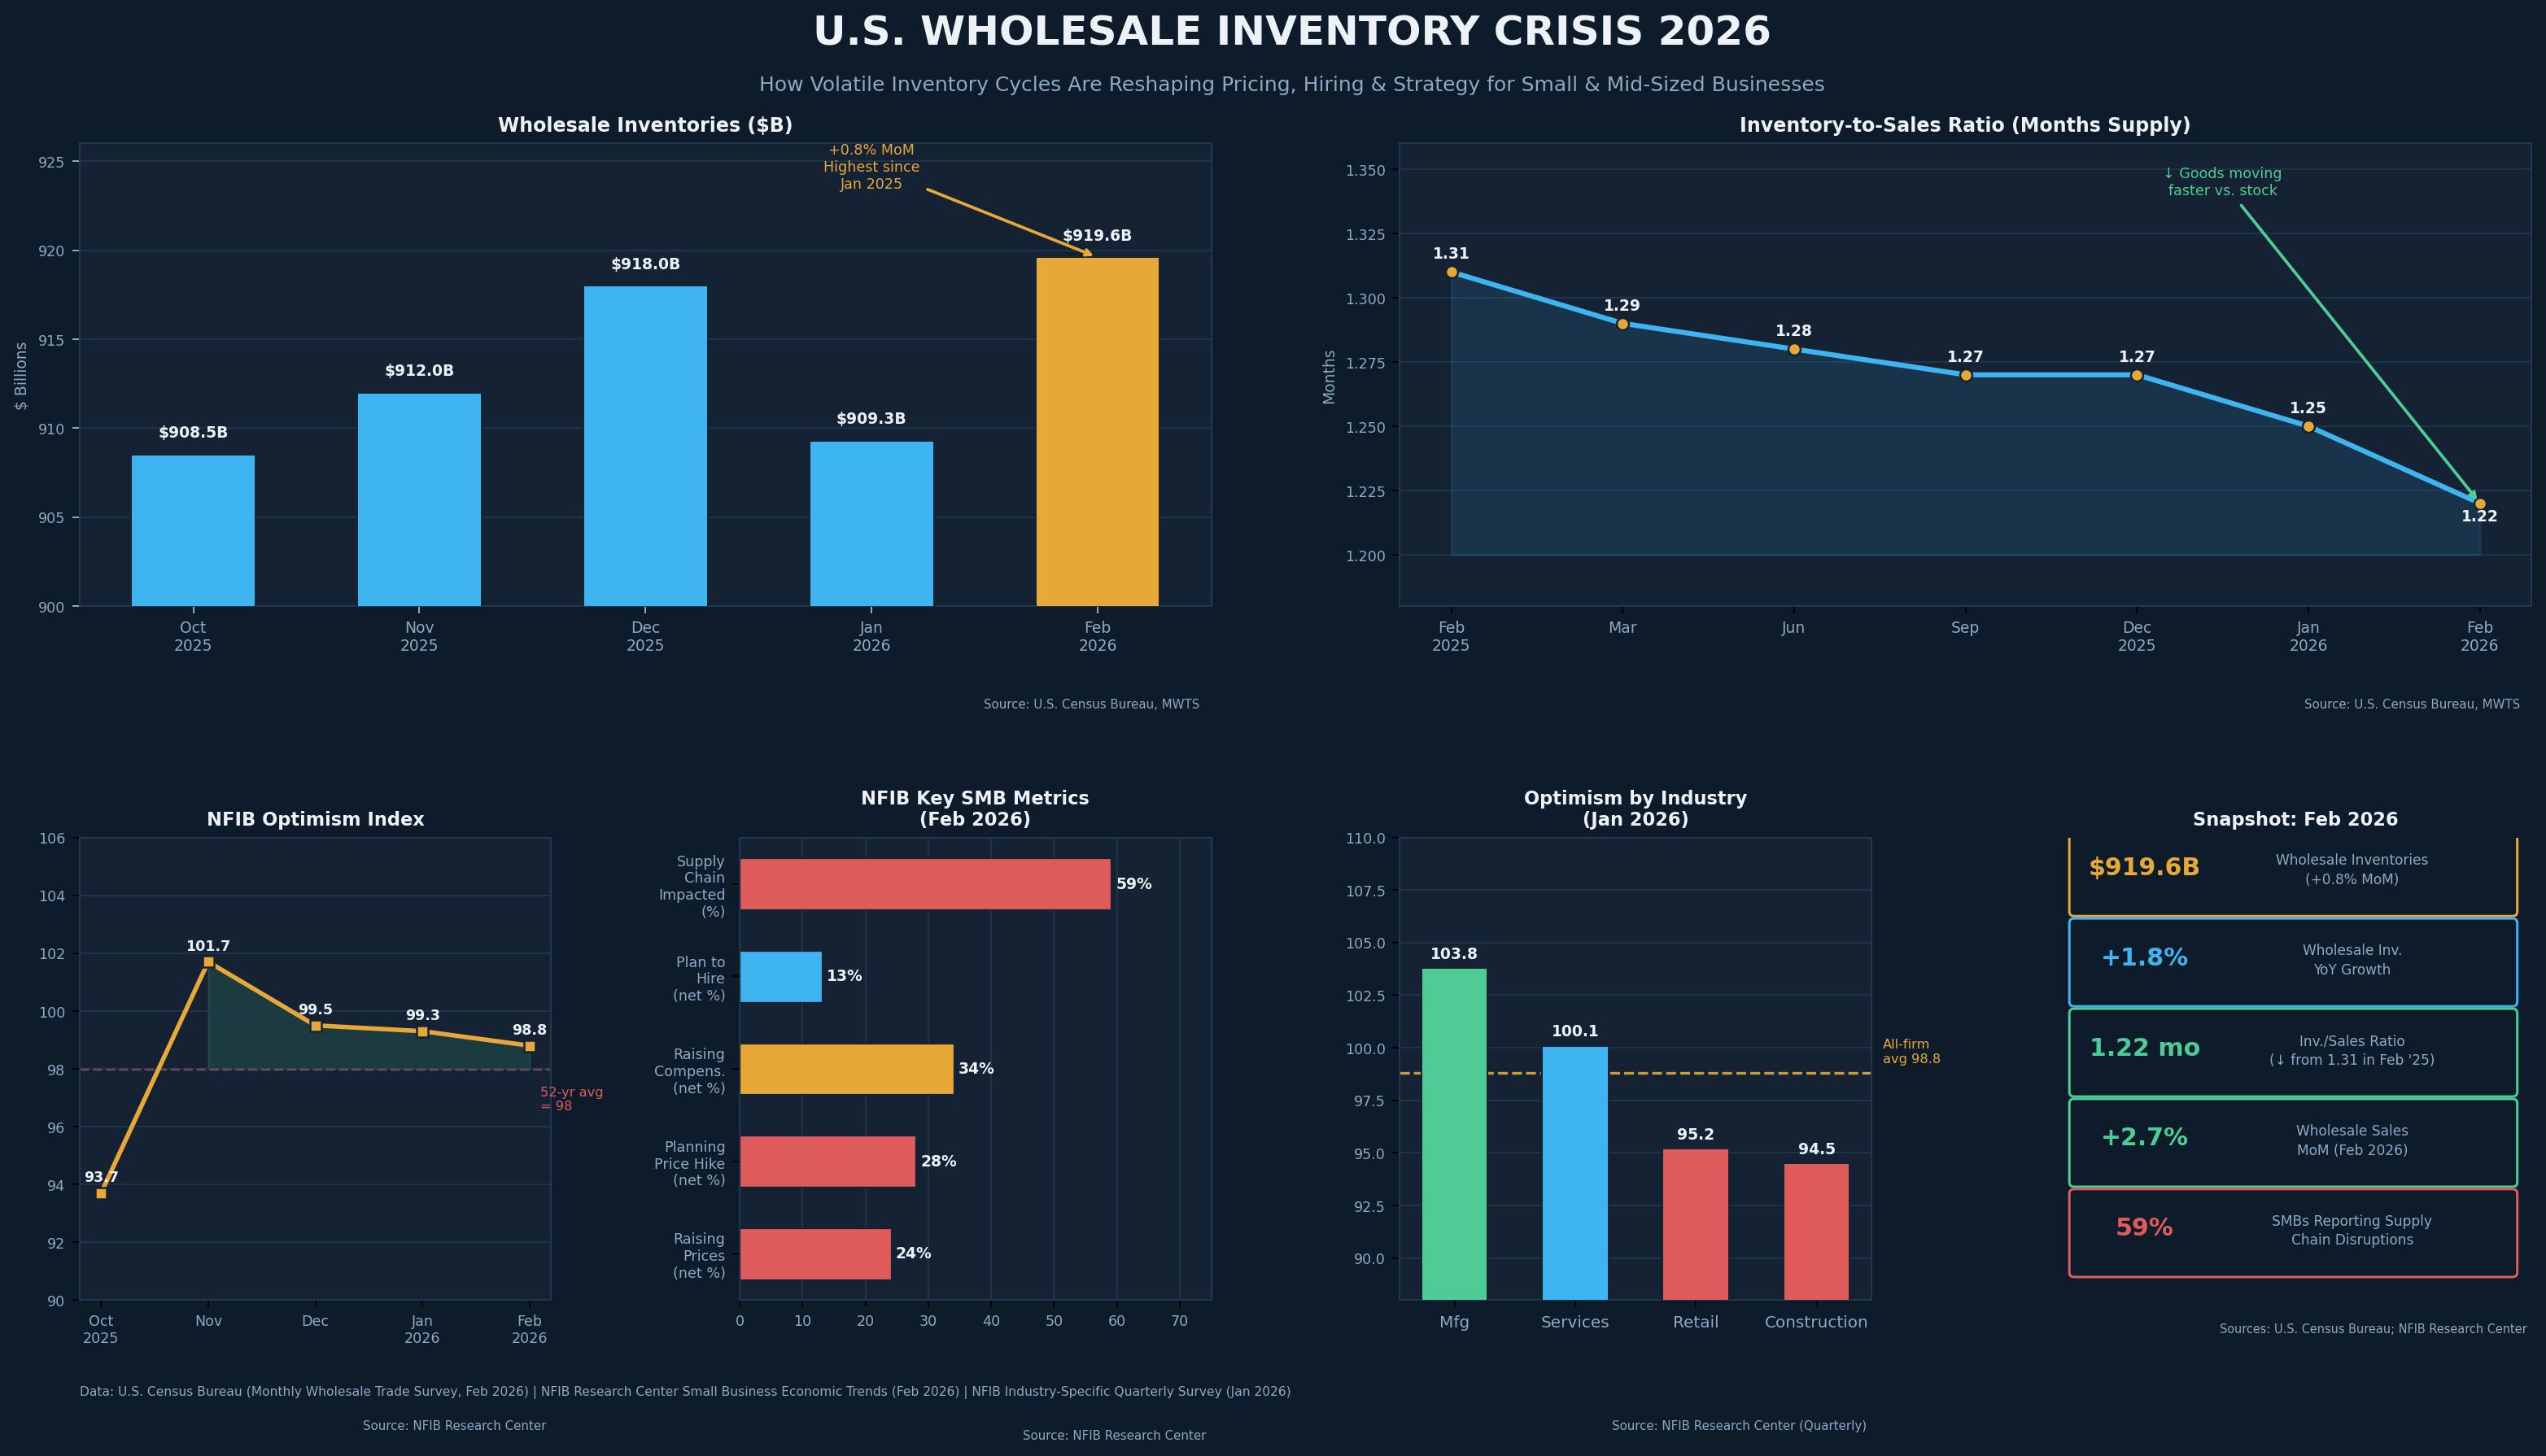
The $919 Billion Warning: What the Wholesale Inventory Explosion Really Means for Main Street

How U.S. Cities Are Turning Data and Infrastructure into Billion-Dollar Opportunities
