More about Super Micro Computer, Inc.
Regulatory Filings for Super Micro Computer, Inc.
Fundamentals for Super Micro Computer, Inc.

Diversification Shielded U.S. Banks

Repo, Debt and Risk: The Fed's Untold Warning for 2026

When Losing Money Pays: America's Broken Market Logic

The Hidden Time Bomb in AI Finance
Technicals for Super Micro Computer, Inc.


Price Summary
Super Micro Computer, Inc. had a stellar day at the stock market, and its shares jumped 5.63%.Super Micro Computer, Inc.'s stock began trading at 28.93 on 2026-07-22, soared to 32.28, dipped to 28.5, and finished the day 5.63% up at 30.56, with 162073657 shares exchanged.
Throughout the 52-week period, the stock hit a high of 60.71 and a low of 20.53.
Technicals
Support and Resistance: With the current price at 30.56, support is found at 29.71 and resistance at 32.42. These levels indicate where buyers might step in at 29.71, while sellers could limit gains at 32.42, defining a trading boundary for Super Micro Computer, Inc..
Aroon: The AROON indicator is signaling a robust bullish trend, as the Aroon Up has moved higher and the Aroon Oscillator has reversed. These movements suggest a reversal to an upward trend, indicating that market sentiment is turning more positive. Investors may see this as a sign of potential future gains, with the market likely to continue its upward trajectory.

Bol. Bands: The BOLL BANDS is in a neutral stance, with no clear direction indicated for the market. This lack of clarity suggests that the market may be in a state of equilibrium for SMCI, with no strong trend emerging.

Parabolic SAR: The PSAR has just shifted from bearish to bullish, hinting at a potential upward trend. If this change is supported by other indicators, it could signal a strong bullish trend. Investors should watch for additional confirmation before fully committing to this potential market opportunity.

Stochastic: The STOCHASTIC is currently in a neutral position for Super Micro Computer, Inc., offering no clear guidance on whether the market is likely to move up or down. This neutral stance suggests that further observation may be necessary before a trend becomes apparent.

Tripple Moving Agerage: The current state of the Tripple MOVING AVG is neutral for SMCI, providing no clear indication of a trend in either direction. This suggests that the market may be lacking momentum, making it difficult to predict future movements.

When analyzing a company, its fundamentals—such as earnings, management efficiency, and strategic initiatives—must be considered alongside technical data. The context of the industry in which the company operates also plays a key role, as market trends and competitive dynamics can significantly impact performance. By taking a comprehensive approach, combining both fundamental and technical analysis, one can gain a deeper understanding of the company's potential for growth or risk.
If you have enjoyed reading, spread the word:
Good prospects:
Companies with the best and the worst technicals.
Latest Regulatory Filings for SP5
Companies with the best and the worst fundamentals.
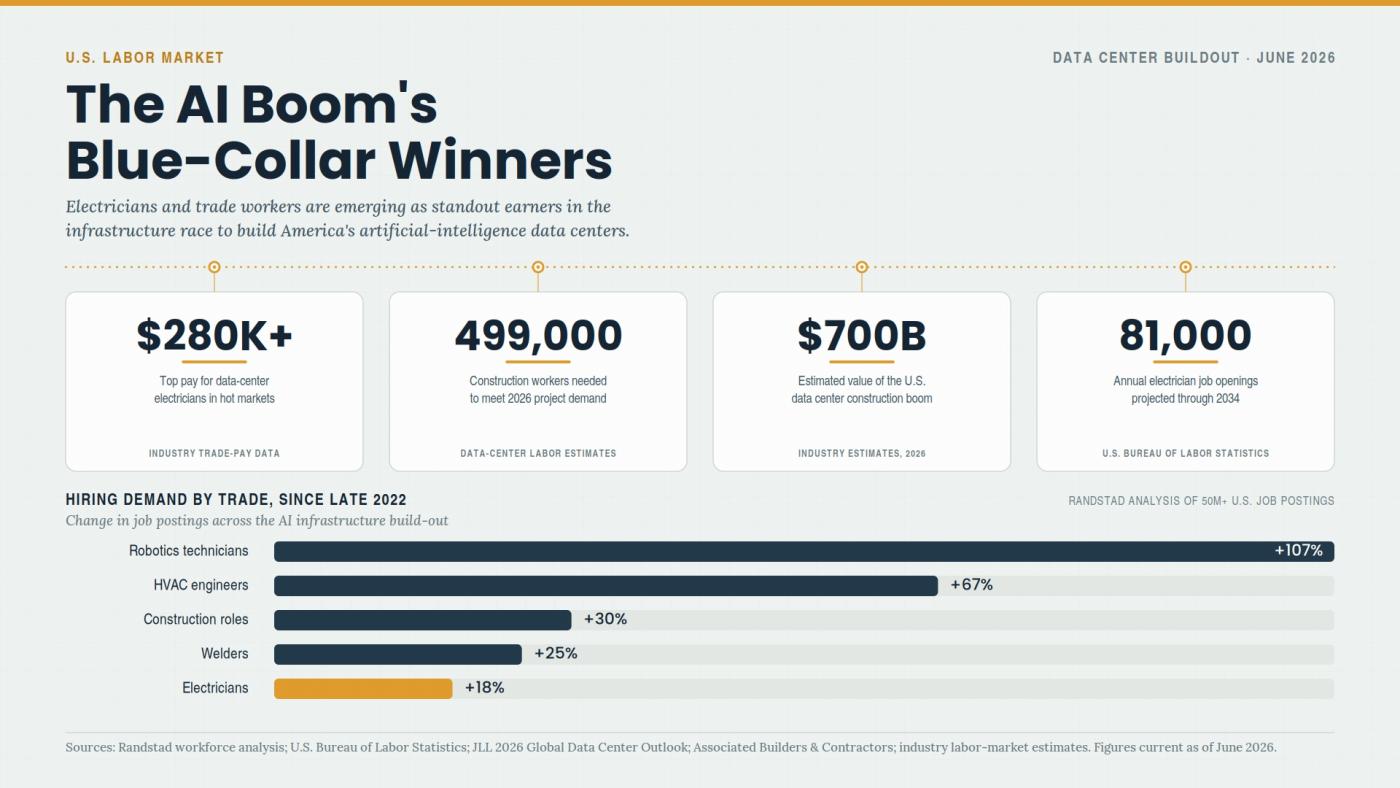
Why Electricians Now Out-Earn Software Engineers

The Apartment Glut Changing America’s Rental Market

Why Community Colleges Are Winning Again
