
Fraud, Delays, and High Fees—Gone: The Underrated Fintech Shift Reshaping U.S. Local Economies
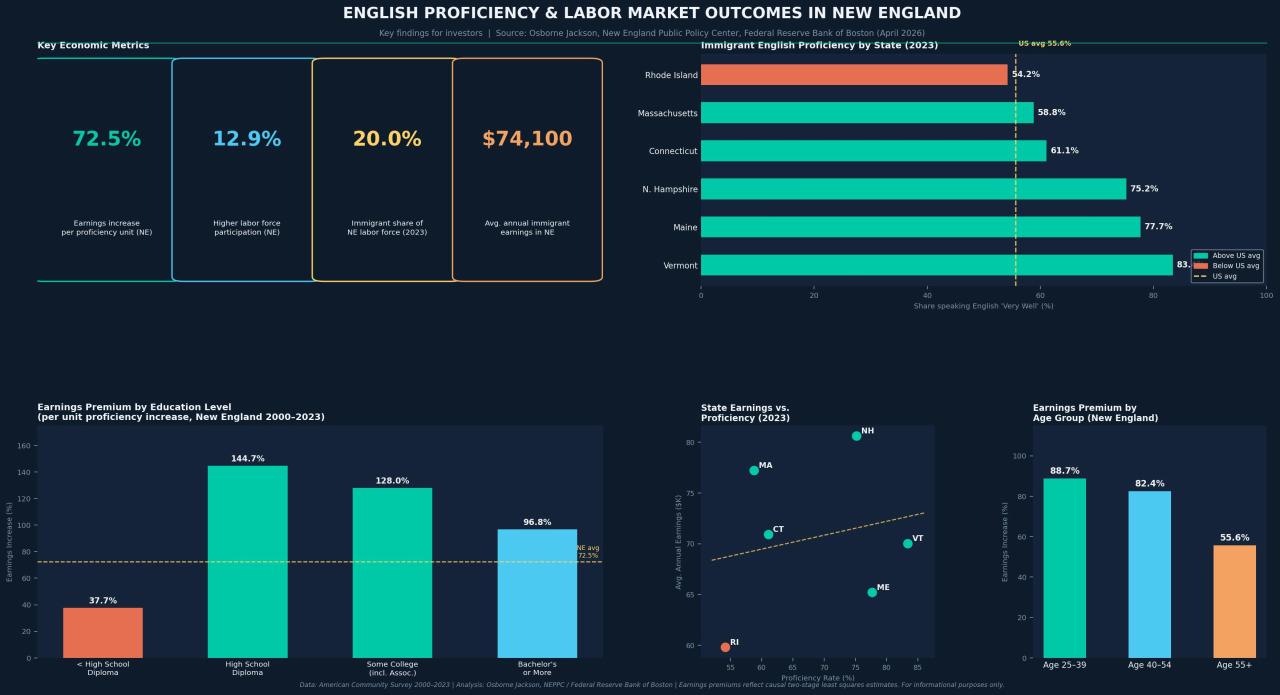
From Rhode Island to Vermont: The Proficiency Gap That's Quietly Dividing New England's Workforce
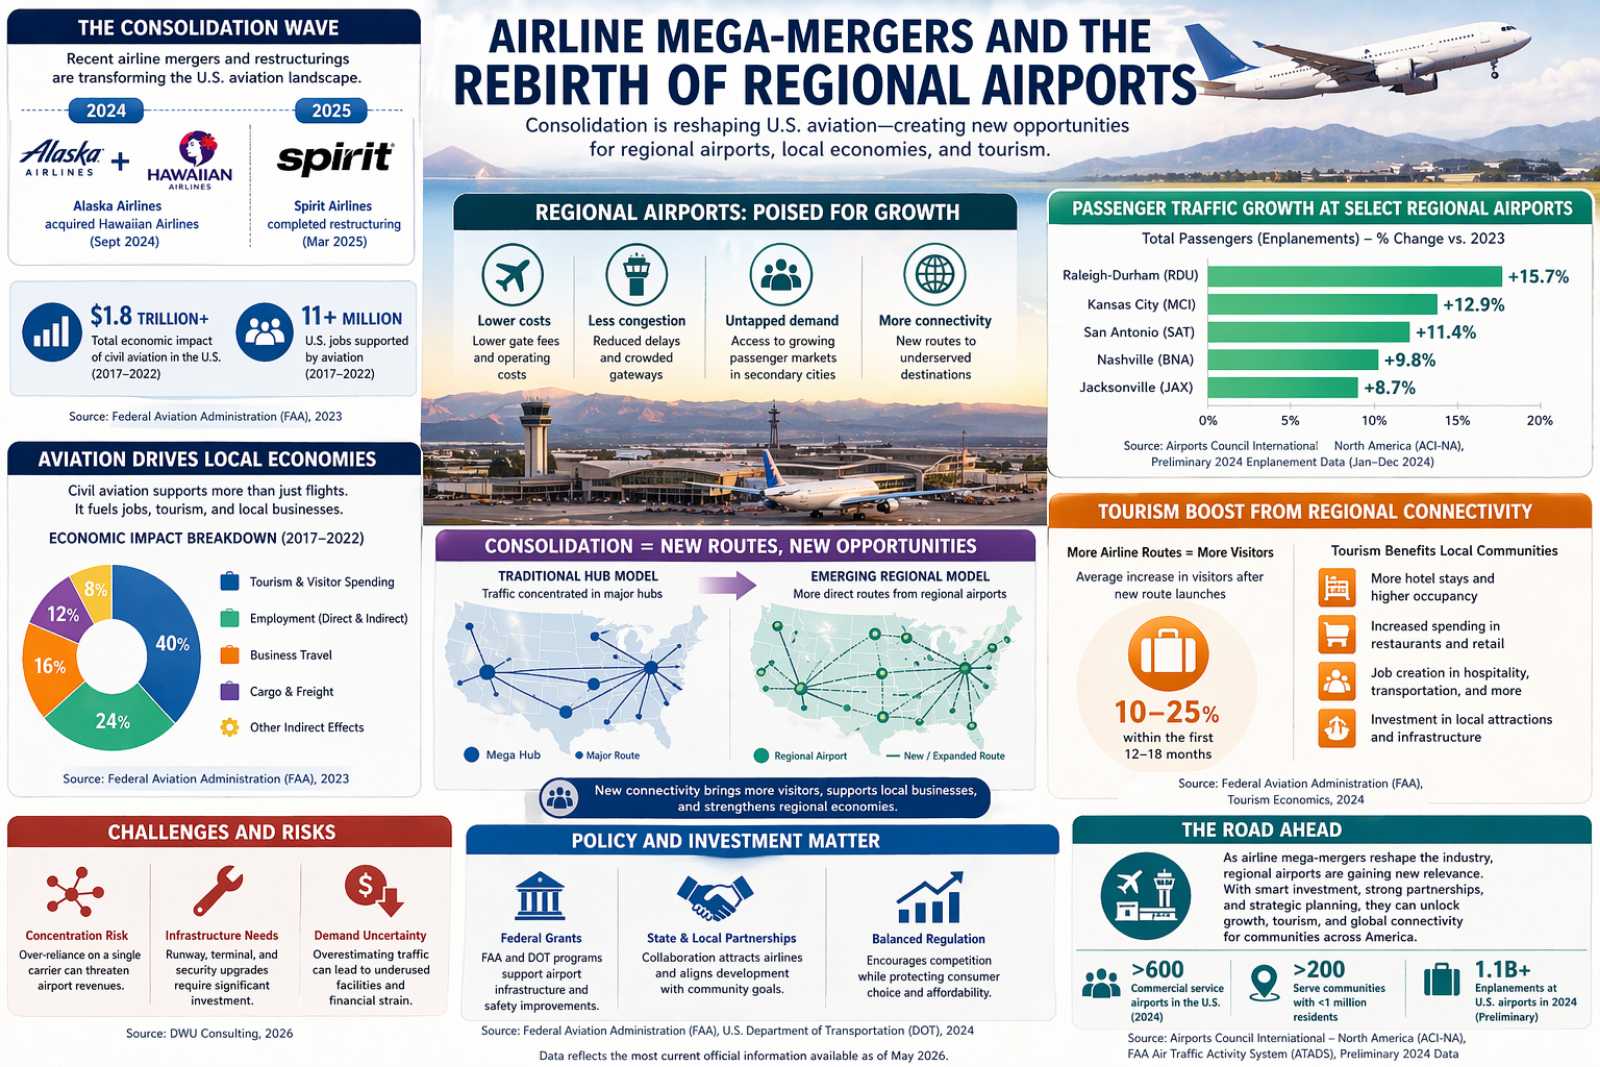
Regional Airports Poised for Growth Amid Airline Shakeups

From Fuel Shock to Factory Revival: The Surprising Rise of Hyper-Local Supply Chains in the U.S.
Technicals for SLB N.V.


Price Summary
SLB's shares experienced a significant 3.36% boost, indicating a impressive market performance.On 2026-04-24, SLB N.V.'s stock opened at 54.33, peaked at 56.9, hit a low of 54.02, and closed 3.36% higher at 56.15, with 22973145 shares changing hands.
The stock's highest value over the last 52 weeks is 56.15, and the lowest value is 31.72.
Based on recommendations from 28 analysts, the future price of SLB is expected to range from 41.0 to 70.0, with an average price expectation around 56.36071.
Technicals
Aroon: The continuation of Aroon's bullish trend, with Aroon Up at the 100 level, signals ongoing strength. To fully understand the implications of this trend, it should be examined further in conjunction with other technical indicators.

Bol. Bands: In the latest move, the current price has surpassed the upper Bollinger Band, marking a bullish signal for SLB. This breakout indicates that buying pressure is strong, pushing prices beyond their typical range. Such a move could suggest that the market is gaining momentum, with the potential for further upward movement.

Parabolic SAR: The PSAR remains bullish in its outlook, establishing a key support level that could serve as a foundation for further upward movement. This persistent bullish stance suggests that the market may continue to trend higher, with the established support providing a potential safety net for investors.

Stochastic: The stochastic indicator shows a bullish signal, with the K-line exceeding both the D-line and the 80 mark. This setup suggests strong upward momentum, implying that the market may continue to rise. Investors could consider this a favorable sign for continued market growth for SLB N.V..

Tripple Moving Agerage: The alignment of the 20, 50, and 100 moving averages suggests a bearish trend, but the wavering slopes of the 20 and 50 SMAs hint at a potential shift. This weakening momentum could indicate that the bearish trend is running out of steam, possibly leading to a bullish reversal in the near future. Investors should be aware of the possibility of a market turnaround as the current downtrend begins to falter.

When evaluating a company's technical data, such as stock price charts or volume, it is essential to first consider its fundamentals. These fundamentals include financial stability, growth potential, and competitive advantages. Additionally, understanding the broader industry in which the company operates offers context that helps to make sense of technical patterns. By examining both the company's internal strengths and external environment, one can make more accurate and meaningful conclusions about its stock performance.
DISCLAIMER: We provide information and our musings based on events, but nothing on this site can be considered professional advice of any kind.
If you have enjoyed reading, spread the word:
Good prospects:
Companies with the best and the worst technicals.
Latest Regulatory Filings for SP5
Companies with the best and the worst fundamentals.

AI Data Centers Transform Small-Town USA: Jobs, Taxes, and Tech Ecosystems Explode
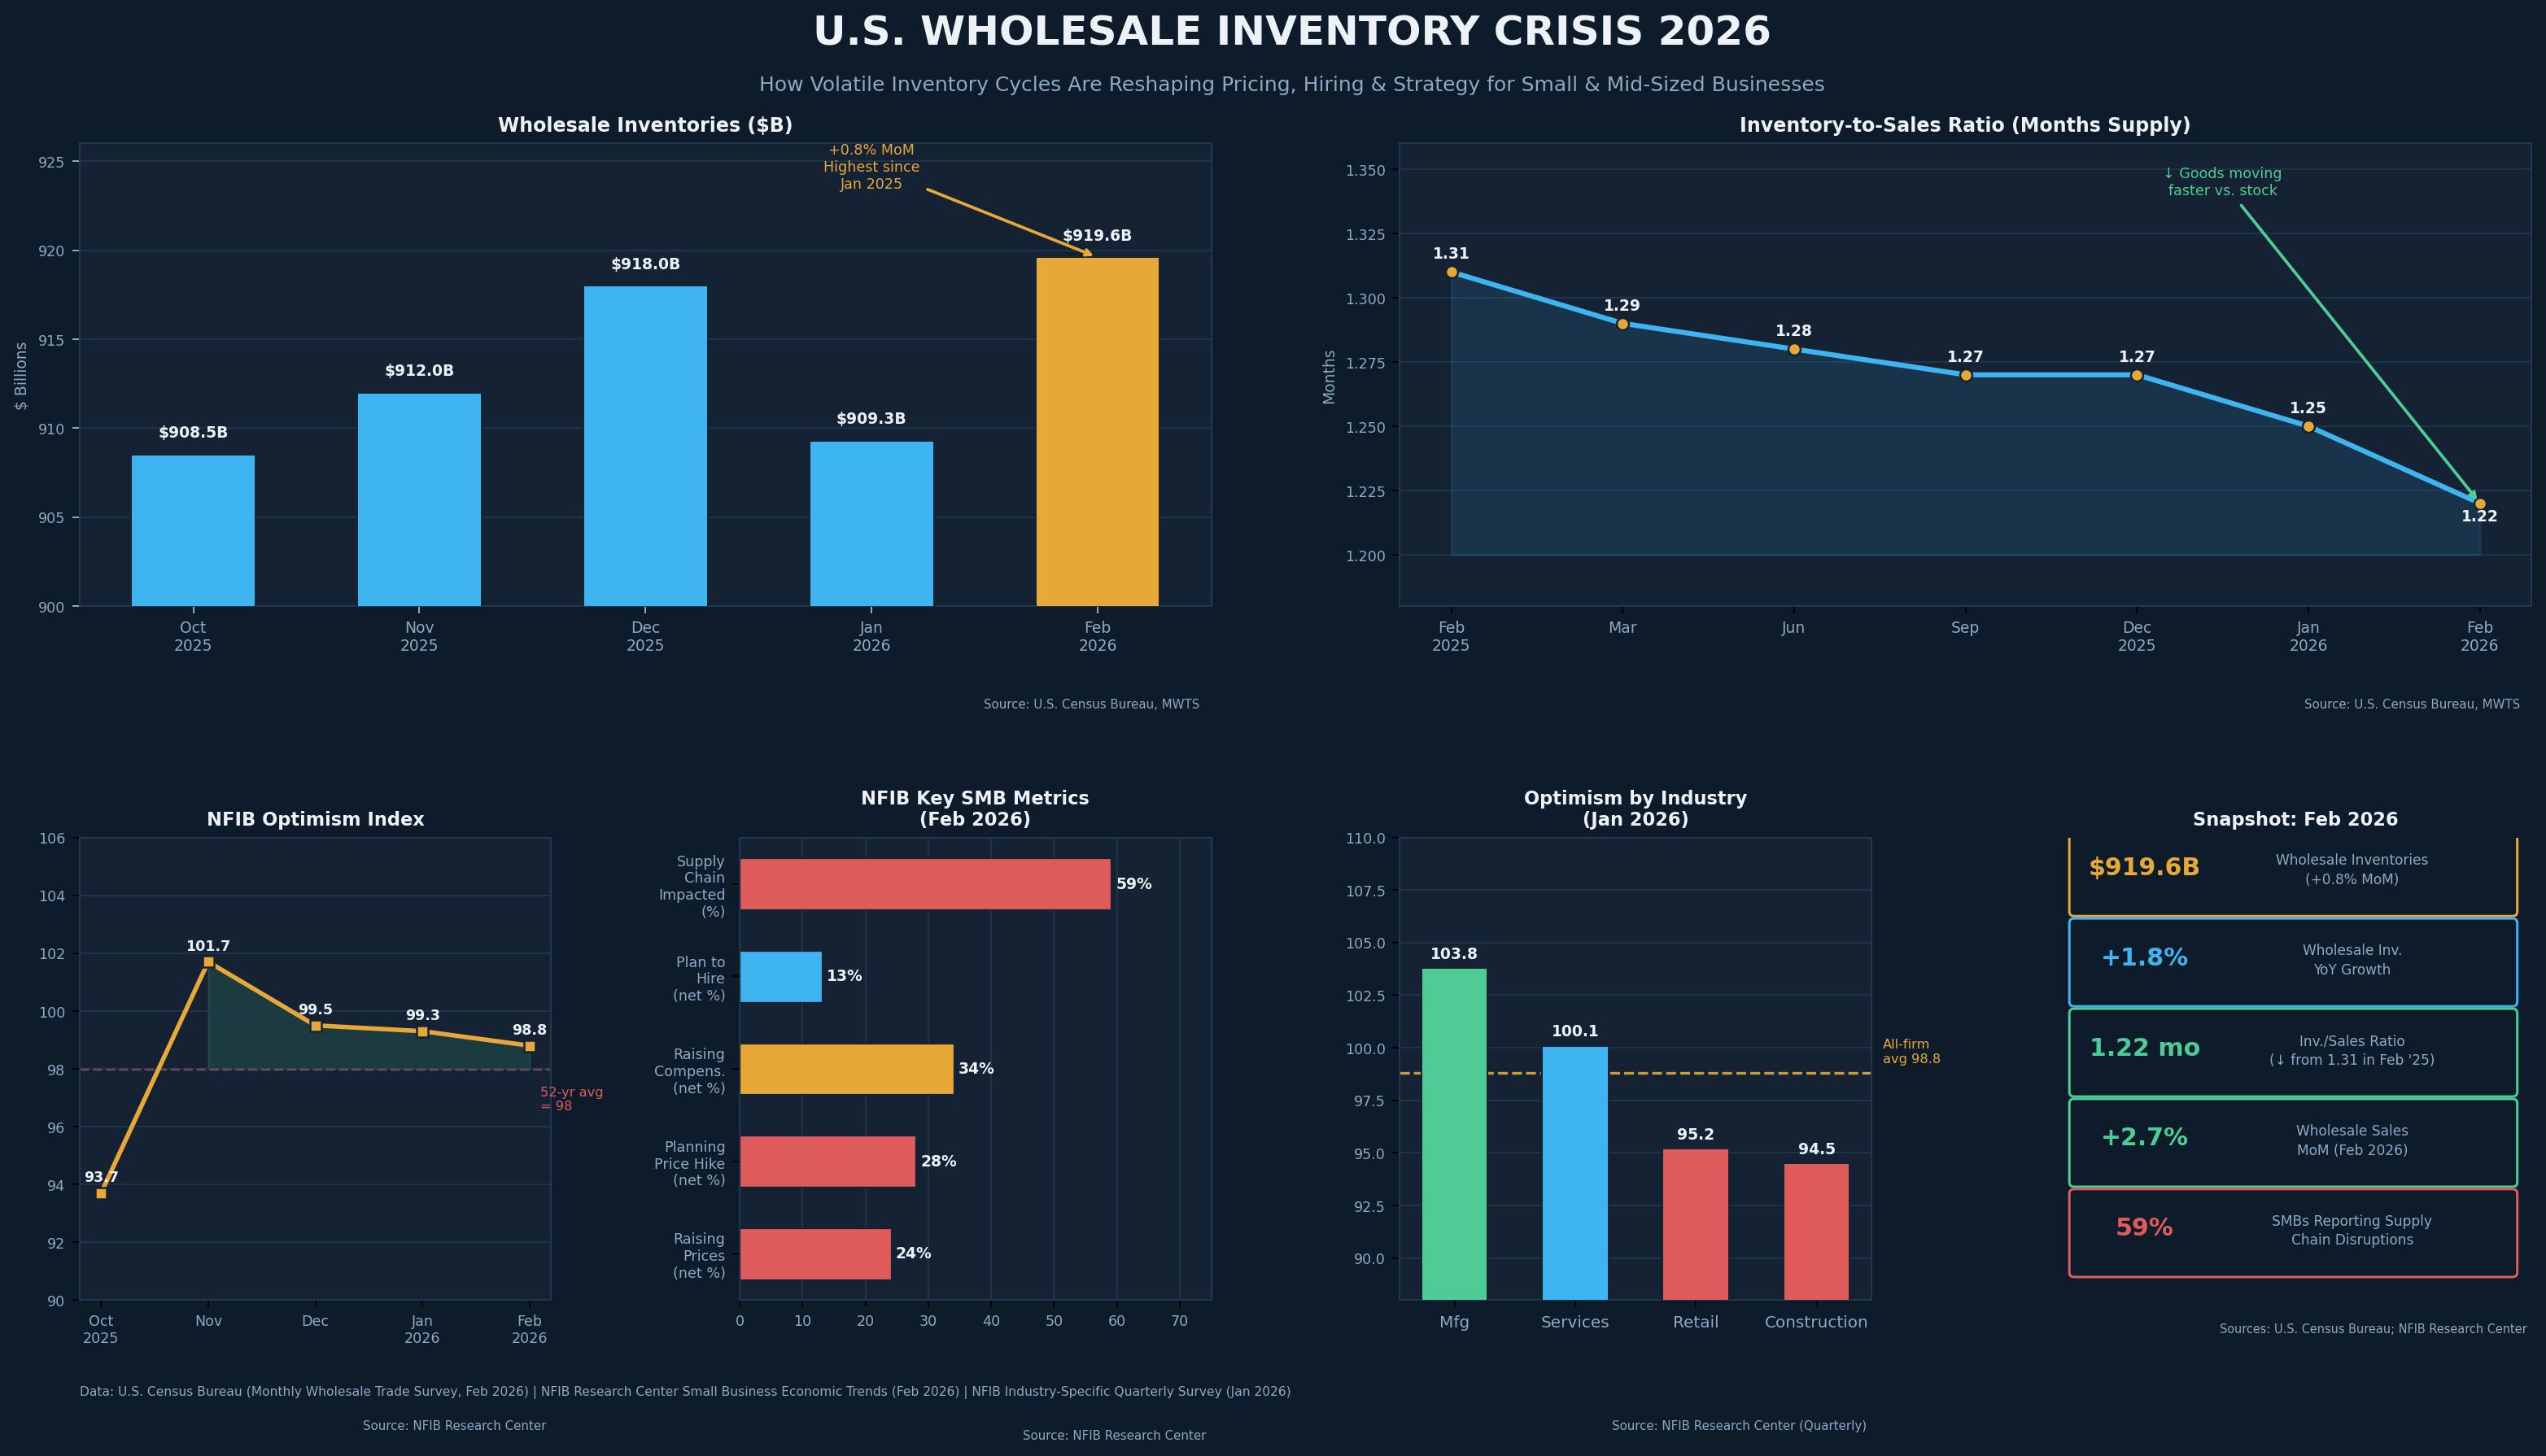
The $919 Billion Warning: What the Wholesale Inventory Explosion Really Means for Main Street

How U.S. Cities Are Turning Data and Infrastructure into Billion-Dollar Opportunities
