More about Pool Corporation
Regulatory Filings for Pool Corporation
Fundamentals for Pool Corporation

Fraud, Delays, and High Fees—Gone: The Underrated Fintech Shift Reshaping U.S. Local Economies
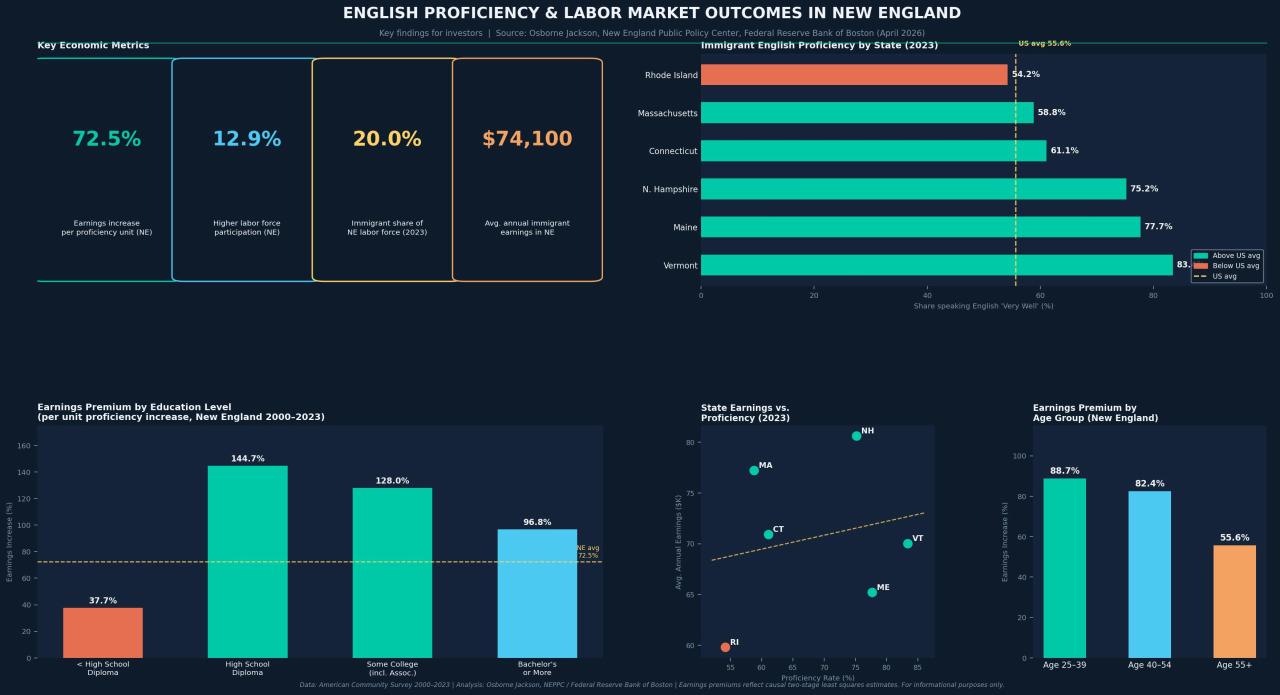
From Rhode Island to Vermont: The Proficiency Gap That's Quietly Dividing New England's Workforce
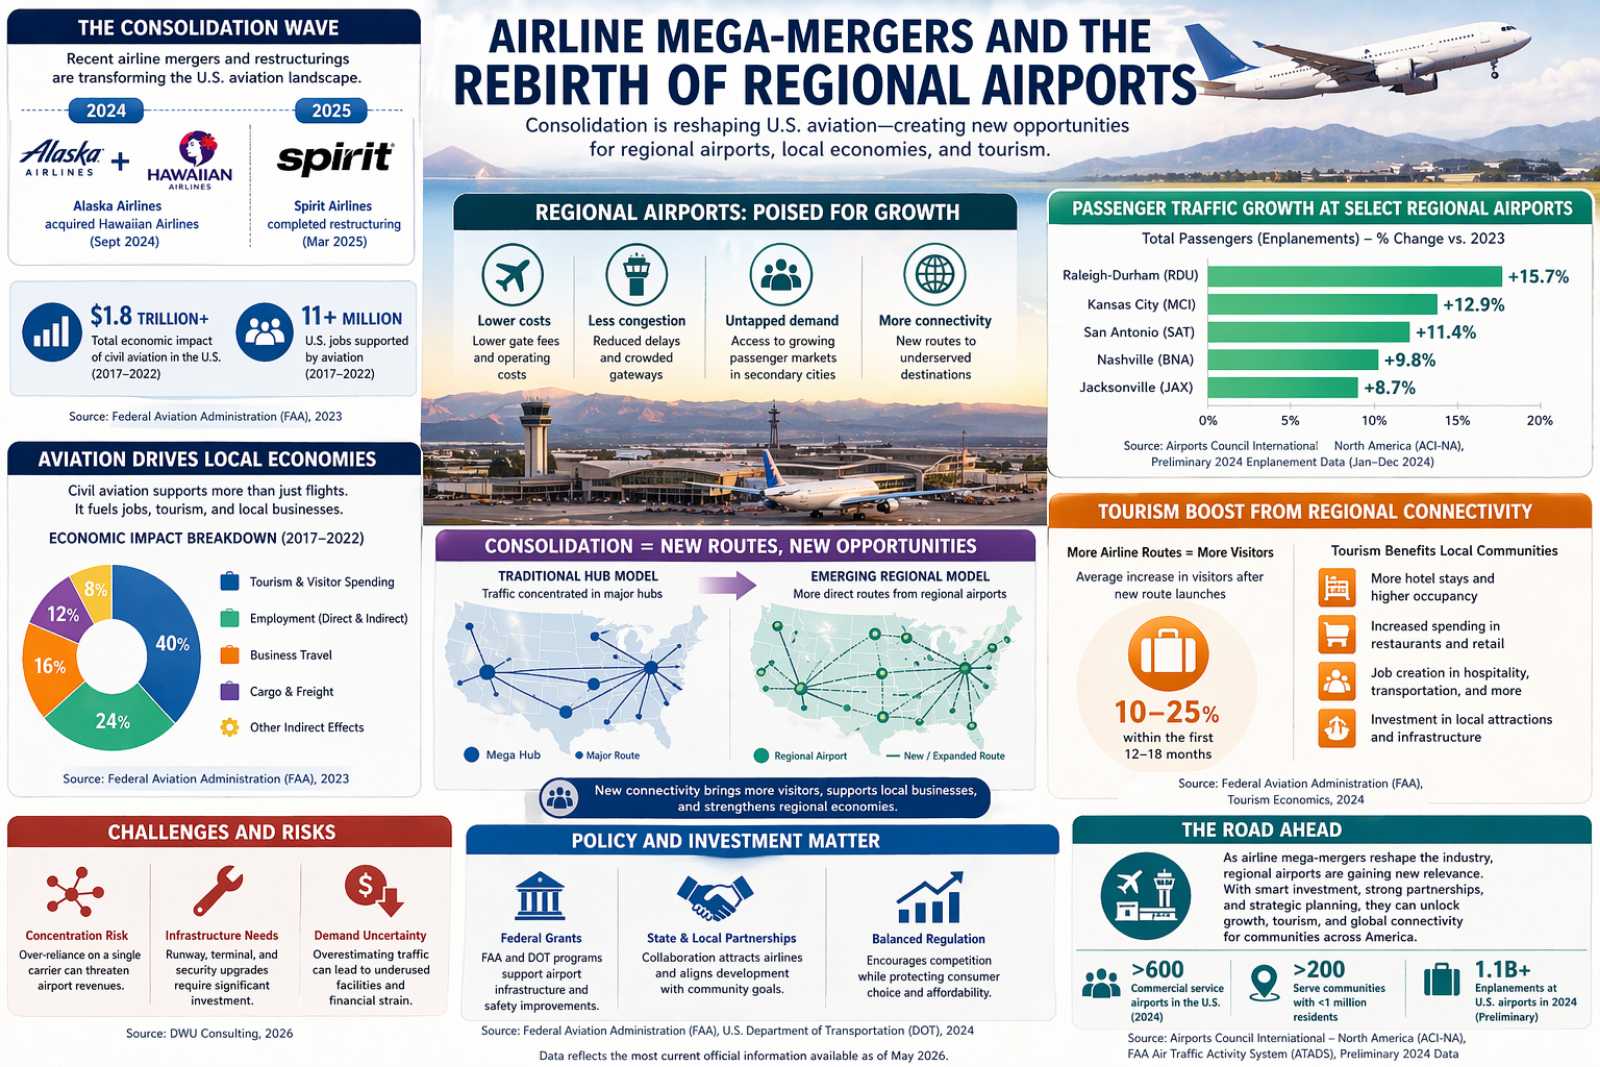
Regional Airports Poised for Growth Amid Airline Shakeups

From Fuel Shock to Factory Revival: The Surprising Rise of Hyper-Local Supply Chains in the U.S.
Technicals for Pool Corporation


Price Summary
In today's trading, Pool Corporation's stock declined by -5.56%, showcasing an awful market day.Pool Corporation's stock opened at 242.15 on 2026-04-23, surged to 249.04, hit a low of 227.6, and closed up -5.56% at 228.68, with 1187370 shares traded.
The highest price the stock achieved in the past 52 weeks is 333.62, while the lowest price it saw is 198.74.
According to 11 analysts, the future price is anticipated to vary between 215.0 and 340.0, with an average expected price of around 262.63635.
Technicals
Support and Resistance: The price of 228.68 is supported at 221.62 and faces resistance at 230.21. This range suggests key levels for POOL where the price may stabilize, with 221.62 acting as a support and 230.21 as a cap on gains.
Aroon: The continuation of Aroon's bullish trend, with Aroon Up at the 100 level, signals ongoing strength. To fully understand the implications of this trend, it should be examined further in conjunction with other technical indicators.

Bol. Bands: The price crossing below the upper Bollinger Band hints at a potential move lower. This signal could indicate that the asset is overbought and that a decline is imminent. Traders might view this as a sign of weakening bullish momentum, suggesting that a price correction or pullback is likely, making it a critical time to assess trading strategies.

Parabolic SAR: The PSAR continues to signal a bullish outlook, establishing a key support level that reinforces the market's upward momentum. This support could serve as a base for continued gains, suggesting that the bullish trend is likely to persist.

Stochastic: The K-line is now below the D-line on the stochastic indicator, though it remains above 80, pointing to a possible bearish price move. This could be an early warning that the market's upward trend is weakening, potentially leading to a reversal. Investors should be cautious and watch for further bearish signals.

Tripple Moving Agerage: The Tripple MOVING AVG is currently neutral, offering no clear guidance on market direction. This suggests that the market may be in a state of pause, with no strong trend emerging.

Before focusing on a company's technical data, such as stock price movements, it's essential to analyze its fundamentals. These include factors like profitability, cash flow, and debt management. Additionally, considering the broader industry landscape—including market trends, competition, and regulatory changes—offers deeper insights. This comprehensive approach allows for a more meaningful interpretation of the company's technical indicators, providing a clearer picture of its financial health and future prospects.
DISCLAIMER: We provide information and our musings based on events, but nothing on this site can be considered professional advice of any kind.
If you have enjoyed reading, spread the word:
Good prospects:
Companies with the best and the worst technicals.
Latest Regulatory Filings for SP5
Companies with the best and the worst fundamentals.

AI Data Centers Transform Small-Town USA: Jobs, Taxes, and Tech Ecosystems Explode
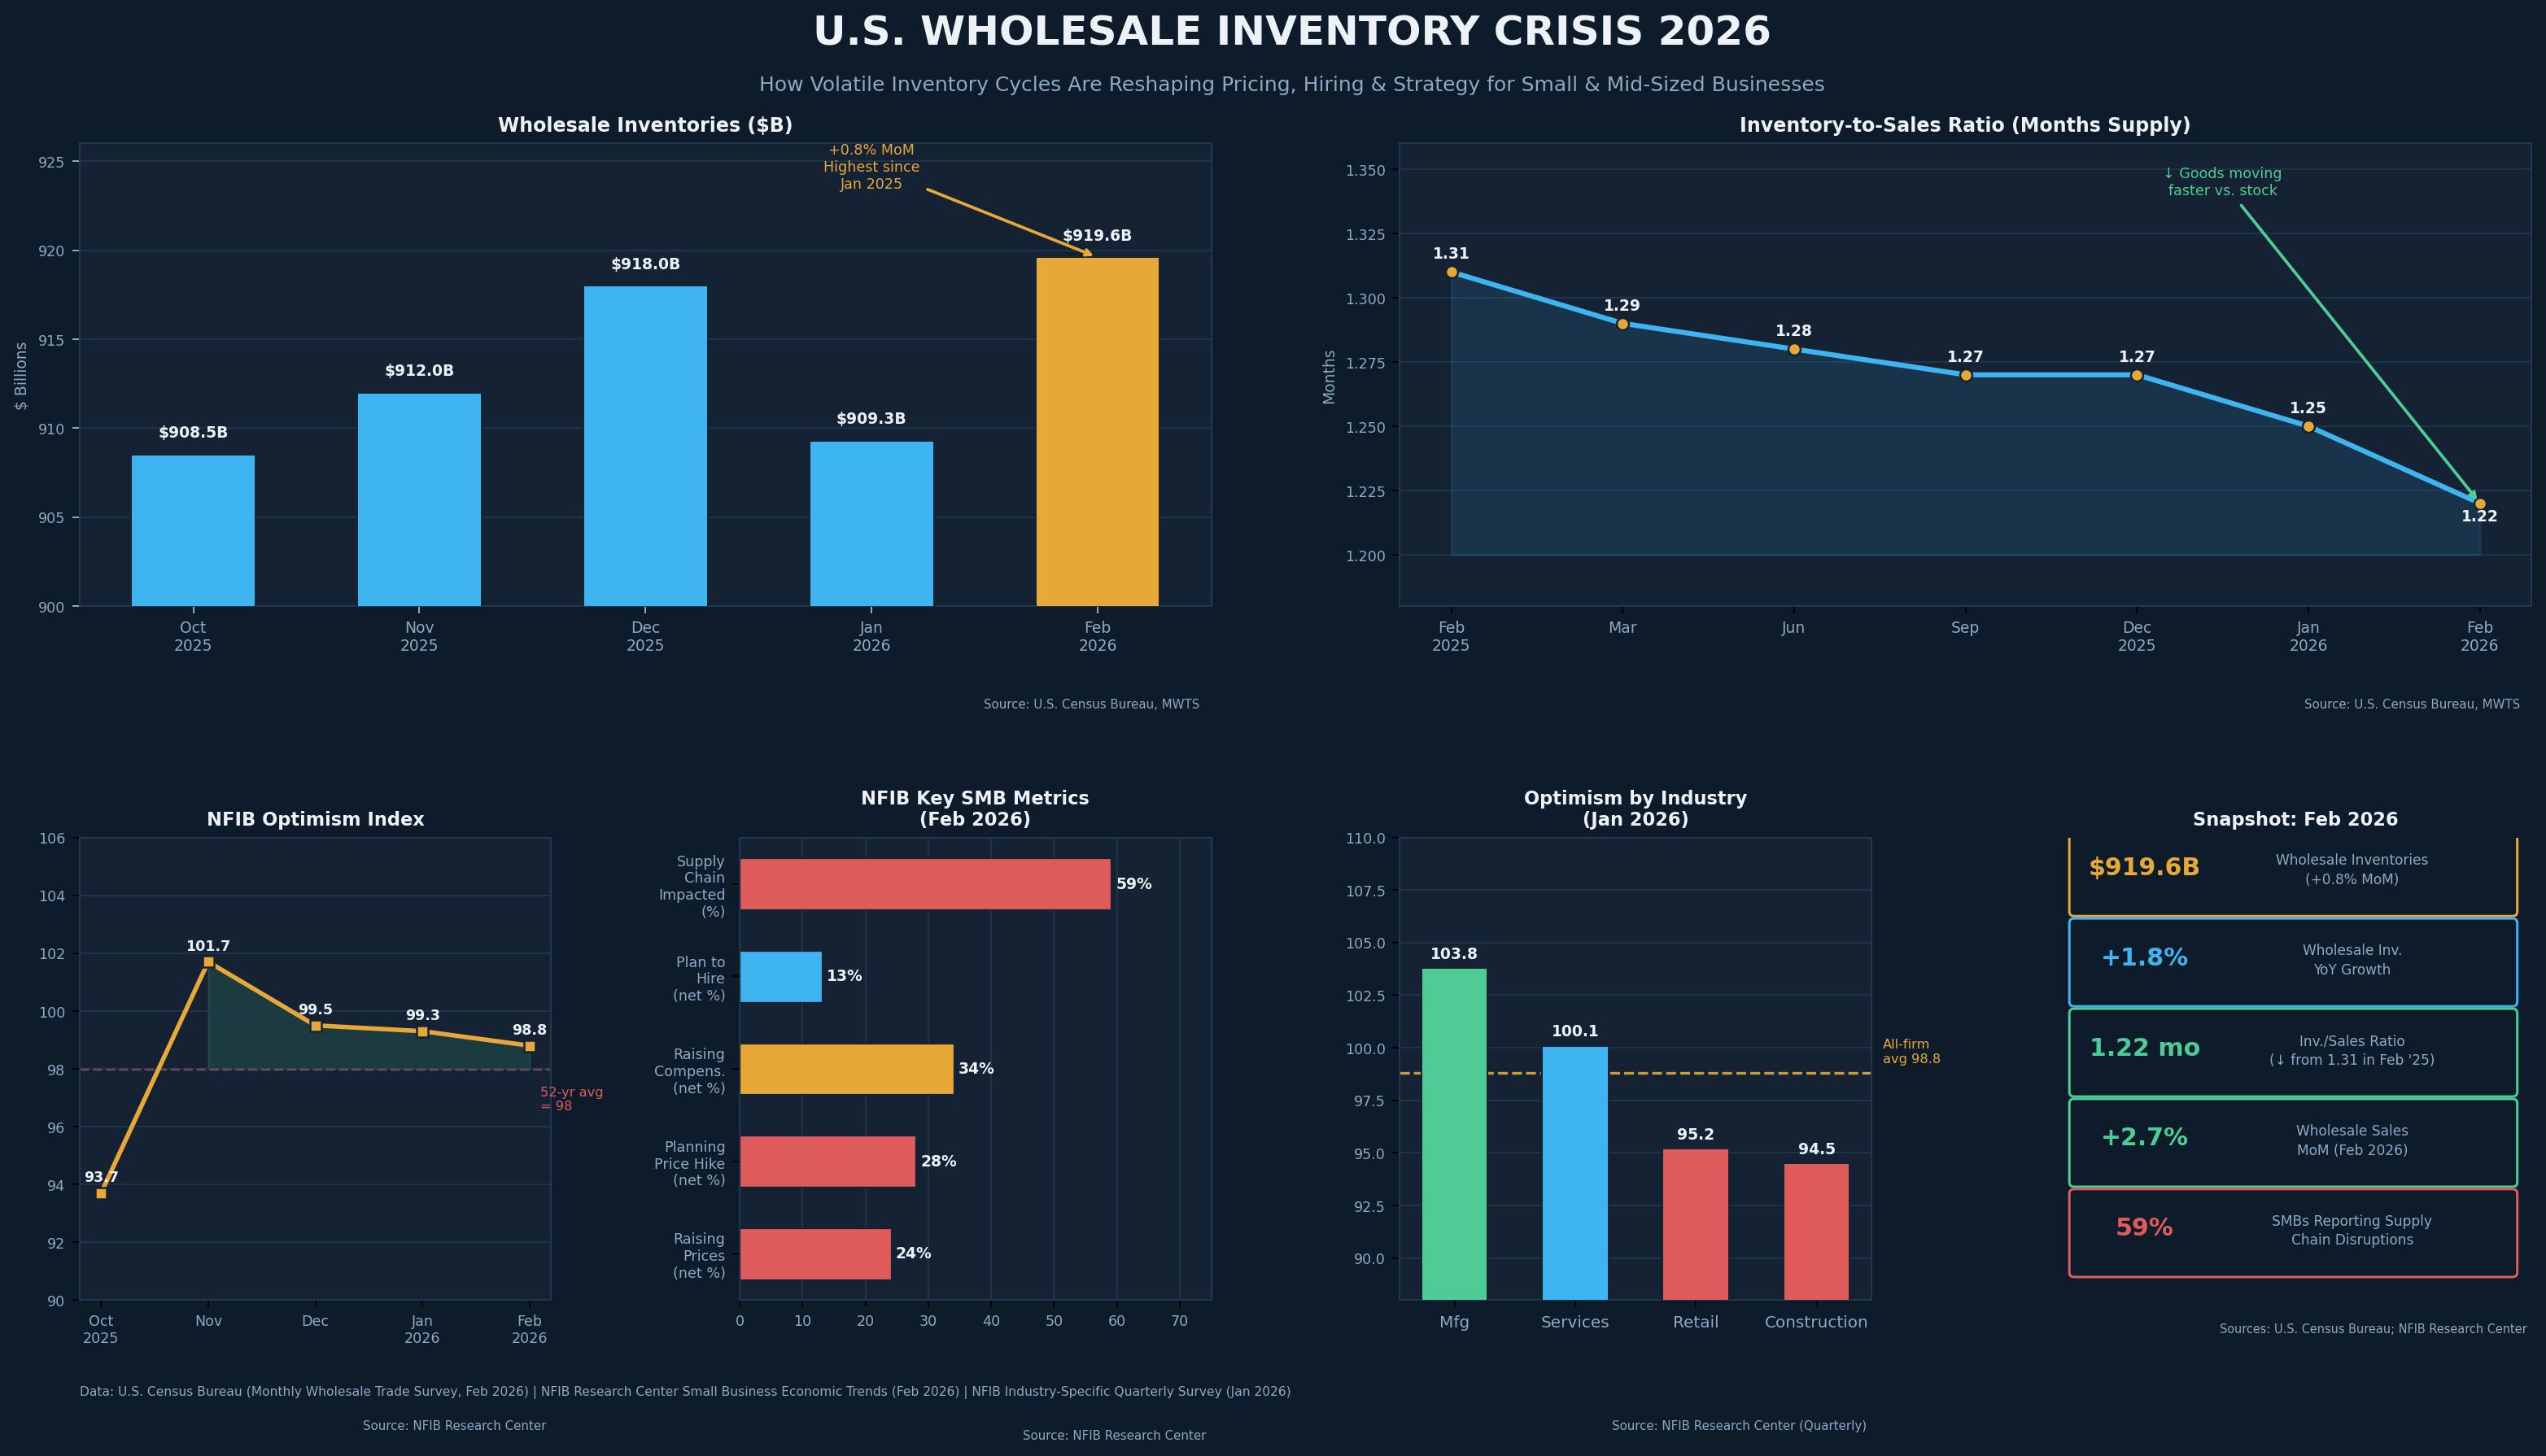
The $919 Billion Warning: What the Wholesale Inventory Explosion Really Means for Main Street

How U.S. Cities Are Turning Data and Infrastructure into Billion-Dollar Opportunities
