More about The PNC Financial Services Group, Inc.
Regulatory Filings for The PNC Financial Services Group, Inc.
Fundamentals for The PNC Financial Services Group, Inc.

Diversification Shielded U.S. Banks

Repo, Debt and Risk: The Fed's Untold Warning for 2026

When Losing Money Pays: America's Broken Market Logic

The Hidden Time Bomb in AI Finance
Technicals for The PNC Financial Services Group, Inc.


Price Summary
On 2026-07-22, PNC's stock started at 250.0, reached a high of 253.1, fell to 249.45, and ended 1.0% higher at 252.51, with 1690674 shares traded.The stock's highest value over the last 52 weeks is 255.2, and the lowest value is 178.37.
Technicals
Support and Resistance: The current price of 252.51 for PNC is supported at 229.32 and faces resistance at 252.86. These levels indicate that 229.32 could act as a floor, while 252.86 might limit any further price increases.
Aroon: The AROON is currently in a neutral position for The PNC Financial Services Group, Inc., offering no clear guidance on whether the market is likely to move up or down. This neutral stance suggests that further observation may be necessary before a trend becomes apparent.

Bol. Bands: The BOLL BANDS is currently neutral, showing no clear bias toward an upward or downward trend. This suggests that the market may be in a phase of indecision or consolidation.

Parabolic SAR: The PSAR continues its bearish trend, setting a resistance level that could prevent significant upward movement for PNC. This resistance suggests that the market may struggle to overcome bearish forces, keeping upward momentum in check.

Stochastic: The STOCHASTIC is currently in a neutral position for The PNC Financial Services Group, Inc., offering no clear guidance on whether the market is likely to move up or down. This neutral stance suggests that further observation may be necessary before a trend becomes apparent.

Tripple Moving Agerage: The alignment of the 20, 50, and 100 moving averages points to a bearish trend for The PNC Financial Services Group, Inc., but the wavering slopes of the 20 and 50 SMAs indicate that this momentum may be weakening. This loss of strength could be a sign that the market is approaching a turning point, with the possibility of a bullish reversal on the horizon. Investors should watch for signs of a trend change as the current downtrend starts to fade.

To accurately interpret a company's technical data, it is important to first examine its fundamentals. These include financial performance, management quality, and growth prospects. In addition, understanding the dynamics of the industry in which the company operates—such as competition, market trends, and regulatory factors—provides further insights. This combined analysis helps create a fuller picture, allowing for more precise conclusions to be drawn from the company's technical performance and stock behavior.
If you have enjoyed reading, spread the word:
Good prospects:
Companies with the best and the worst technicals.
Latest Regulatory Filings for SP5
Companies with the best and the worst fundamentals.
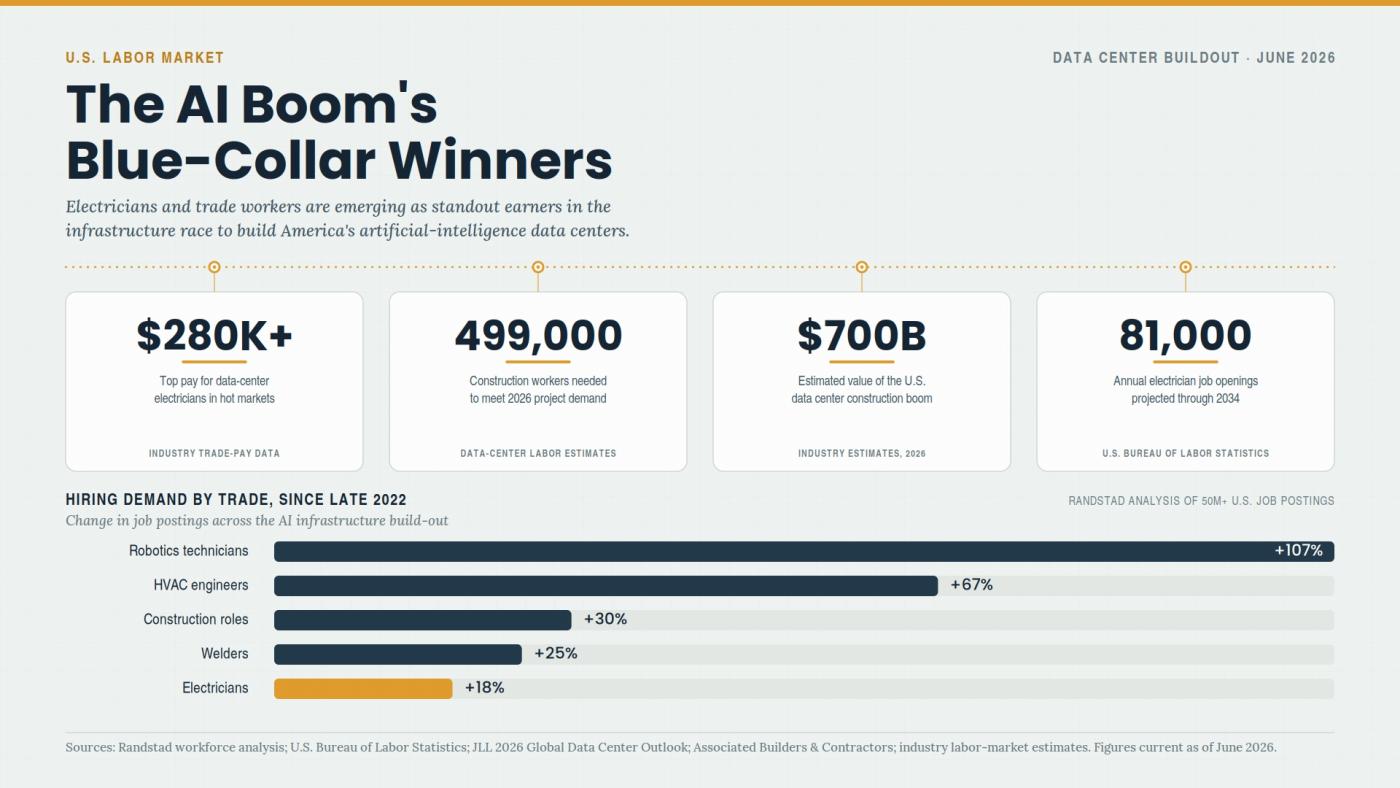
Why Electricians Now Out-Earn Software Engineers
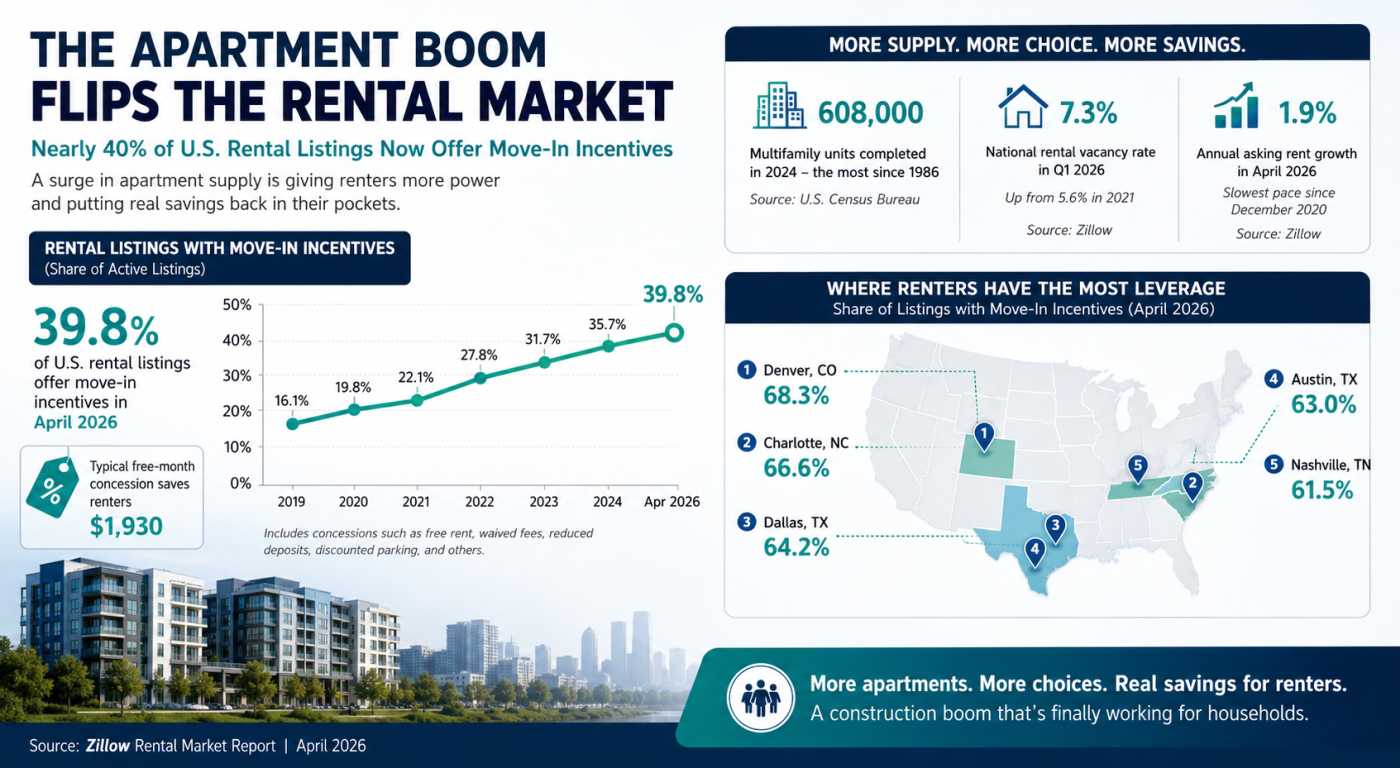
The Apartment Glut Changing America’s Rental Market
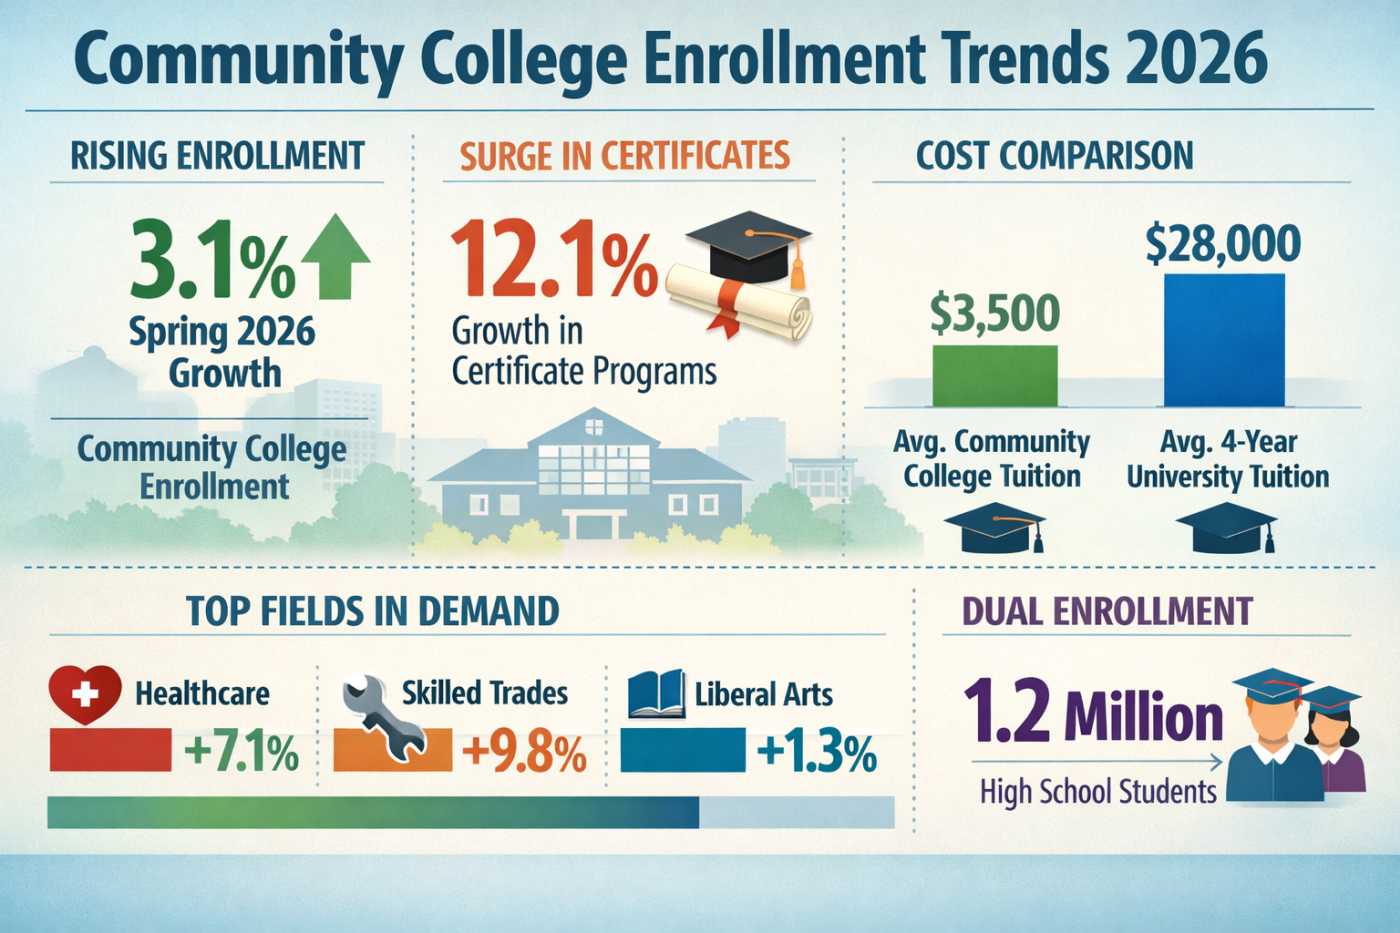
Why Community Colleges Are Winning Again
