More about PG&E Corporation
Regulatory Filings for PG&E Corporation
Fundamentals for PG&E Corporation

Fraud, Delays, and High Fees—Gone: The Underrated Fintech Shift Reshaping U.S. Local Economies
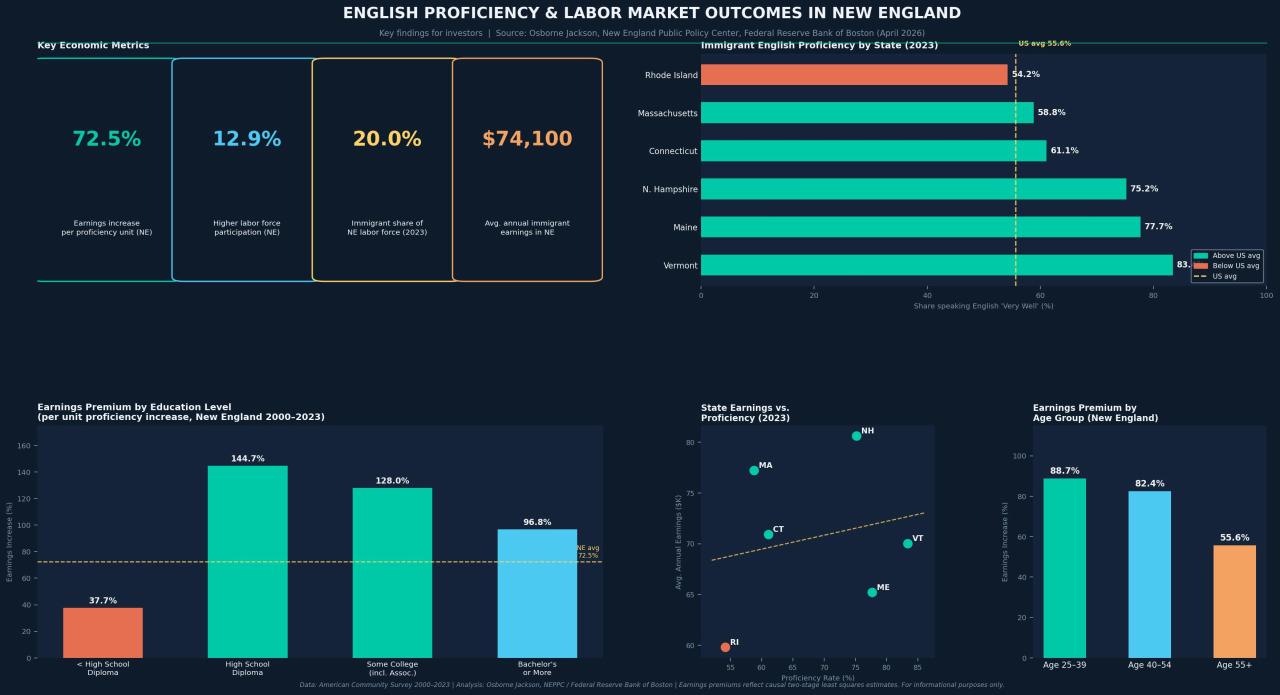
From Rhode Island to Vermont: The Proficiency Gap That's Quietly Dividing New England's Workforce
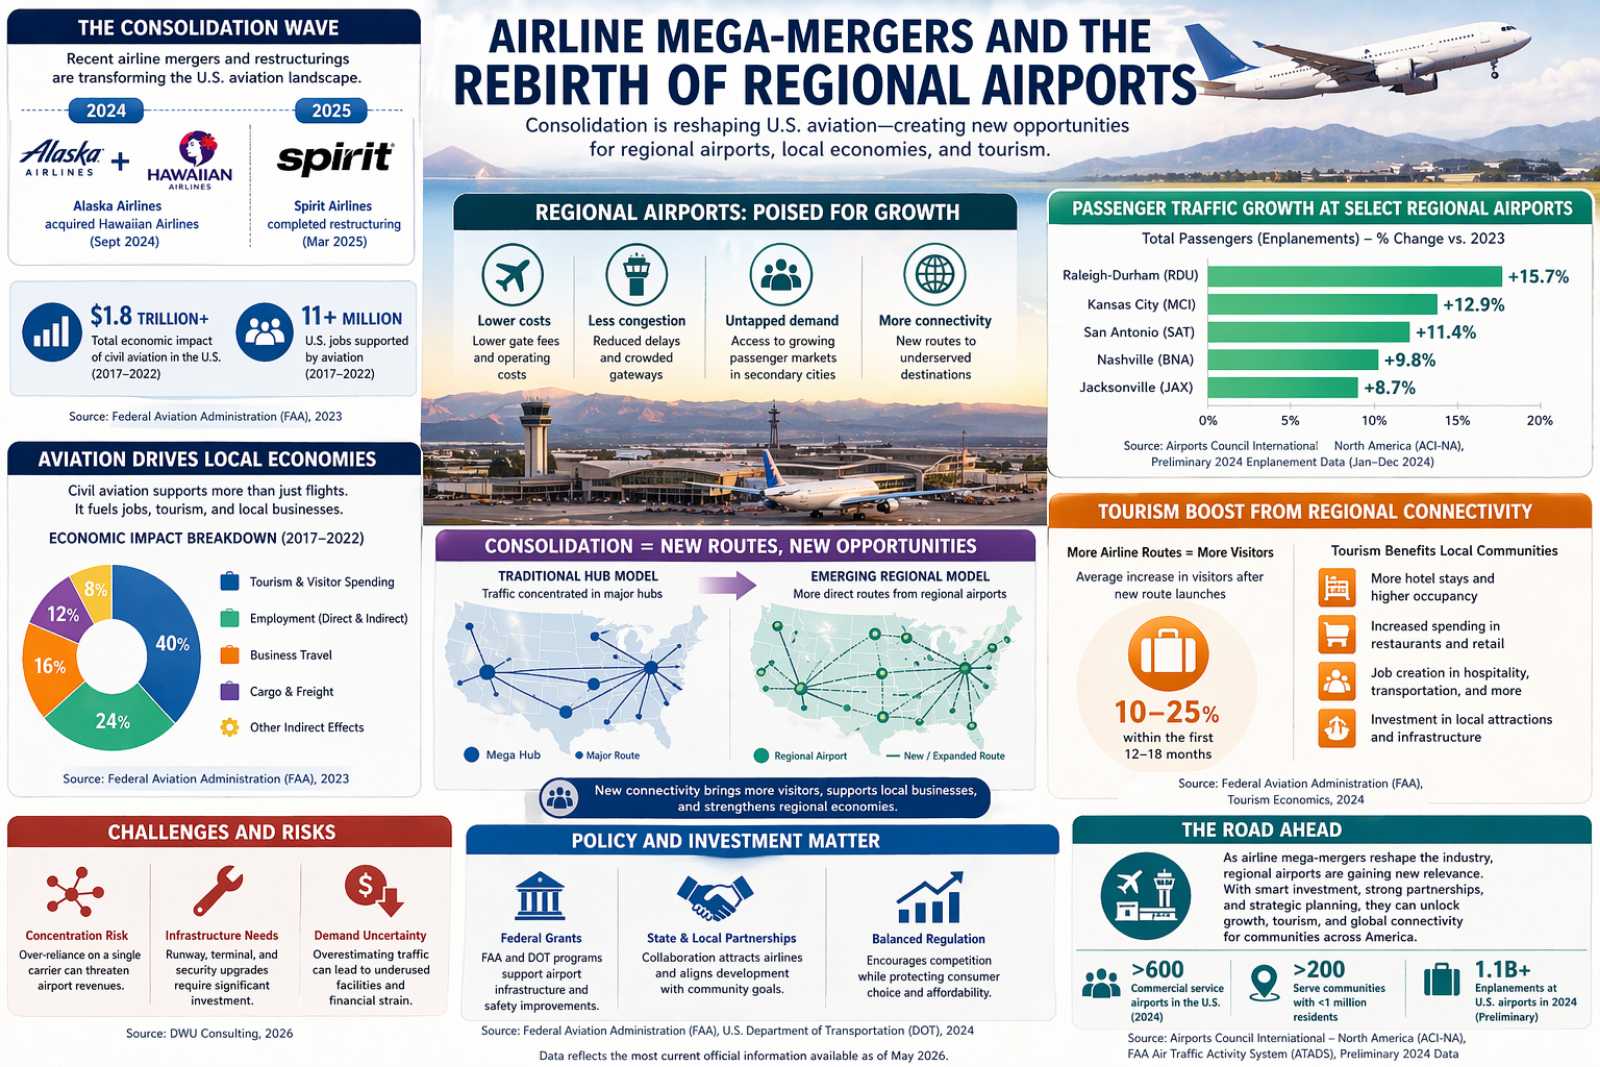
Regional Airports Poised for Growth Amid Airline Shakeups

From Fuel Shock to Factory Revival: The Surprising Rise of Hyper-Local Supply Chains in the U.S.
Technicals for PG&E Corporation


Price Summary
On 2026-04-24, PG&E Corporation's stock opened at 16.92, spiked to 17.04, declined to 16.53, and closed -1.83% lower at 16.61, with 18117942 shares traded.During the 52-week span, the stock hit a high of 19.06 and a low of 13.0.
The price outlook for PCG is between 19.0 and 28.0, with an average expectation of 22.84375, as estimated by 16 analysts.
Technicals
Support and Resistance: The price for PCG at 16.61 finds support at 16.12 and resistance at 17.34. This suggests a trading range, where 16.12 serves as a support level and 17.34 acts as a resistance point, potentially capping further gains.
Aroon: The persistent bearish trend in Aroon, with Aroon Down consistently at the 100 level, signals continued downward pressure. To gain a complete understanding of this trend, it should be explored further in conjunction with other technical indicators.

Bol. Bands: The current reading of the BOLL BANDS indicator suggests a neutral stance, with no clear signals indicating an upward or downward direction. This lack of directional bias suggests the market may be in a period of consolidation or uncertainty.

Parabolic SAR: The PSAR for PCG continues to signal a bearish stance, reinforcing a resistance level that could restrict upward movement. This resistance suggests that the market may remain under bearish pressure, with limited potential for breaking higher.

Stochastic: The Stochastic K-line's position below the D-line and under 20 points to a mildly bearish market outlook for PCG. This setup suggests some bearish sentiment, but it is not overly pronounced. Traders should remain cautious and observe the market for further confirmation.

Tripple Moving Agerage: The Tripple MOVING AVG is showing a neutral stance, not indicating a clear upward or downward trend for PG&E Corporation. This suggests a period of market balance, where neither side is showing dominance.

A company's technical data, including stock price and trading volume, can provide valuable insights when considered alongside its fundamentals. These include financial performance, market share, and growth strategy, as well as broader industry dynamics. Examining these factors helps investors or analysts make more informed decisions, as the company's fundamentals offer context for understanding how and why certain technical patterns may emerge in the market.
DISCLAIMER: We provide information and our musings based on events, but nothing on this site can be considered professional advice of any kind.
If you have enjoyed reading, spread the word:
Good prospects:
Companies with the best and the worst technicals.
Latest Regulatory Filings for SP5
Companies with the best and the worst fundamentals.

AI Data Centers Transform Small-Town USA: Jobs, Taxes, and Tech Ecosystems Explode
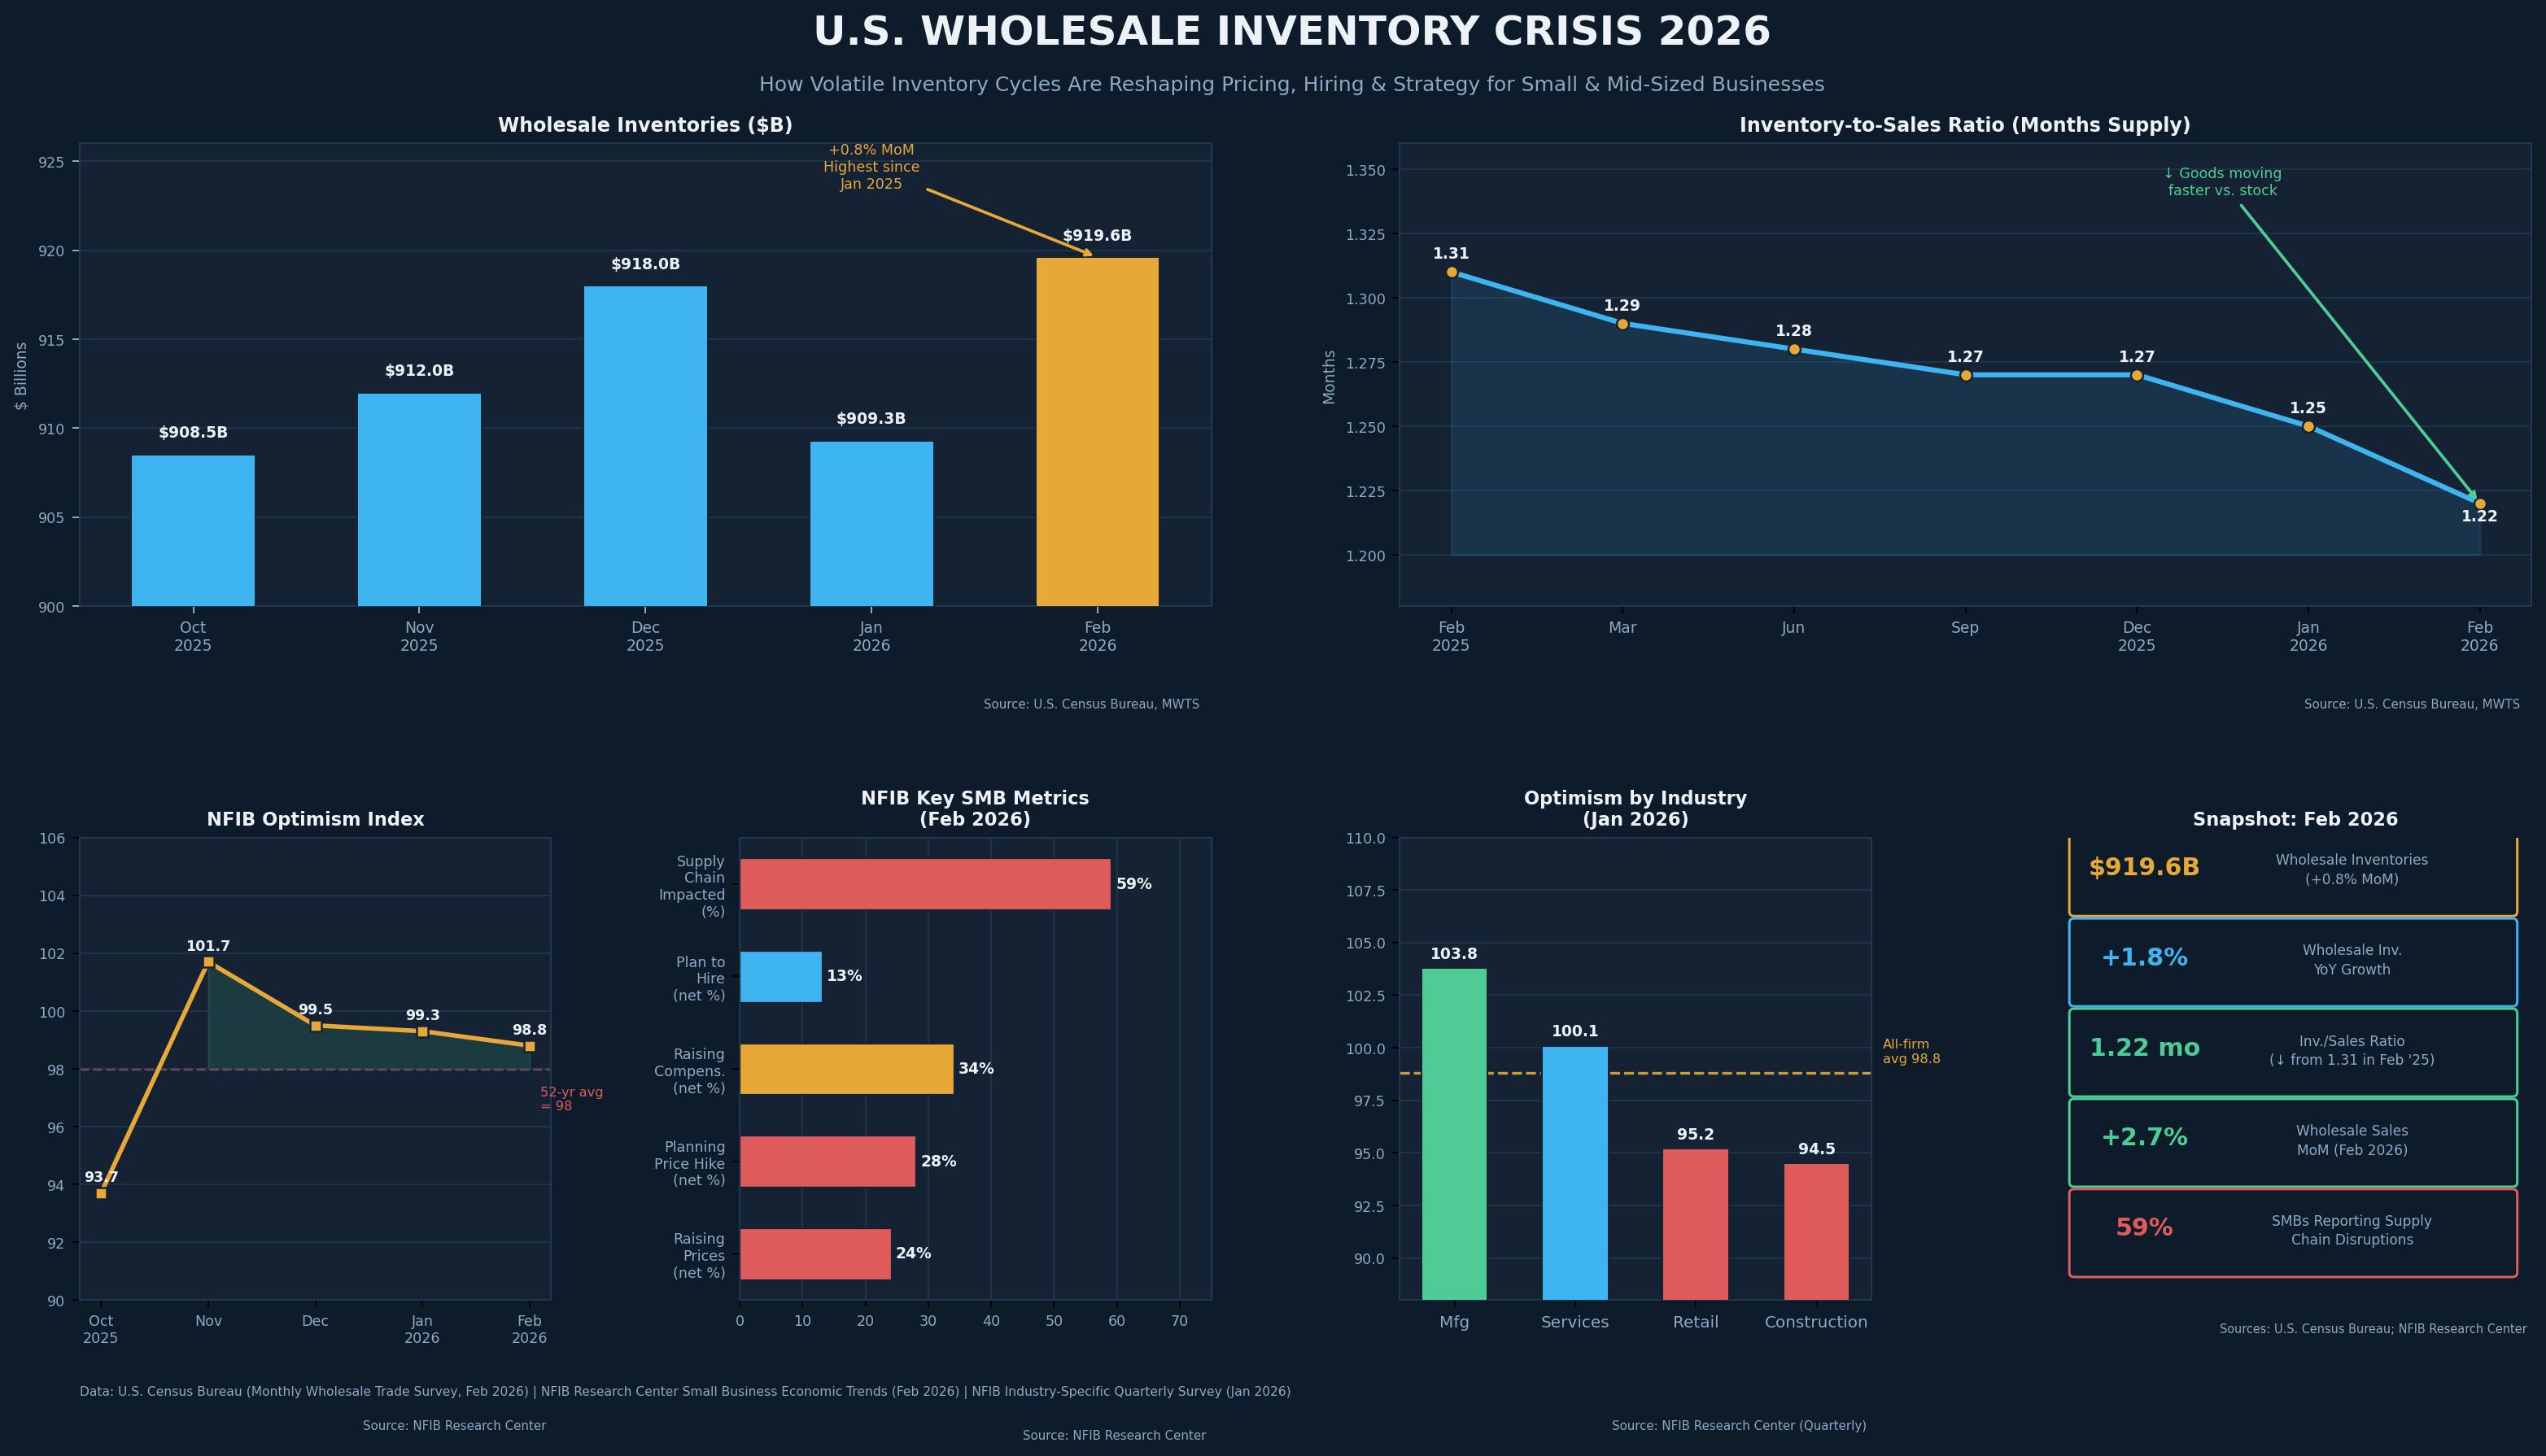
The $919 Billion Warning: What the Wholesale Inventory Explosion Really Means for Main Street

How U.S. Cities Are Turning Data and Infrastructure into Billion-Dollar Opportunities
