
More about Paycom Software, Inc.
Regulatory Filings for Paycom Software, Inc.
Fundamentals for Paycom Software, Inc.

AI Learns to Read the Federal Reserve

AI Subscriptions Rewrite the Inflation Playbook

Diversification Shielded U.S. Banks

Repo, Debt and Risk: The Fed's Untold Warning for 2026
Technicals for Paycom Software, Inc.



Price Summary
In today's trading, Paycom Software, Inc.'s stock surged by 2.37%, showcasing an robust market day.On 2026-08-20, Paycom Software, Inc.'s stock started at 221.47, soared to 227.3, dropped to 221.12, and finished the day 2.37% up at 226.72, with a trading volume of 650000 shares.
Over the past 52 weeks, the stock reached a maximum price of 230.78 and a minimum price of 0.0.
Technicals
Aroon: Aroon's bullish trend remains intact, with Aroon Up at the 100 level. This indicates strong market momentum, but a more comprehensive analysis using other indicators is required to assess the trend's strength and potential for continuation.

Bol. Bands: The BOLL BANDS is in a neutral stance for PAYC, not indicating a clear upward or downward trend. This suggests a period of market indecision, where neither bulls nor bears have the upper hand.

Parabolic SAR: The PSAR remains bullish, setting a strong support level that could underpin further upward movement. This persistent bullish outlook suggests that the market may continue its positive trajectory, with the established support acting as a safety net.

Stochastic: PAYC's stochastic indicator reflects a bullish trend, with the K-line positioned above the D-line and surpassing the 80 threshold. This setup suggests strong upward momentum, indicating that the market may continue to rise. Investors could interpret this as a positive signal for further gains.

Tripple Moving Agerage: The alignment of the 20, 50, and 100 moving averages suggests a bearish trend, but the wavering slopes of the 20 and 50 SMAs hint at a potential shift. This weakening momentum could indicate that the bearish trend for PAYC is losing steam, possibly leading to a bullish reversal in the near future. Investors should watch for signs of a market turnaround as the current downtrend shows signs of faltering.

When evaluating a company, it is crucial to examine its fundamentals, including its financial statements, management structure, and market position. Additionally, understanding the broader industry trends, competition, and regulatory landscape helps to create a well-rounded view. By assessing both the company's internal factors and the external environment in which it operates, you can extract more valuable insights from its technical performance, such as stock price movements and trading patterns.
If you have enjoyed reading, spread the word:
Good prospects:
Companies with the best and the worst technicals.
Latest Regulatory Filings for SP5
Companies with the best and the worst fundamentals.

When Losing Money Pays: America's Broken Market Logic

The Hidden Time Bomb in AI Finance
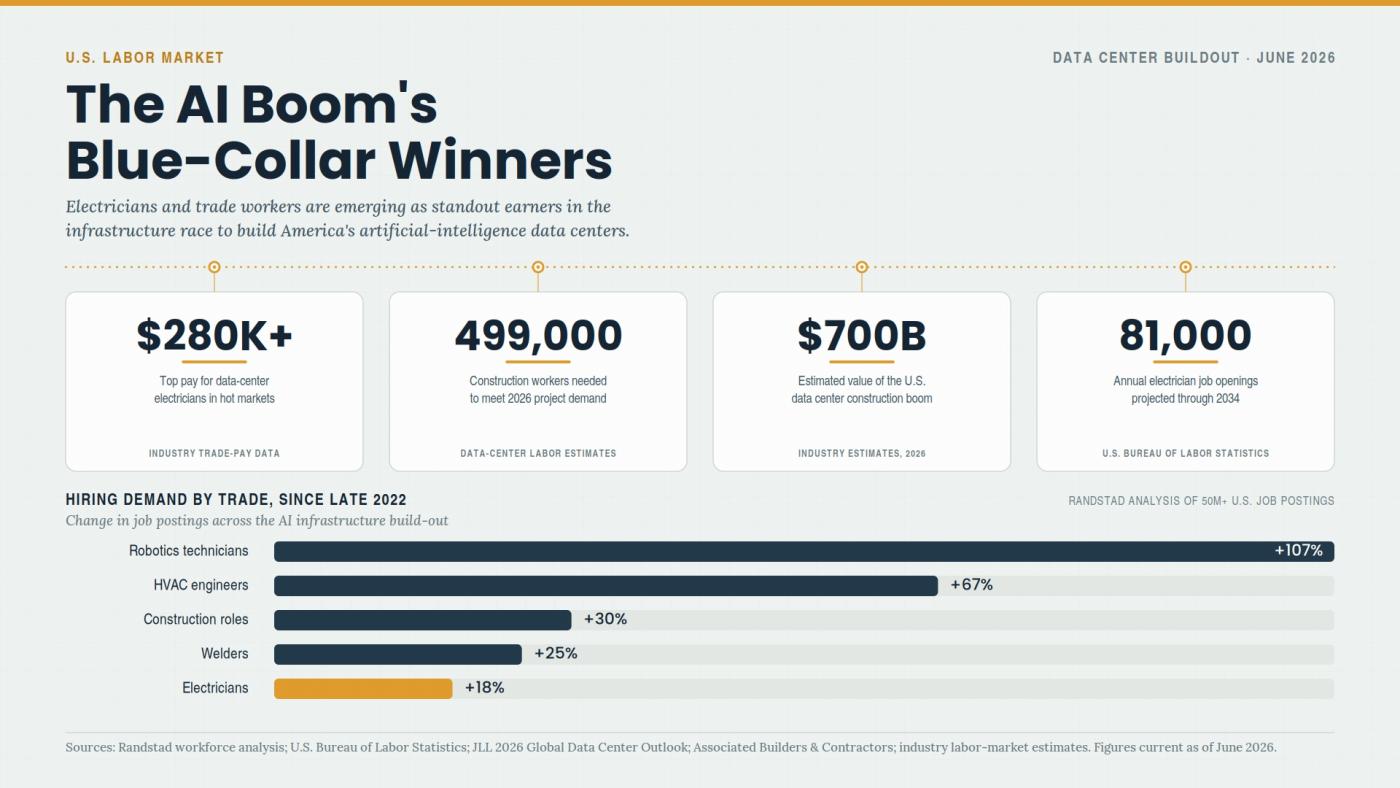
Why Electricians Now Out-Earn Software Engineers