More about Merck & Co., Inc.
Regulatory Filings for Merck & Co., Inc.
Fundamentals for Merck & Co., Inc.

Fraud, Delays, and High Fees—Gone: The Underrated Fintech Shift Reshaping U.S. Local Economies
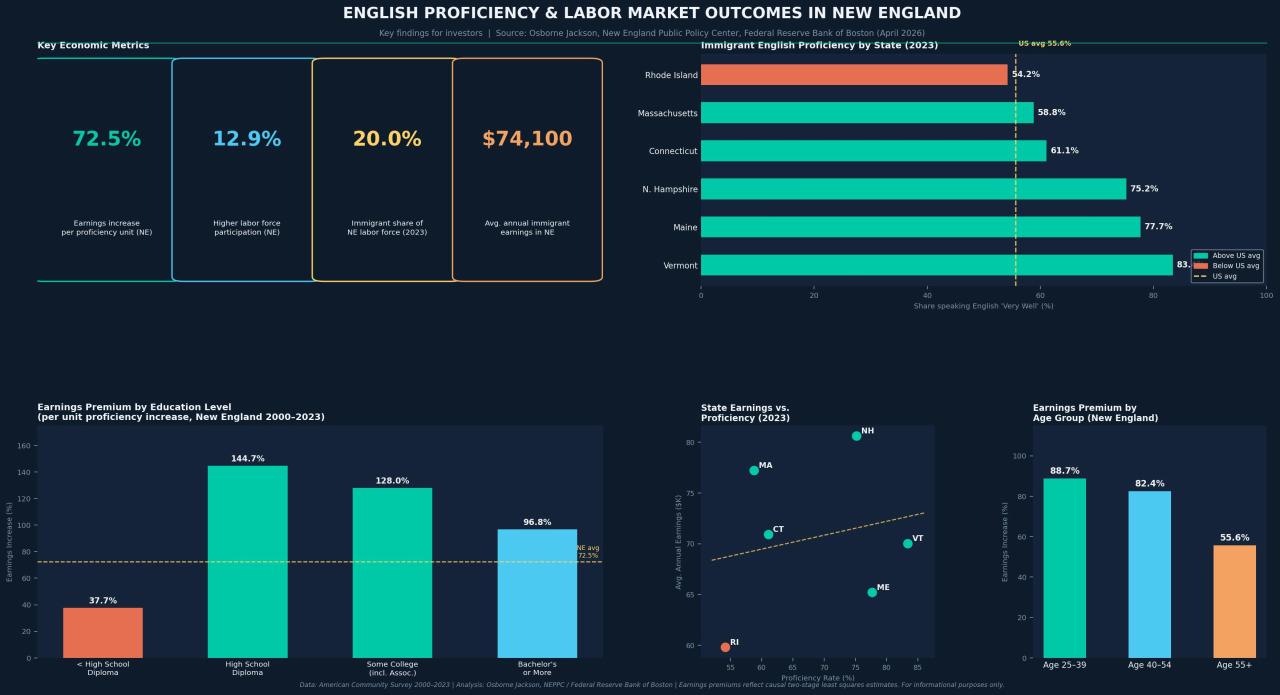
From Rhode Island to Vermont: The Proficiency Gap That's Quietly Dividing New England's Workforce

Regional Airports Poised for Growth Amid Airline Shakeups

From Fuel Shock to Factory Revival: The Surprising Rise of Hyper-Local Supply Chains in the U.S.
Technicals for Merck & Co., Inc.


*MRK makes the list of companies with the worst technicals at present.
Price Summary
On 2026-04-24, MRK's stock started at 113.74, reached a high of 114.03, fell to 111.5, and ended -1.62% down at 111.9, with 5154385 shares traded.During the 52-week span, the stock hit a high of 123.82 and a low of 73.47.
As per recommendations from 27 analysts, MRK's future price is expected to span between 100.0 and 150.0, with a mean price around 129.8148.
Technicals
Support and Resistance: The current price sits at 111.9, supported at 110.99 and capped by resistance at 117.15. These levels define a range for MRK where the price might stabilize, with 110.99 as a floor and 117.15 as a ceiling.
Aroon: Aroon's bearish trend continues, with Aroon Down holding steady at the 100 level. This suggests ongoing weakness, but further exploration with other indicators is needed to fully assess the trend's implications.

Bol. Bands: The price has fallen below the lower Bollinger Band, which may indicate that the market is oversold. This downward move suggests that selling pressure has been strong enough to push prices below a critical threshold. While this breach could mean that the bearish trend will continue, it also raises the possibility of a reversal, as traders might see this as an opportunity to buy MRK.

Parabolic SAR: The PSAR maintains a bearish outlook for MRK, establishing a key resistance level that could limit further gains. This ongoing bearish trend suggests that the market may struggle to overcome this resistance, keeping upward movement subdued.

Stochastic: With the Stochastic K-line for Merck & Co., Inc. dipping below the D-line and under 20, the current market conditions reflect a mildly bearish outlook. This positioning indicates a potential downturn, though the bearish sentiment remains moderate. Traders may want to keep an eye on this trend for additional signals before taking action.

Tripple Moving Agerage: The alignment of the 20, 50, and 100 period moving averages indicates a bearish trend, with their slopes further confirming this negative momentum. The consistent decline in these averages suggests that the market is likely to continue its bearish trajectory. This alignment and the reinforcing slopes suggest that the bearish trend is strong and likely to persist, with the market showing no signs of an imminent reversal.

A company's technical data, including stock price and trading volume, can provide valuable insights when considered alongside its fundamentals. These include financial performance, market share, and growth strategy, as well as broader industry dynamics. Examining these factors helps investors or analysts make more informed decisions, as the company's fundamentals offer context for understanding how and why certain technical patterns may emerge in the market.
DISCLAIMER: We provide information and our musings based on events, but nothing on this site can be considered professional advice of any kind.
If you have enjoyed reading, spread the word:
Good prospects:
Companies with the best and the worst technicals.
Latest Regulatory Filings for SP5
Companies with the best and the worst fundamentals.

AI Data Centers Transform Small-Town USA: Jobs, Taxes, and Tech Ecosystems Explode
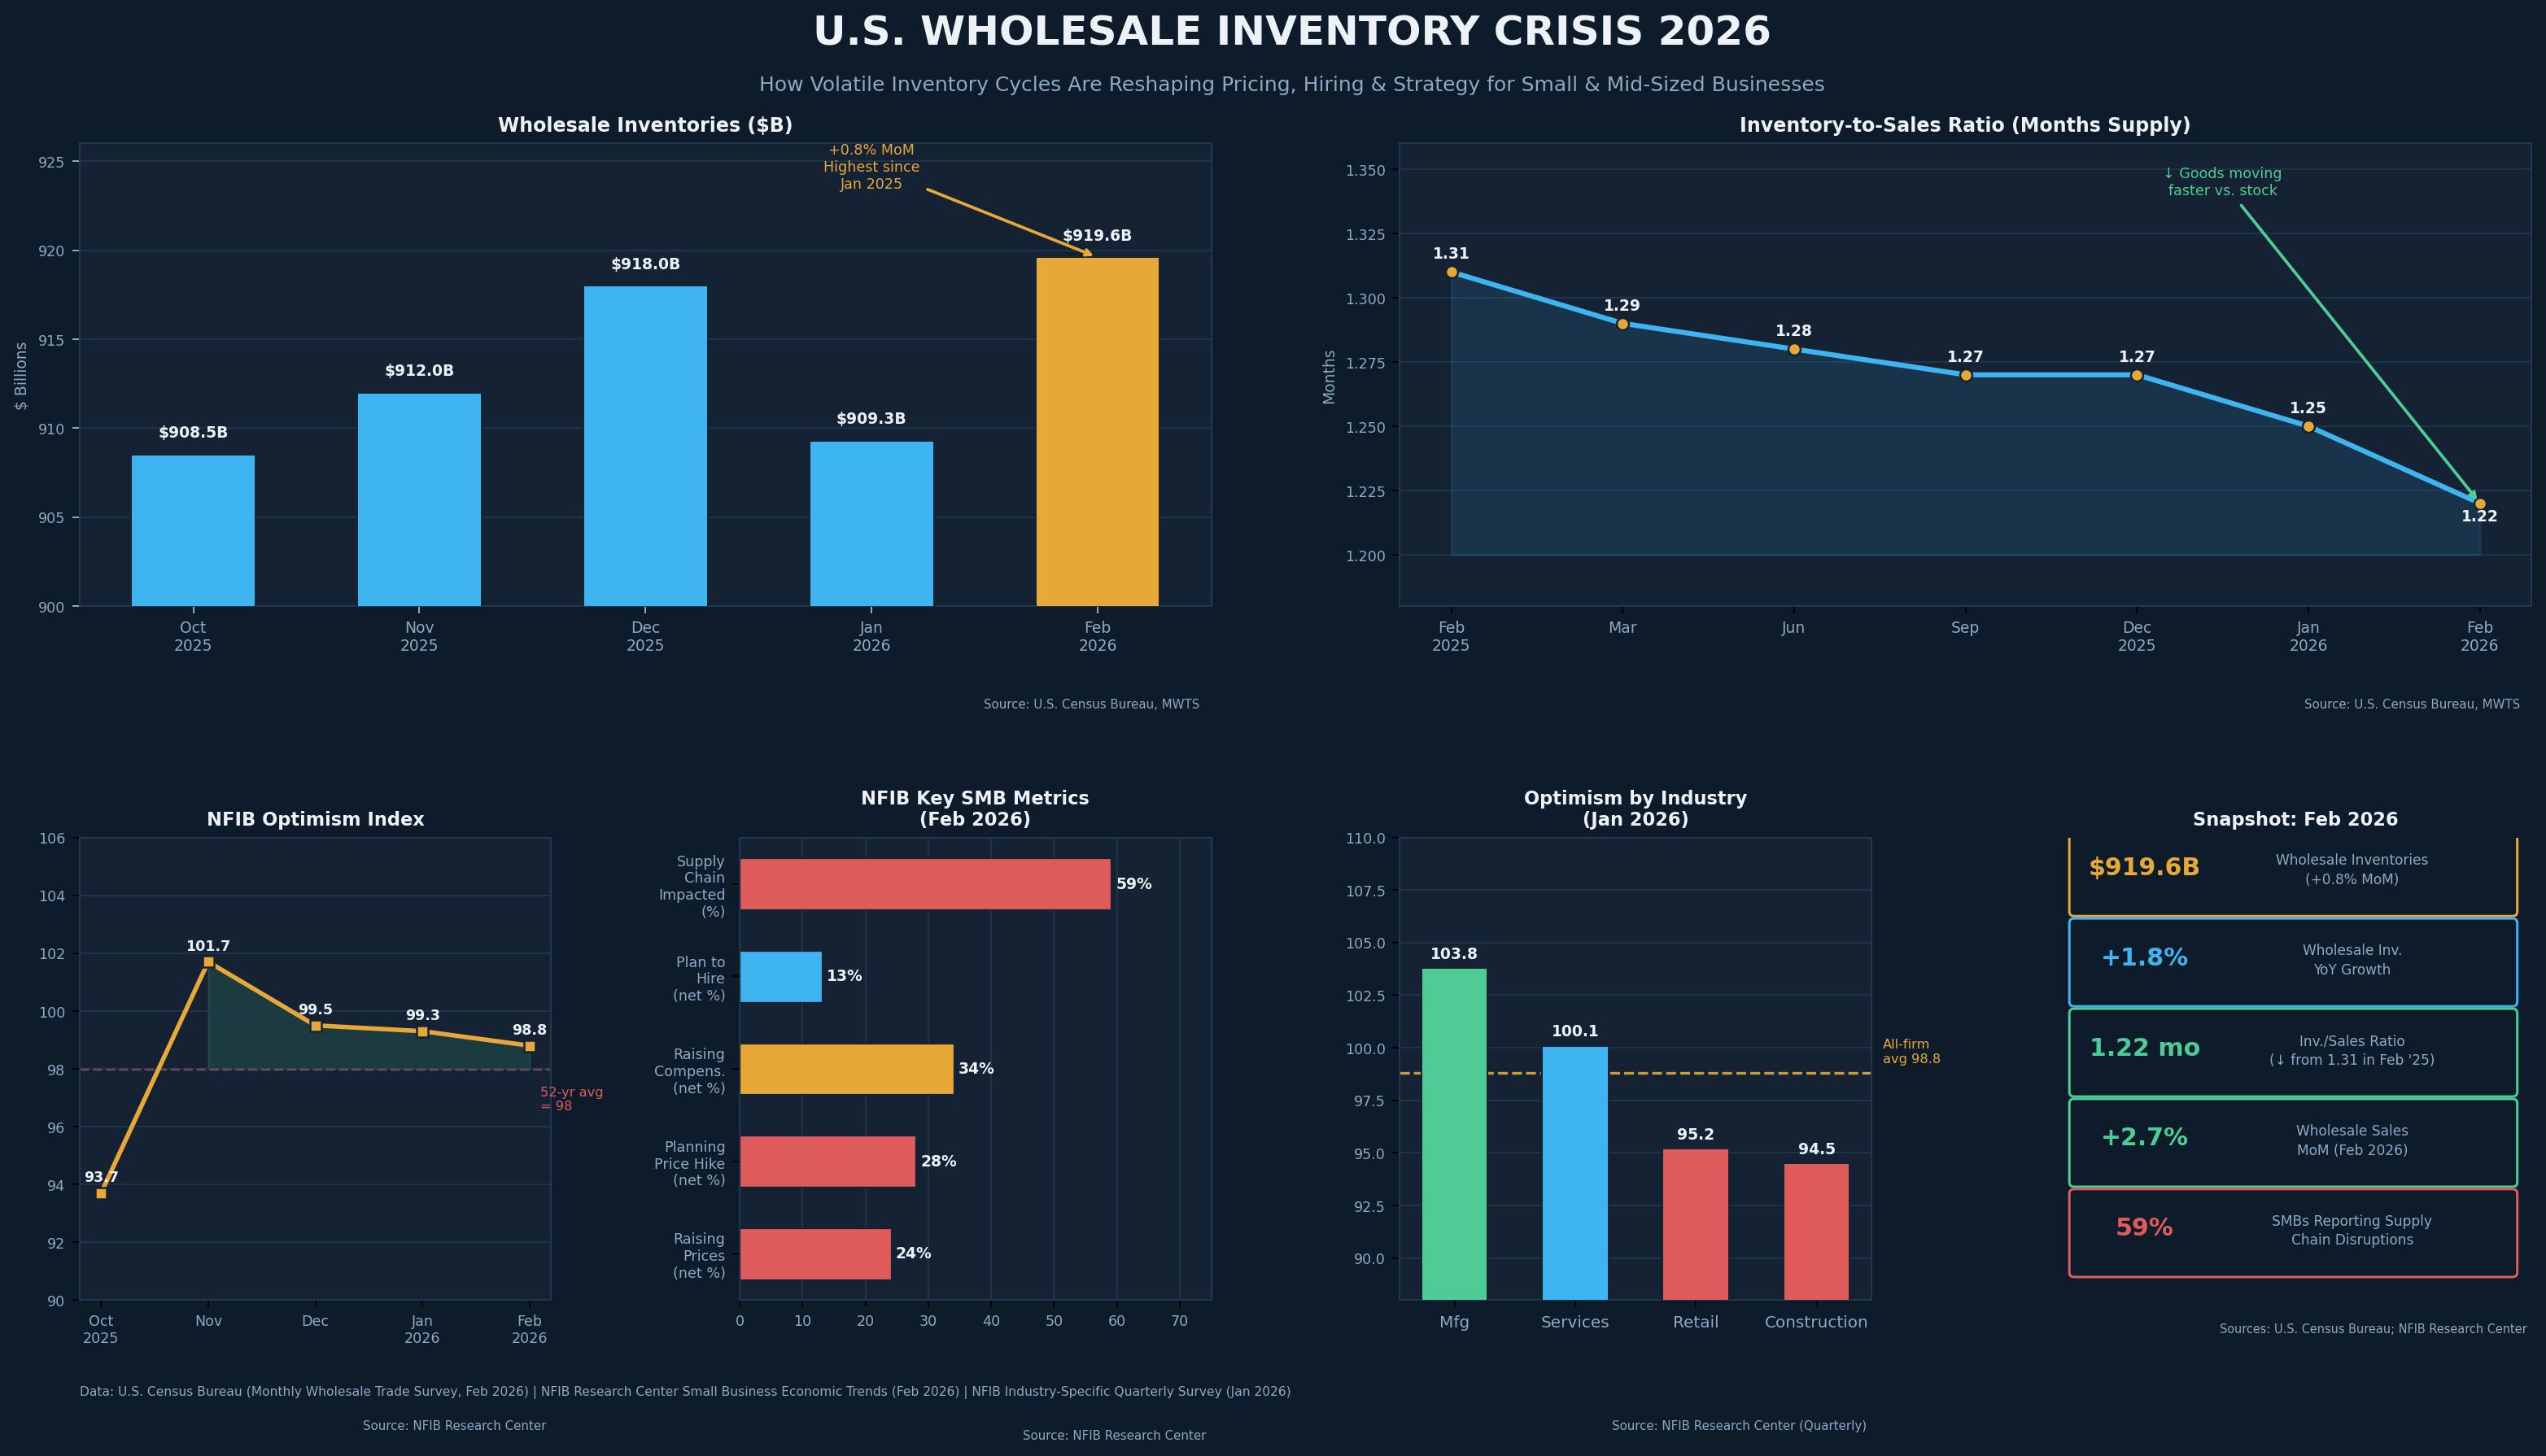
The $919 Billion Warning: What the Wholesale Inventory Explosion Really Means for Main Street

How U.S. Cities Are Turning Data and Infrastructure into Billion-Dollar Opportunities
