
More about LyondellBasell Industries N.V.
Regulatory Filings for LyondellBasell Industries N.V.
Fundamentals for LyondellBasell Industries N.V.

Diversification Shielded U.S. Banks

Repo, Debt and Risk: The Fed's Untold Warning for 2026

When Losing Money Pays: America's Broken Market Logic

The Hidden Time Bomb in AI Finance
Technicals for LyondellBasell Industries N.V.



Price Summary
On 2026-07-22, LyondellBasell Industries N.V.'s stock opened at 62.25, reached 63.28, hit a low of 62.12, and rose 0.11% to close at 62.32, with 3266268 shares traded.Over the past year, the stock's highest price was 82.38, and its lowest was 42.28.
Technicals
Support and Resistance: At 62.32, the price is supported at 57.1 and faces resistance at 69.87. This range suggests that the price for LYB might stay between these levels, with 57.1 acting as a floor and 69.87 as a ceiling.
Aroon: The continuation of Aroon's bullish trend, with Aroon Up holding at the 100 level, points to strong market momentum. However, to fully understand the trend's implications, it should be analyzed further in conjunction with other indicators.

Bol. Bands: The price for LYB is currently above the upper Bollinger Band and has stayed there since its last upward move. This could suggest strong bullish momentum, indicating that the asset is experiencing an overbought condition. Traders may see this as a sign of sustained strength, though caution is advised as extended periods above the band could lead to a potential reversal or correction.

Parabolic SAR: The PSAR maintains a bullish outlook, reinforcing a support level that could help uphold the market's upward trend. This suggests that the market is likely to continue climbing, with the support providing a solid base for further gains.

Stochastic: The stochastic indicator shows a bullish signal, with the K-line exceeding both the D-line and the 80 mark. This setup suggests strong upward momentum, implying that the market may continue to rise. Investors could consider this a favorable sign for continued market growth for LyondellBasell Industries N.V..

Tripple Moving Agerage: The current state of the Tripple MOVING AVG is neutral, offering no clear signals of movement in either direction. This suggests a potential pause in market activity, with no strong trend emerging at the moment.

A comprehensive approach to analyzing a company requires considering both its technical and fundamental aspects. The company's fundamentals, such as its earnings, growth prospects, and financial health, provide a strong foundation for understanding technical indicators. Additionally, examining the industry it operates in helps contextualize the company's position within the broader market. By integrating these factors, one can gain more valuable insights into the company's stock performance and potential investment opportunities.
If you have enjoyed reading, spread the word:
Good prospects:
Companies with the best and the worst technicals.
Latest Regulatory Filings for SP5
Companies with the best and the worst fundamentals.
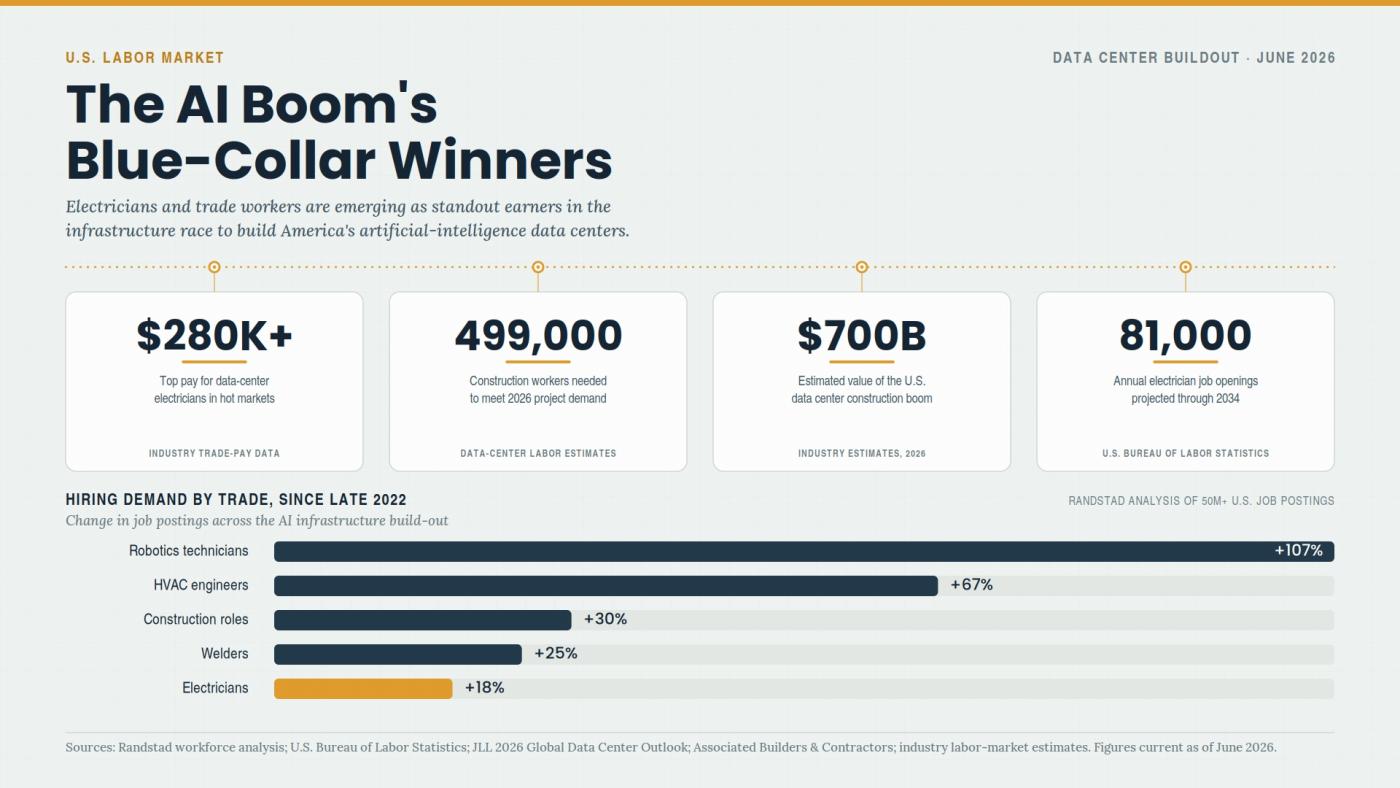
Why Electricians Now Out-Earn Software Engineers
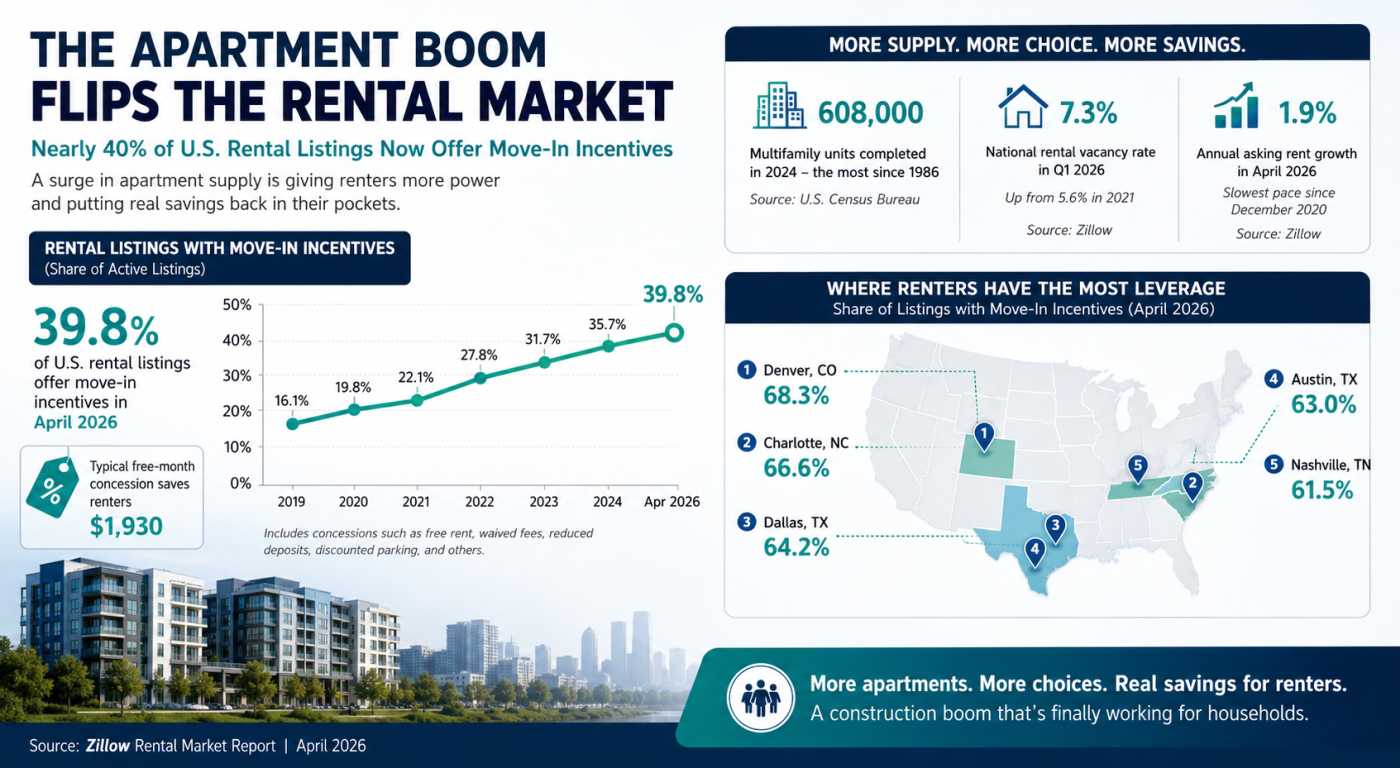
The Apartment Glut Changing America’s Rental Market
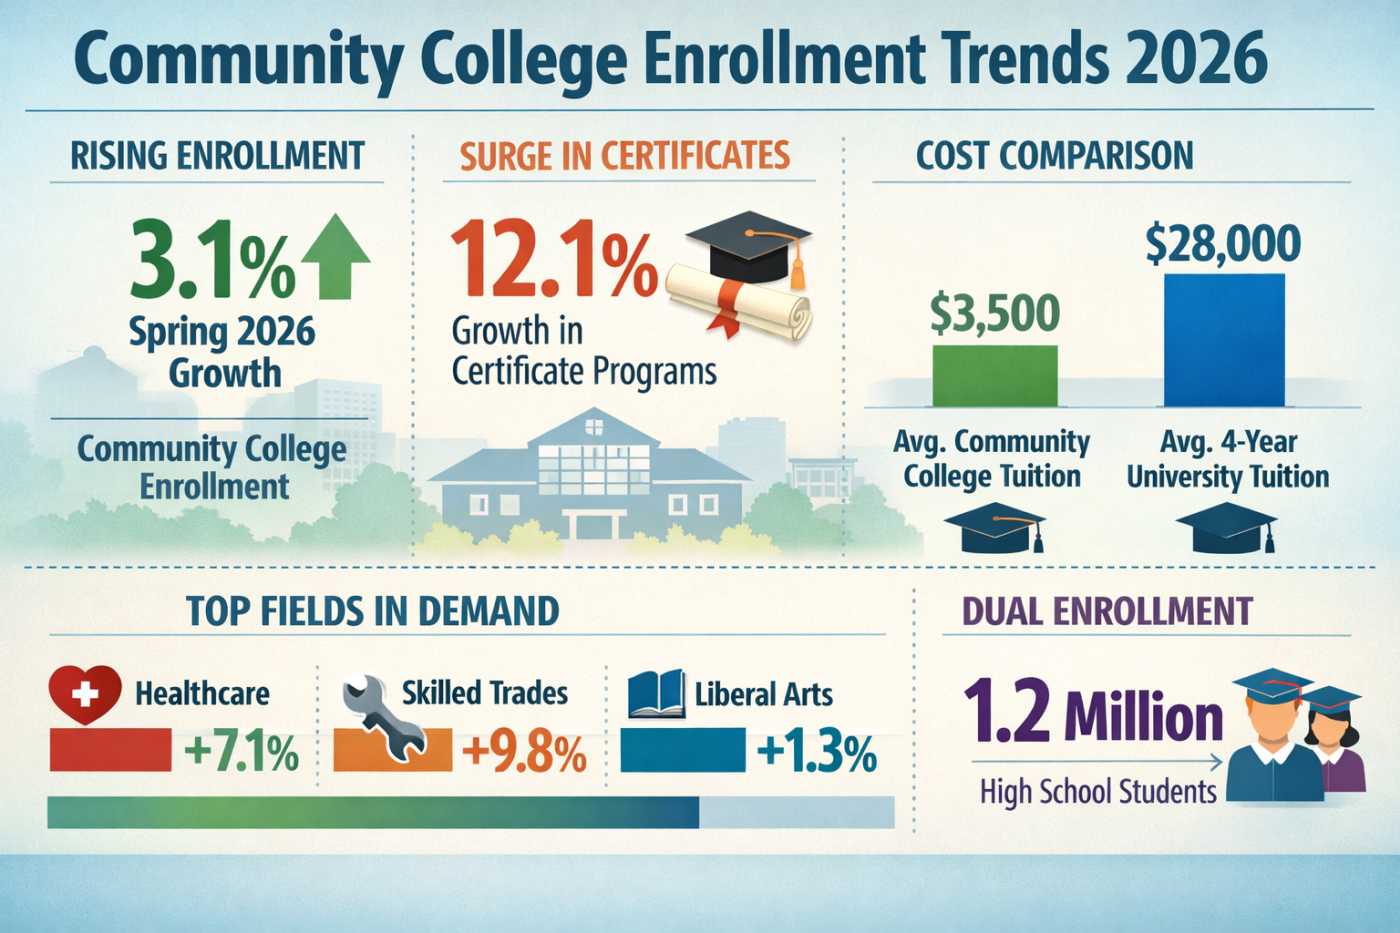
Why Community Colleges Are Winning Again