Fundamentals for Jacobs Solutions Inc.
J's Forward PE being in a reasonable range suggests the stock is fairly priced based on its earnings. The stock isn't overpriced, leaving room for growth, making it an attr...






Business Operations:
Sector: IndustrialsIndustry: Engineering & Construction
Jacobs Solutions Inc. engages in the infrastructure and advanced facilities, and consulting businesses in the United States, Europe, Canada, India, Asia, Australia, New Zealand, the Middle East, and Africa. The company provides consulting, planning, architecture, design, engineering, and infrastructure delivery services including project, program, and construction management and long-term operation of facilities. It also offers consulting services for consumer and manufacturing, defense and security, energy and utilities, financial services, government, health and life sciences, and transport sectors. The company was founded in 1947 and is headquartered in Dallas, Texas.
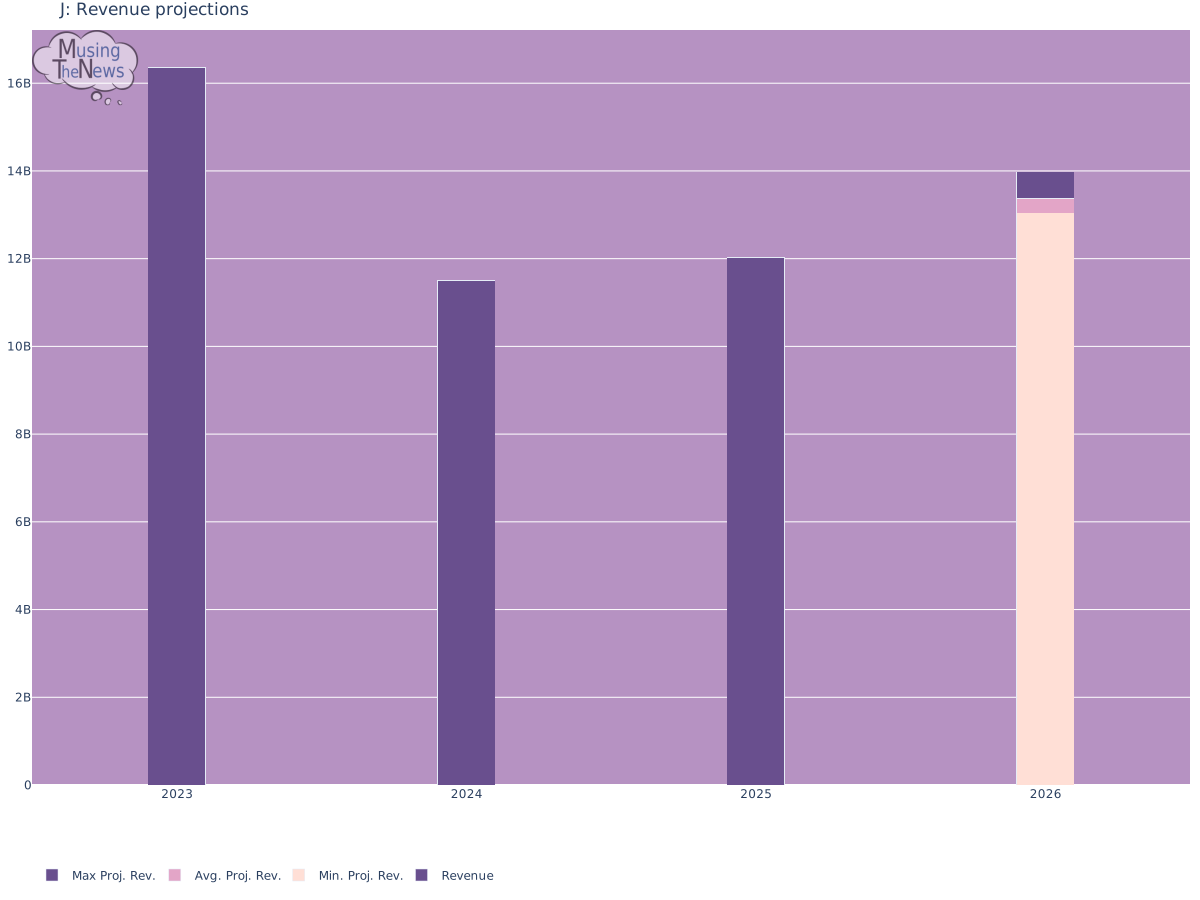
Revenue projections:
Financial Ratios:
| currentRatio | 1.287000 |
|---|---|
| forwardPE | 16.700172 |
| debtToEquity | 124.734000 |
| earningsGrowth | -0.254000 |
| revenueGrowth | 0.345000 |
| grossMargins | 0.220670 |
| operatingMargins | 0.073870 |
| trailingEps | 3.010000 |
| forwardEps | 8.266980 |
Jacobs Solutions Inc.'s current ratio being 1.287 suggests the company will have no issues paying off its short-term debt. With sufficient cash reserves and current assets, Jacobs Solutions Inc. can easily cover its immediate liabilities, reflecting solid financial health.
J's Forward PE being in a reasonable range suggests the stock is fairly priced based on its earnings. The stock isn't overpriced, leaving room for growth, making it an attractive investment for those seeking opportunities for future value appreciation.
J's high debt-to-equity ratio signals that the company is heavily leveraged. This suggests J may be relying more on debt than equity to finance its operations, which could expose the company to greater financial risk in challenging economic conditions.
J's low growth in both earnings and revenue indicates a likely decrease in profits. This suggests the company may be facing financial challenges, and investors should be cautious about its future performance.
Jacobs Solutions Inc.'s negative gross and operating margins point to financial difficulties, as the company is unable to generate profit from its core operations or production. This could signal broader problems in cost management or declining sales.
Jacobs Solutions Inc.'s forward EPS surpassing its trailing EPS signals that the company is anticipated to be more profitable this year than last. This growth expectation highlights Jacobs Solutions Inc.'s potential for increased earnings and a stronger financial performance in the upcoming year.
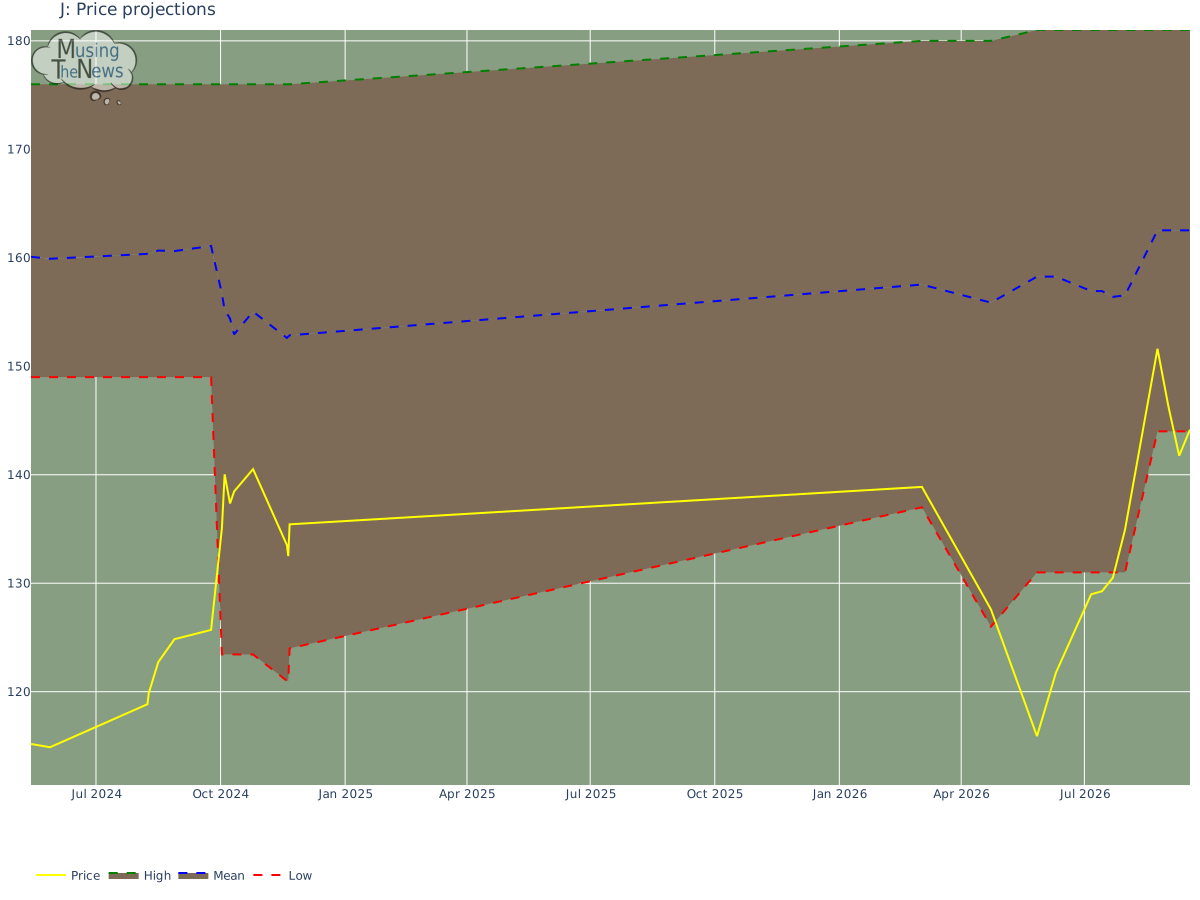
Price projections:
Insider Transactions:
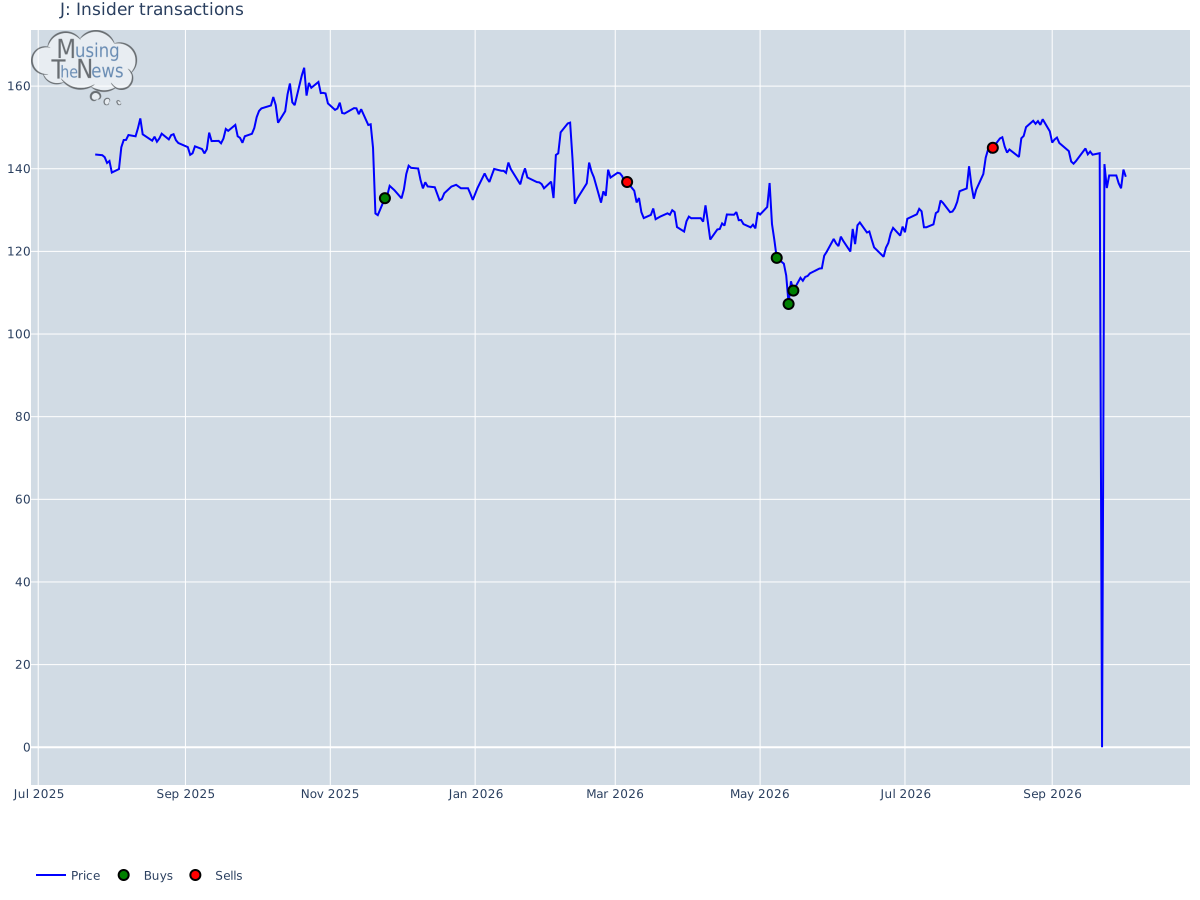
2 J sales were executed, with market price at 140.93000030517578.There were 4 buy transactions of Jacobs Solutions Inc., with market price at 117.26999855041504.The trend of more sells than buys around J's current price levels suggests possible weakness. If this pattern continues, it could lead to additional price declines, as selling pressure might increase, signaling investor concerns.
Recommendation changes over time:
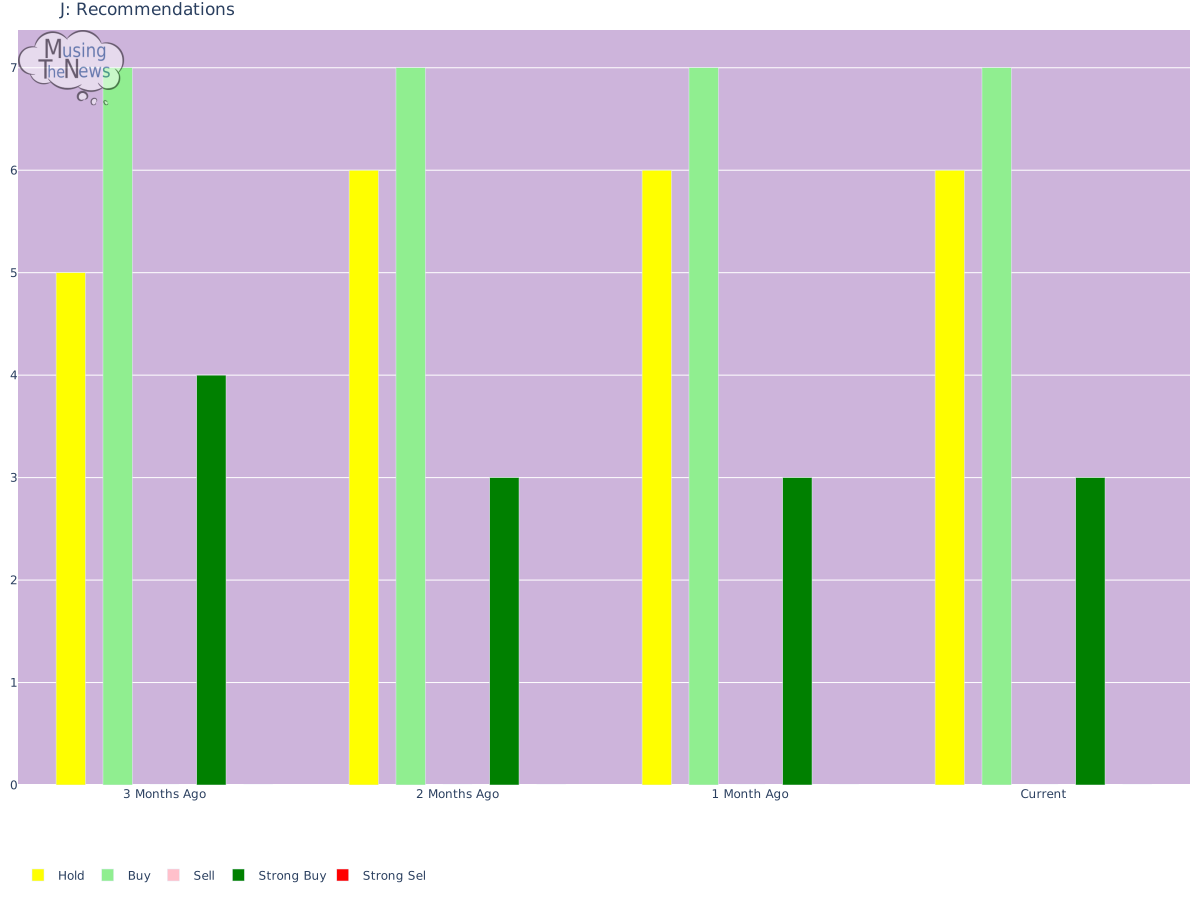
Analysts are favoring J with a buy bias, highlighting the stock's potential as a solid investment. This recommendation might drive more investors to consider J as a secure and profitable option for their money, contributing to a broader positive sentiment in the market.





