More about Intel Corporation
Regulatory Filings for Intel Corporation
Fundamentals for Intel Corporation
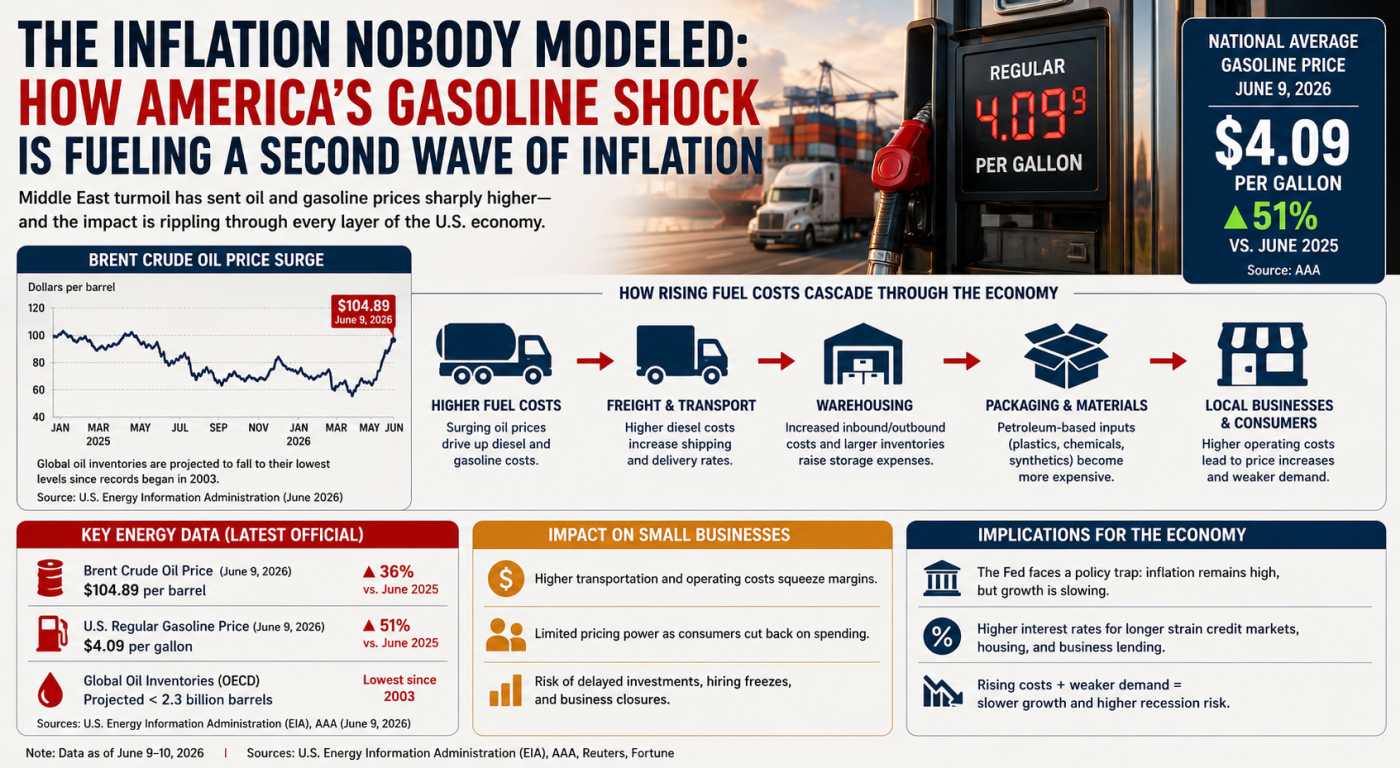
The Inflation Wave the Fed Can't Navigate

The Biggest IPO Year Ever: Can Markets Absorb It?

The Jobs Report That Crashed the Rally

The Fed Study Revealing Tomorrow's Investment Themes
Technicals for Intel Corporation


Price Summary
Intel Corporation's stock saw a 3.08% climb, showcasing an fantastic market day.Intel Corporation's stock started trading at 113.46 on 2026-06-11, climbed to 119.44, fell to 110.51, and closed 3.08% higher at 116.96, with 184349981 shares traded.
The stock reached its highest price of 129.44 and its lowest price of 19.31 during the 52-week period.
Technicals
Support and Resistance: The price currently sits at 116.96, finding support at 68.5 and resistance at 123.52. These levels define a range for Intel Corporation where the price may move, with 68.5 offering a base and 123.52 limiting upward momentum.
Aroon: The AROON is showing a neutral stance, not indicating a clear upward or downward trend for Intel Corporation. This suggests a period of market balance, where neither side is showing dominance.

Bol. Bands: The BOLL BANDS is currently in a neutral position, offering no clear indication of movement up or down. This suggests that the market may be experiencing a period of equilibrium, with no strong trend in play.

Parabolic SAR: The PSAR maintains a bearish outlook for INTC, establishing a key resistance level that could limit further gains. This ongoing bearish trend suggests that the market may struggle to overcome this resistance, keeping upward movement subdued.

Stochastic: The STOCHASTIC is currently neutral, showing no clear bias toward a rising or falling trend. This lack of directional clarity suggests that the market may be in a holding pattern, awaiting further developments.

Tripple Moving Agerage: The Tripple MOVING AVG is currently neutral, offering no clear guidance on market direction. This suggests that the market may be in a state of pause, with no strong trend emerging.

Understanding a company's fundamentals—such as revenue, earnings, and debt levels—provides a solid foundation for analyzing its technical performance. Similarly, knowledge of the industry, including key competitors and market trends, is critical. Combining this fundamental analysis with technical indicators like stock charts, moving averages, and trading volume enables a more comprehensive approach to evaluating the company's overall health and potential future performance.
If you have enjoyed reading, spread the word:
Good prospects:
Companies with the best and the worst technicals.
Latest Regulatory Filings for SP5
Companies with the best and the worst fundamentals.

America’s Empty Offices Hit Pensions Hard

Rural Hospitals Buckle Under Private Equity

Fake Brokers, Spoofed GPS: Who Pays for Cargo Crime?
