More about International Business Machines Corporation
Regulatory Filings for International Business Machines Corporation
Fundamentals for International Business Machines Corporation

Fraud, Delays, and High Fees—Gone: The Underrated Fintech Shift Reshaping U.S. Local Economies
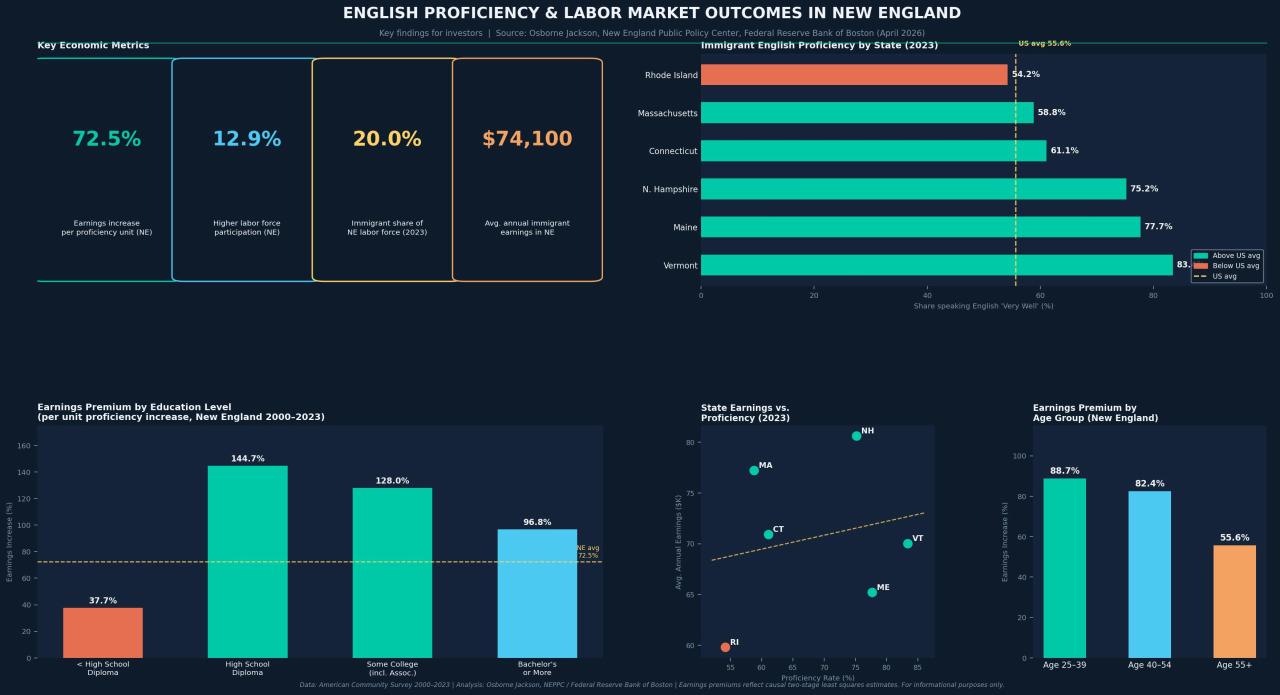
From Rhode Island to Vermont: The Proficiency Gap That's Quietly Dividing New England's Workforce
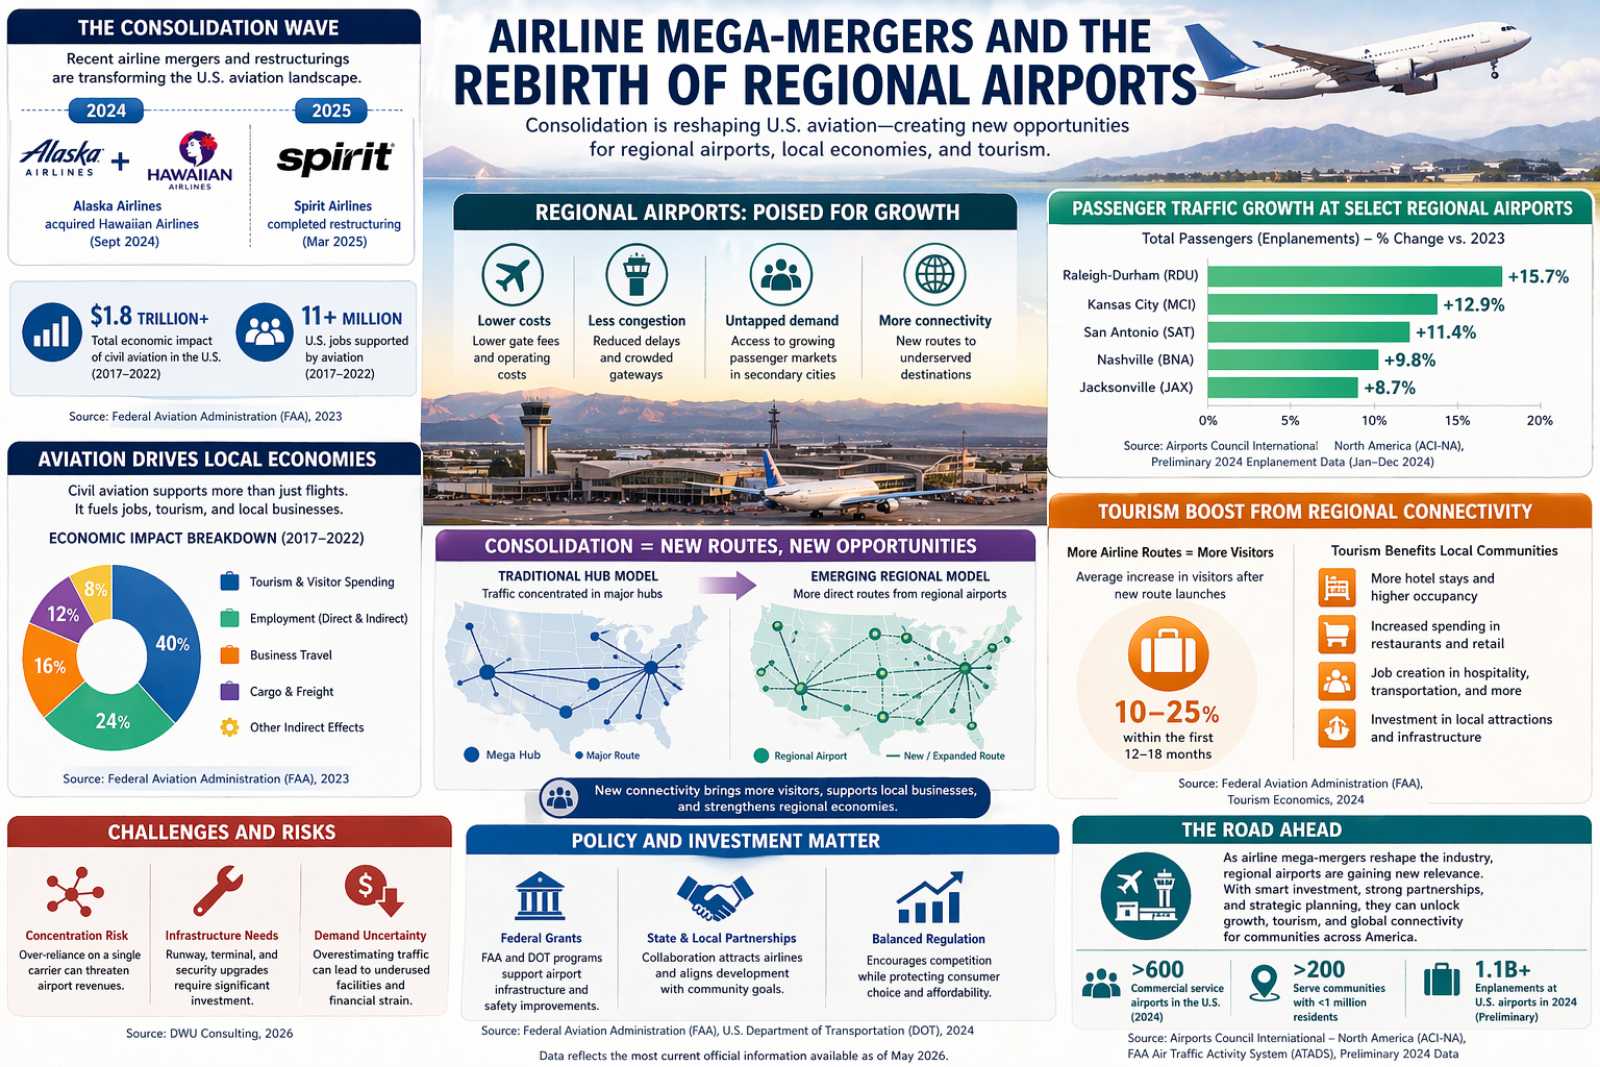
Regional Airports Poised for Growth Amid Airline Shakeups

From Fuel Shock to Factory Revival: The Surprising Rise of Hyper-Local Supply Chains in the U.S.
Technicals for International Business Machines Corporation


Price Summary
On 2026-04-24, IBM's stock opened at 231.93, reached a peak of 232.8, dropped to 225.0, and ended 0.02% up at 231.98, with a volume of 8976762 shares.Over the course of 52 weeks, the stock peaked at 314.98 and hit a low of 223.35.
IBM's future price is expected to lie between 215.0 and 390.0, with an average expectation of 296.3265, as per the recommendations of 20 analysts.
Technicals
Support and Resistance: The current price for IBM is 231.98, supported at 230.76 with resistance at 239.37. This indicates a trading range where 230.76 might prevent further declines, while 239.37 could hinder additional gains.
Aroon: The current reading of the AROON is neutral for IBM, with no clear signals for an upward or downward trend. This indicates that the market may be in a state of uncertainty, with no dominant force driving the direction.

Bol. Bands: The current reading of the BOLL BANDS is neutral, offering no clear signals for a movement in either direction. This suggests that the market may be in a holding pattern, with no dominant trend in place.

Parabolic SAR: The PSAR maintains a bearish stance, establishing a resistance level that could act as a barrier to any upward trends. This ongoing bearish outlook suggests that the market may continue to face resistance, keeping prices in check.

Stochastic: The current state of the STOCHASTIC is neutral, providing no clear signals for either an upward or downward movement. This indicates that the market may be in a state of equilibrium, with no strong momentum in either direction.

Tripple Moving Agerage: The Tripple MOVING AVG is showing a neutral reading, with no clear direction indicated for upward or downward movement. This neutral position suggests a possible period of consolidation.

A thorough analysis of a company involves looking beyond its stock price movements and trading patterns. You must also examine its fundamentals, which include profitability, growth prospects, and competitive advantages. Additionally, the industry in which the company operates provides important context, as factors like technological innovations, regulation, and market demand influence performance. By integrating this information with technical analysis, more accurate predictions about the company's future can be made.
DISCLAIMER: We provide information and our musings based on events, but nothing on this site can be considered professional advice of any kind.
If you have enjoyed reading, spread the word:
Good prospects:
Companies with the best and the worst technicals.
Latest Regulatory Filings for SP5
Companies with the best and the worst fundamentals.

AI Data Centers Transform Small-Town USA: Jobs, Taxes, and Tech Ecosystems Explode
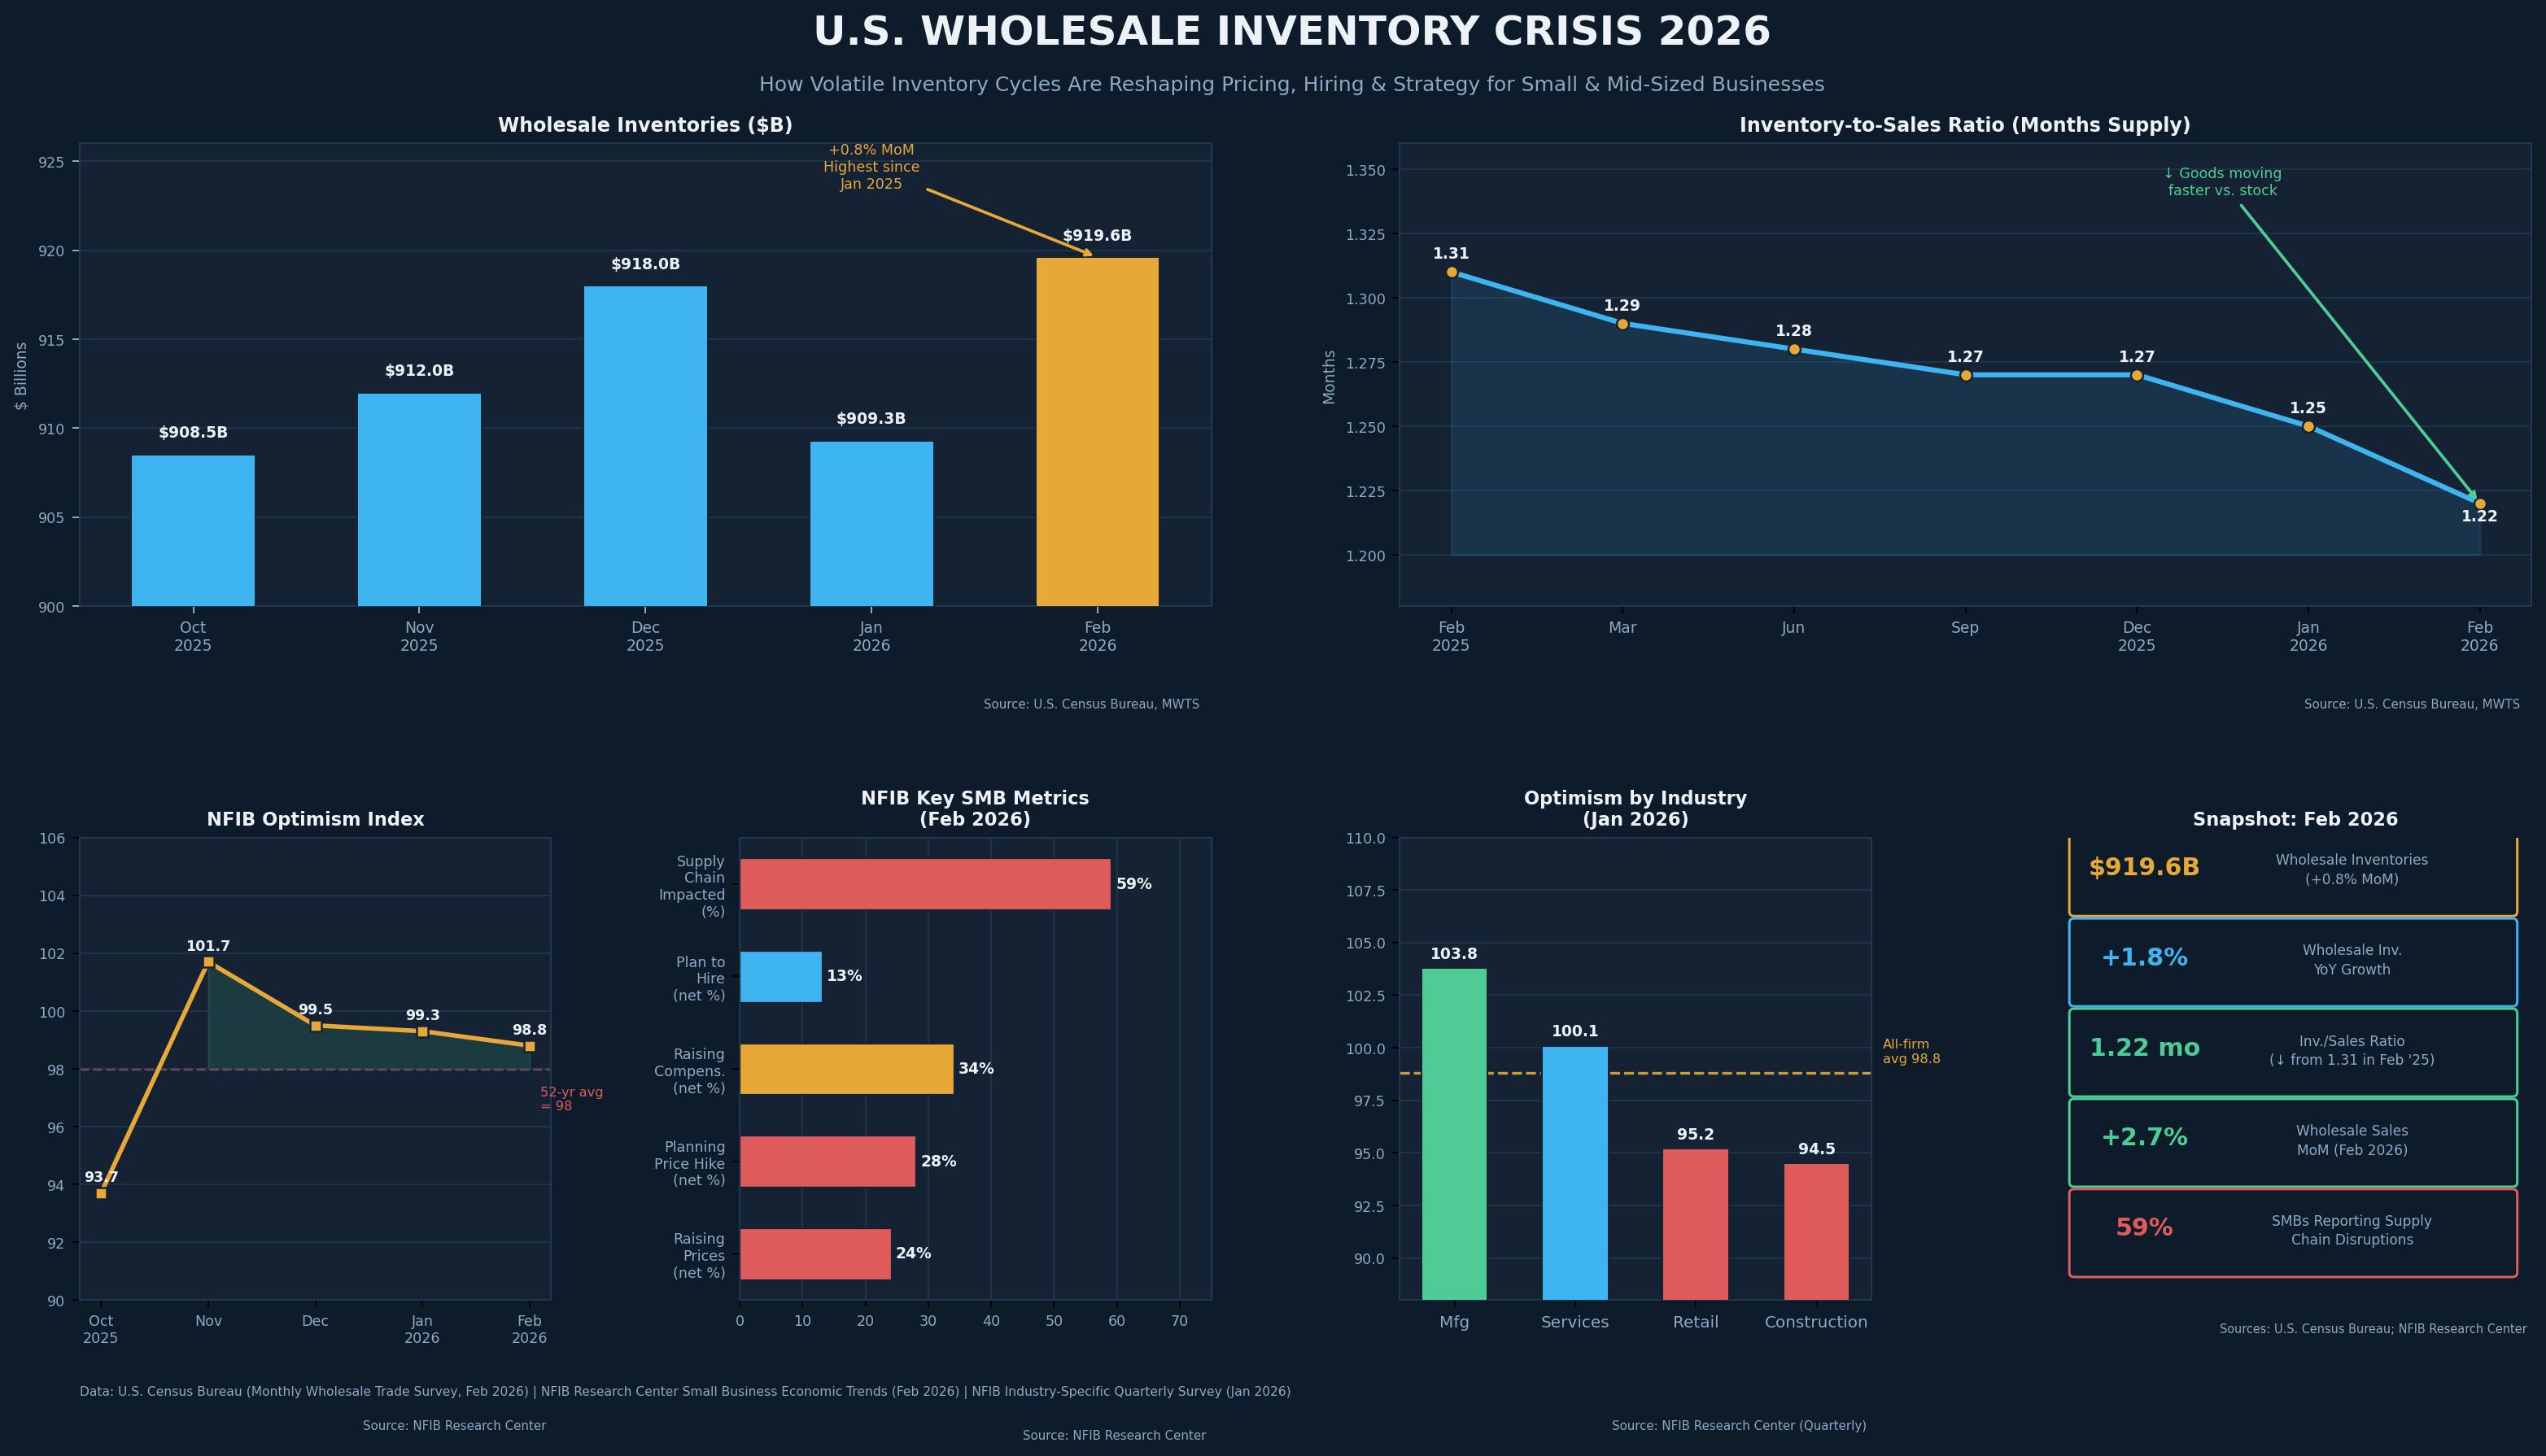
The $919 Billion Warning: What the Wholesale Inventory Explosion Really Means for Main Street

How U.S. Cities Are Turning Data and Infrastructure into Billion-Dollar Opportunities
