Fundamentals for Interactive Brokers Group, Inc.
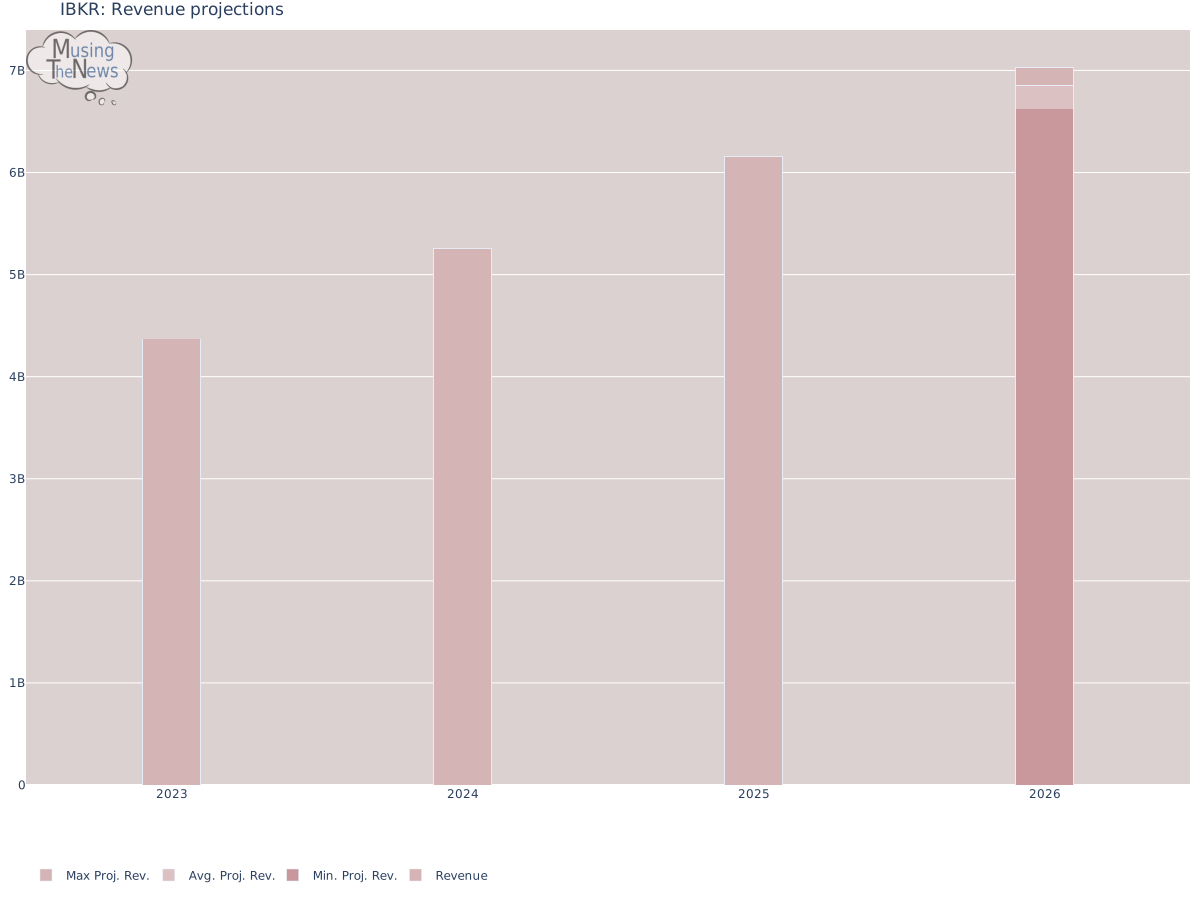
IBKR's revenue is forecasted to dip below last year's figures, raising concerns for investors who are typically wary of declining financial performance. Such drops can dire...






Business Operations:
Sector: Financial ServicesIndustry: Capital Markets
Interactive Brokers Group, Inc. operates as an automated electronic broker in the United States and internationally. The company engages in the execution, clearance, and settlement of trades in stocks, options, futures, foreign exchange instruments, bonds, mutual funds, exchange traded funds (ETFs), precious metals, and cryptocurrencies. It also offers custody and service accounts for hedge and mutual funds, ETFs, registered investment advisors, proprietary trading groups, introducing brokers, and individual investors. In addition, the company provides custody, prime brokerage, securities, and margin lending services. It serves institutional and individual customers through electronic exchanges and market centers. Interactive Brokers Group, Inc. was founded in 1977 and is headquartered in Greenwich, Connecticut.
Revenue projections:
Financial Ratios:
| currentRatio | 1.093000 |
|---|---|
| forwardPE | 27.587715 |
| debtToEquity | 205.748000 |
| earningsGrowth | 0.353000 |
| revenueGrowth | 0.263000 |
| grossMargins | 0.930360 |
| operatingMargins | 0.765330 |
| trailingEps | 2.520000 |
| forwardEps | 3.200700 |
IBKR's current ratio being 1.093 shows it has more than enough assets to cover its short-term debts. The company's liquidity position is strong, with ample cash reserves available to meet its immediate financial obligations without strain.
IBKR's Forward PE is within a good range, showing that the stock price compares well to its earnings. This suggests it isn't overpriced and leaves room for growth, making the stock appealing to investors looking for value and growth opportunities.
IBKR's high debt-to-equity ratio indicates the company is using significant leverage, relying more on debt to finance its operations. This can lead to higher risk, especially if profitability falters or economic conditions worsen.
Interactive Brokers Group, Inc.'s positive earnings and revenue growth reflect a strong outlook for the company's business expansion. The company is expected to continue growing, with increasing profitability and sales driving further growth in the near future.
IBKR's positive gross and operating margins indicate that the company is performing profitably. These margins reflect efficient cost control and revenue generation, signaling a strong financial foundation for continued success.
IBKR's forward EPS surpassing its trailing EPS signals projected growth in profitability, with the company expected to perform better this year. This forecast suggests that IBKR's earnings will improve compared to the previous financial year, highlighting optimism in its financial outlook.
Price projections:
Insider Transactions:
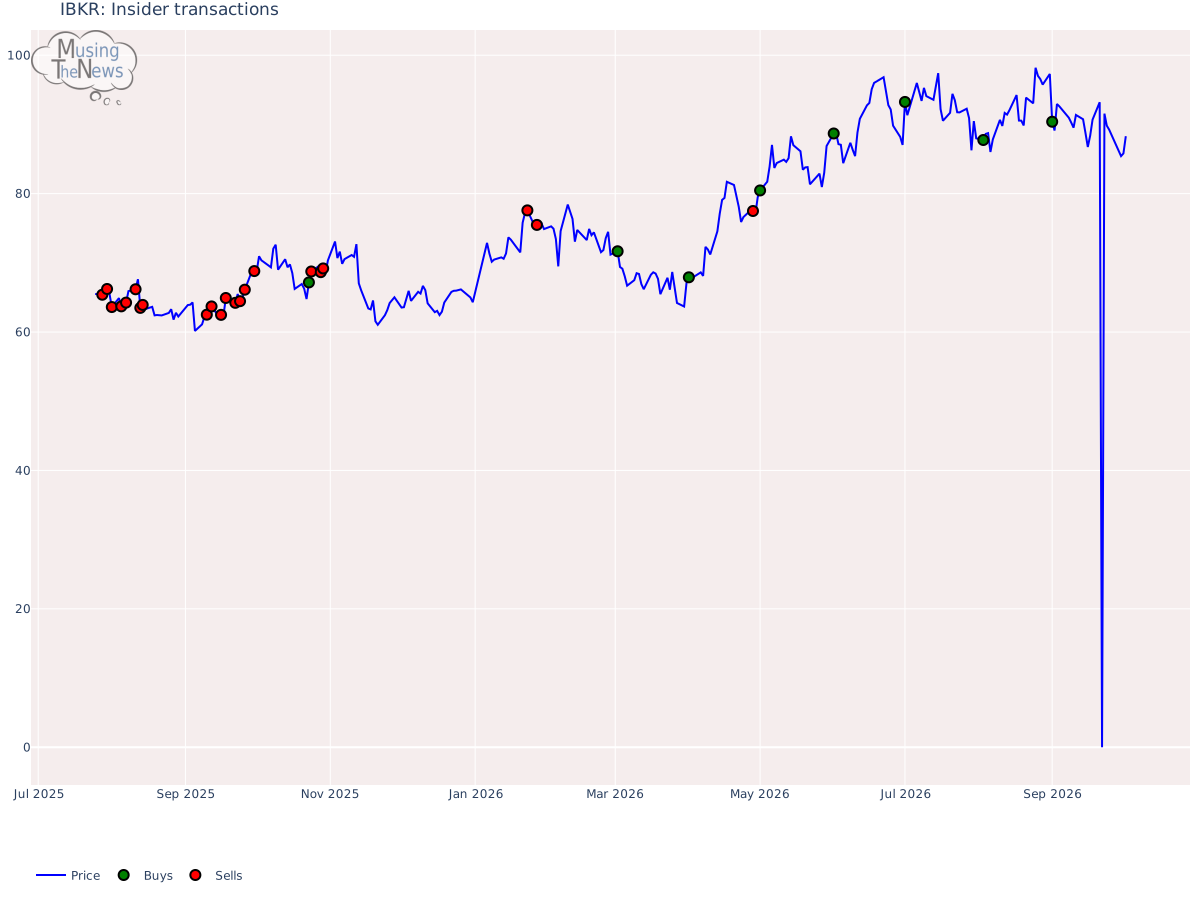
IBKR experienced 22 selling transactions, with market price of 66.86954567649148.8 purchases of IBKR were executed, with market price of 80.91125011444092.More recent purchases than sales at current price levels for IBKR could signal growing investor confidence. This buying trend might suggest that market sentiment is leaning toward a positive outlook for the stock, possibly indicating expectations of favorable performance in the near future.
Recommendation changes over time:
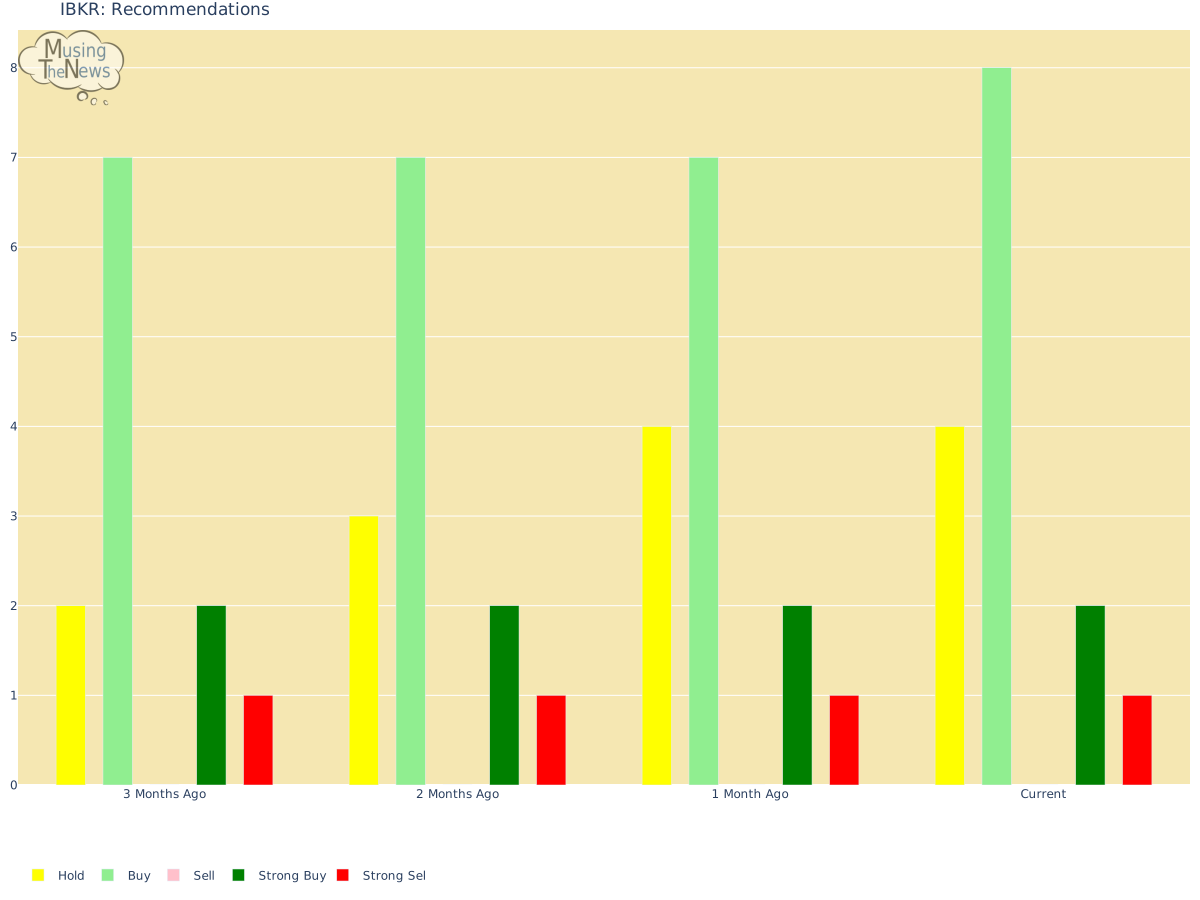
The analysts' recent buy bias for Interactive Brokers Group, Inc. indicates strong confidence in the stock's future performance. This could encourage more investors to view Interactive Brokers Group, Inc. as a worthwhile investment, positioning the company as a top choice for those seeking financial security and long-term growth opportunities.





