
More about Charles River Laboratories International, Inc.
Regulatory Filings for Charles River Laboratories International, Inc.
Fundamentals for Charles River Laboratories International, Inc.

AI Learns to Read the Federal Reserve

AI Subscriptions Rewrite the Inflation Playbook

Diversification Shielded U.S. Banks

Repo, Debt and Risk: The Fed's Untold Warning for 2026
Technicals for Charles River Laboratories International, Inc.



Price Summary
In today's trading, Charles River Laboratories International, Inc.'s stock surged by 2.01%, showcasing an stellar market day.On 2026-08-20, Charles River Laboratories International, Inc.'s stock opened at 285.72, reached 299.32, hit a low of 281.73, and rose 2.01% to close at 291.45, with 1059300 shares traded.
Over the previous 52 weeks, the stock reached a high of 291.45 and a low of 0.0.
Technicals
Aroon: Aroon's bullish trend continues, with Aroon Up remaining at the 100 level. This indicates sustained bullish momentum, but to fully understand the trend's implications, it should be analyzed alongside other indicators. A more comprehensive assessment will provide a clearer picture of the direction.

Bol. Bands: The BOLL BANDS is in a neutral stance, with no clear signals for movement up or down. This neutral position indicates a potential period of consolidation or uncertainty in the market.

Parabolic SAR: The PSAR continues to indicate a bullish outlook, setting a crucial support level. This strong support could bolster the ongoing upward trend, suggesting that the market may remain in a positive trajectory. Investors may view this as a sign of sustained bullish momentum.

Stochastic: The stochastic indicator shows bullish conditions, with the K-line positioned above the D-line and exceeding the 80 level. This setup suggests strong upward momentum, indicating that the market may continue to rise. Investors might view this as a favorable sign for continued growth.

Tripple Moving Agerage: The 20, 50, and 100 moving averages are currently aligned bearishly, indicating a downtrend. However, the slopes of the 20 and 50 SMAs are starting to waver, suggesting that this bearish momentum might be fading. This could be an early indication of a potential bullish reversal, as the market's current downward trend loses strength and prepares for a possible shift towards more positive price action.

A thorough analysis of a company involves looking beyond its stock price movements and trading patterns. You must also examine its fundamentals, which include profitability, growth prospects, and competitive advantages. Additionally, the industry in which the company operates provides important context, as factors like technological innovations, regulation, and market demand influence performance. By integrating this information with technical analysis, more accurate predictions about the company's future can be made.
If you have enjoyed reading, spread the word:
Good prospects:
Companies with the best and the worst technicals.
Latest Regulatory Filings for SP5
Companies with the best and the worst fundamentals.

When Losing Money Pays: America's Broken Market Logic

The Hidden Time Bomb in AI Finance
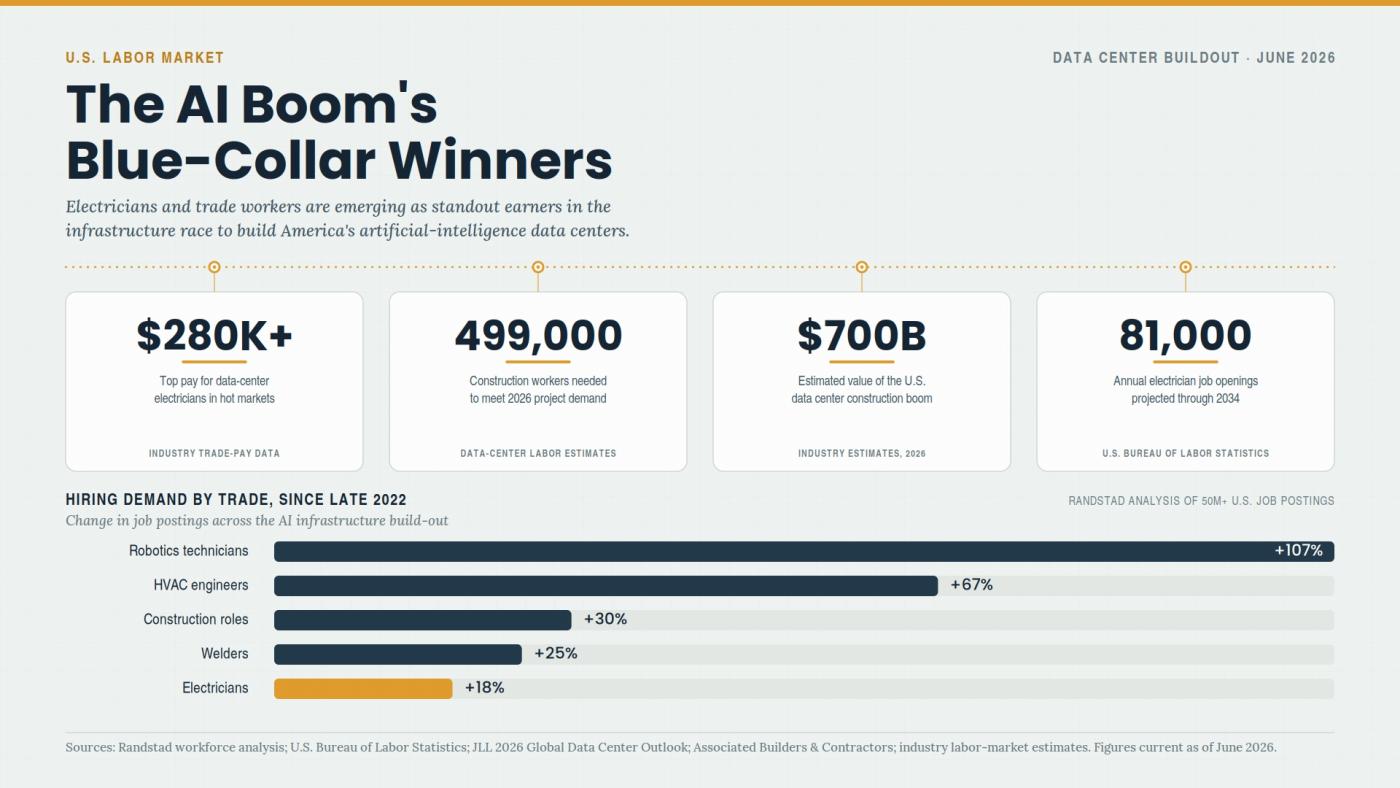
Why Electricians Now Out-Earn Software Engineers