Fundamentals for CME Group Inc.
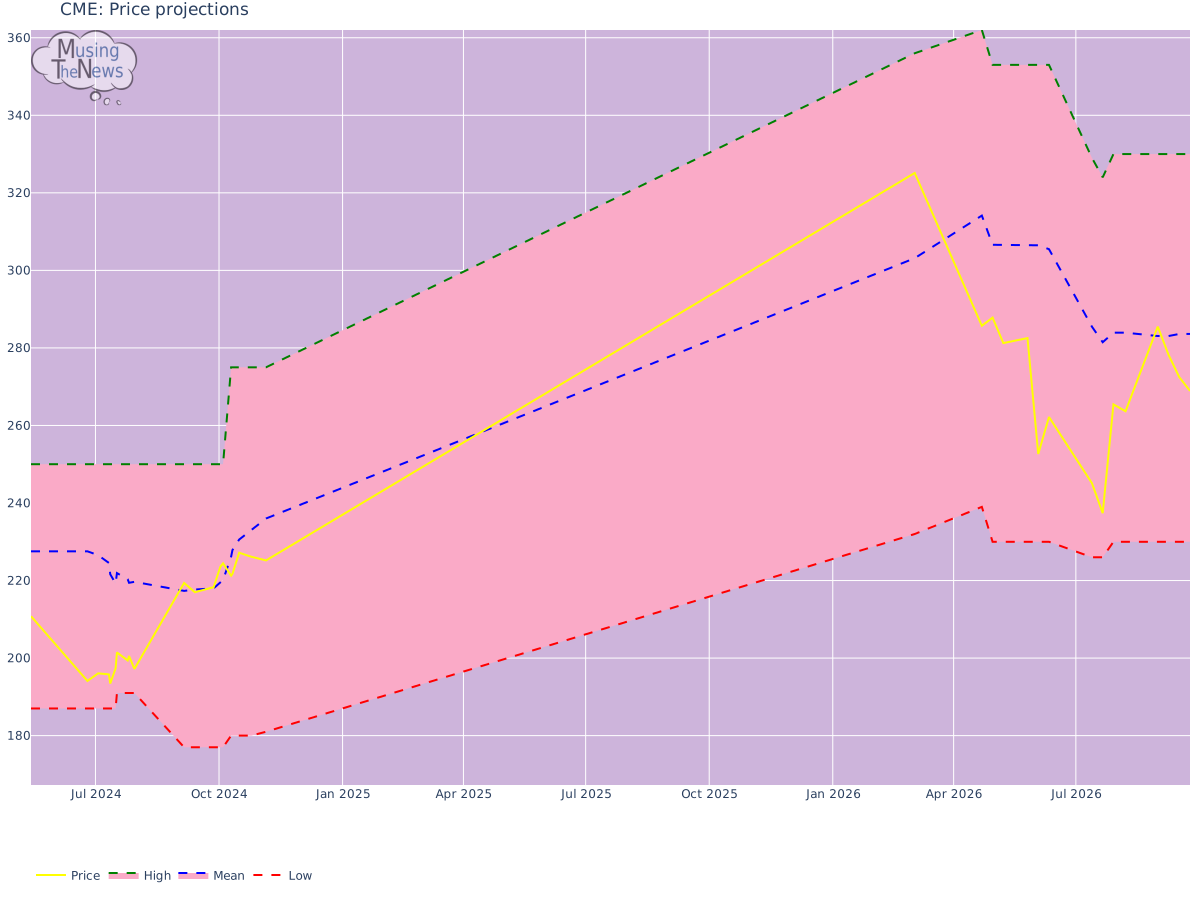
The stock price of CME Group Inc. has frequently been close to the lower end of analysts' projections. This trend indicates potential struggles for the company in achieving...






Business Operations:
Sector: Financial ServicesIndustry: Financial Data & Stock Exchanges
CME Group Inc., together with its subsidiaries, operates contract markets for the trading of futures and options on futures contracts worldwide. It offers futures and options products based on interest rates, equity indexes, foreign exchange, agricultural commodities, energy, and metals, as well as fixed income and foreign currency trading services. The company provides clearing house services, including clearing, settling, and guaranteeing futures and options contracts, and cleared swaps products traded through its exchanges; and trade processing and risk mitigation services. In addition, the company offers a range of market data services, including real-time and historical data services. It serves professional traders, financial institutions, institutional and individual investors, corporations, manufacturers, producers, governments, and central banks. The company was formerly known as Chicago Mercantile Exchange Holdings Inc. and changed its name to CME Group Inc. in July 2007. The company was founded in 1898 and is headquartered in Chicago, Illinois.
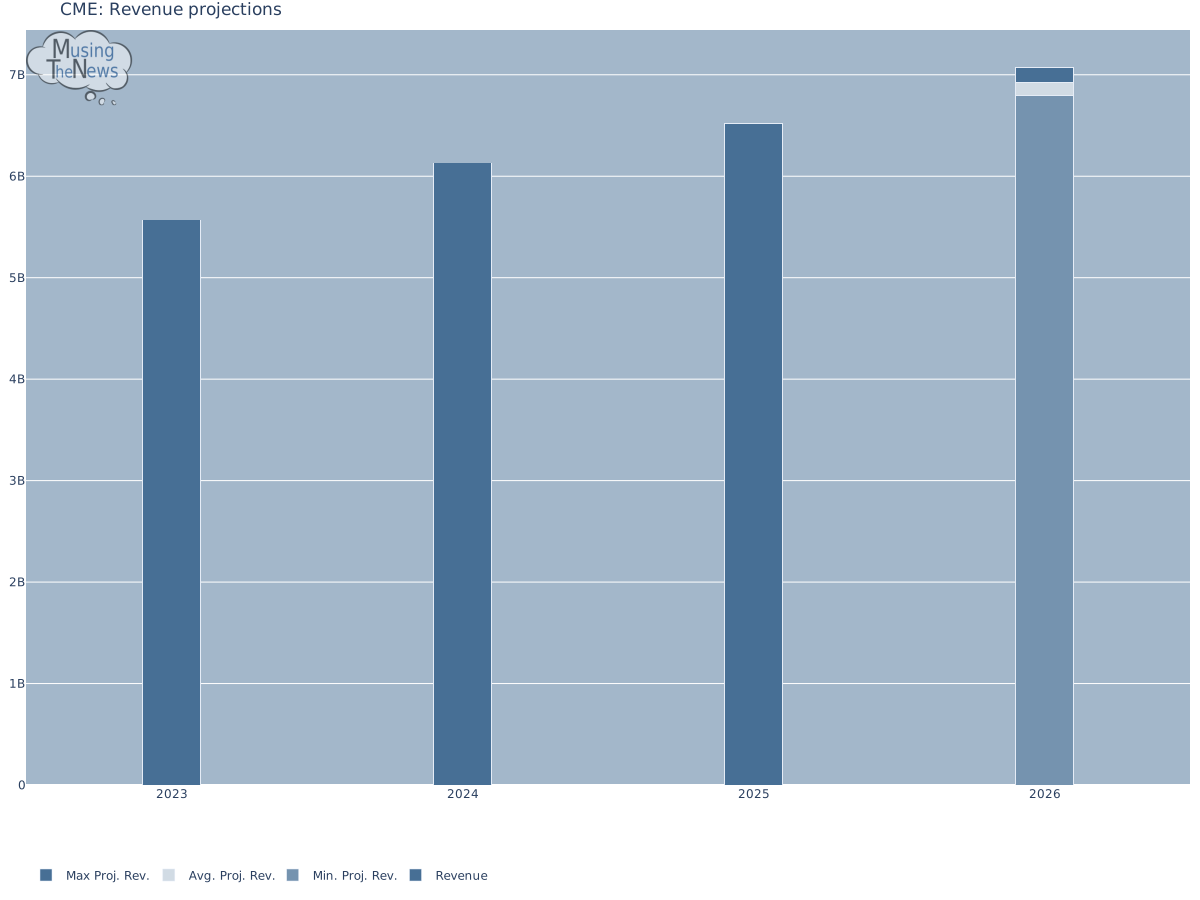
Revenue projections:
Financial Ratios:
| currentRatio | 1.018000 |
|---|---|
| forwardPE | 20.493181 |
| debtToEquity | 14.587000 |
| earningsGrowth | 0.025000 |
| revenueGrowth | 0.008000 |
| grossMargins | 1.000000 |
| operatingMargins | 0.650360 |
| trailingEps | 11.930000 |
| forwardEps | 12.936010 |
CME's current ratio, being 1.018, means the company is well-positioned to meet its short-term debt obligations. This reflects CME's strong liquidity, as its cash reserves and current assets provide more than enough coverage for its immediate liabilities.
CME's Forward PE is in a favorable range, suggesting the stock is reasonably priced relative to its earnings. This indicates the stock is not overpriced, providing room for potential growth and making it an attractive option for investors looking for solid value and future upside.
CME's low Debt-to-Equity ratio shows that the company isn't heavily reliant on debt for financing. This implies a conservative approach to leveraging, reducing financial risk and demonstrating a solid financial foundation, which can enhance investor confidence in the company's long-term stability.
CME Group Inc.'s positive gross and operating margins indicate healthy profitability. These margins reflect the company's ability to generate income efficiently from its operations, signaling strong financial performance and effective cost management.
CME's forward EPS being higher than its trailing EPS indicates that the company is expected to achieve greater profitability this financial year. This suggests improving earnings and a stronger financial position compared to the previous year's performance.
Price projections:
Insider Transactions:
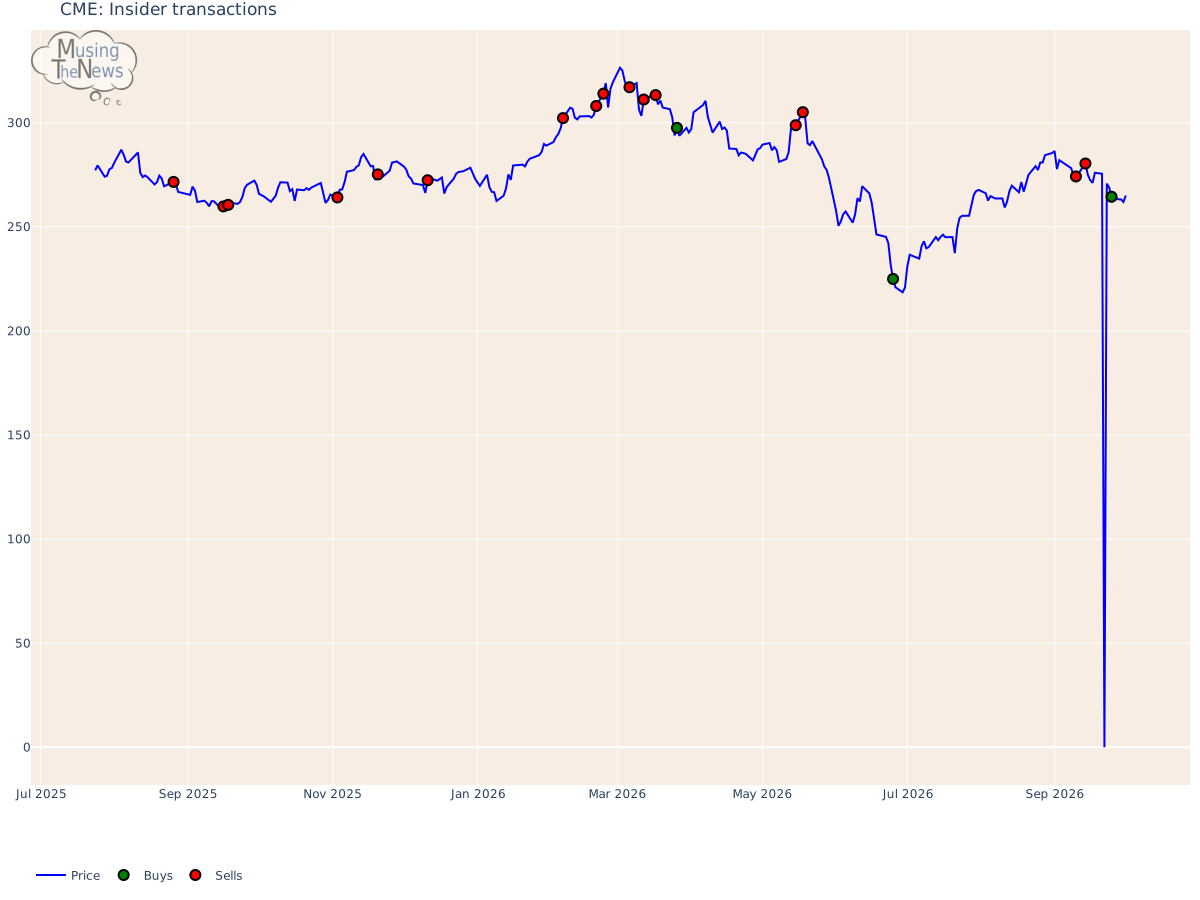
In recent market activity, 16 sales of CME Group Inc. shares took place, with market price at 289.2798385620117.3 purchases of CME Group Inc. stock were recorded, with market price of 262.35333251953125 per share.The higher number of buys versus sells near CME's current price suggests optimism among investors. This buying trend could be interpreted as a sign that the market expects favorable outcomes for the stock in the near future.
Recommendation changes over time:
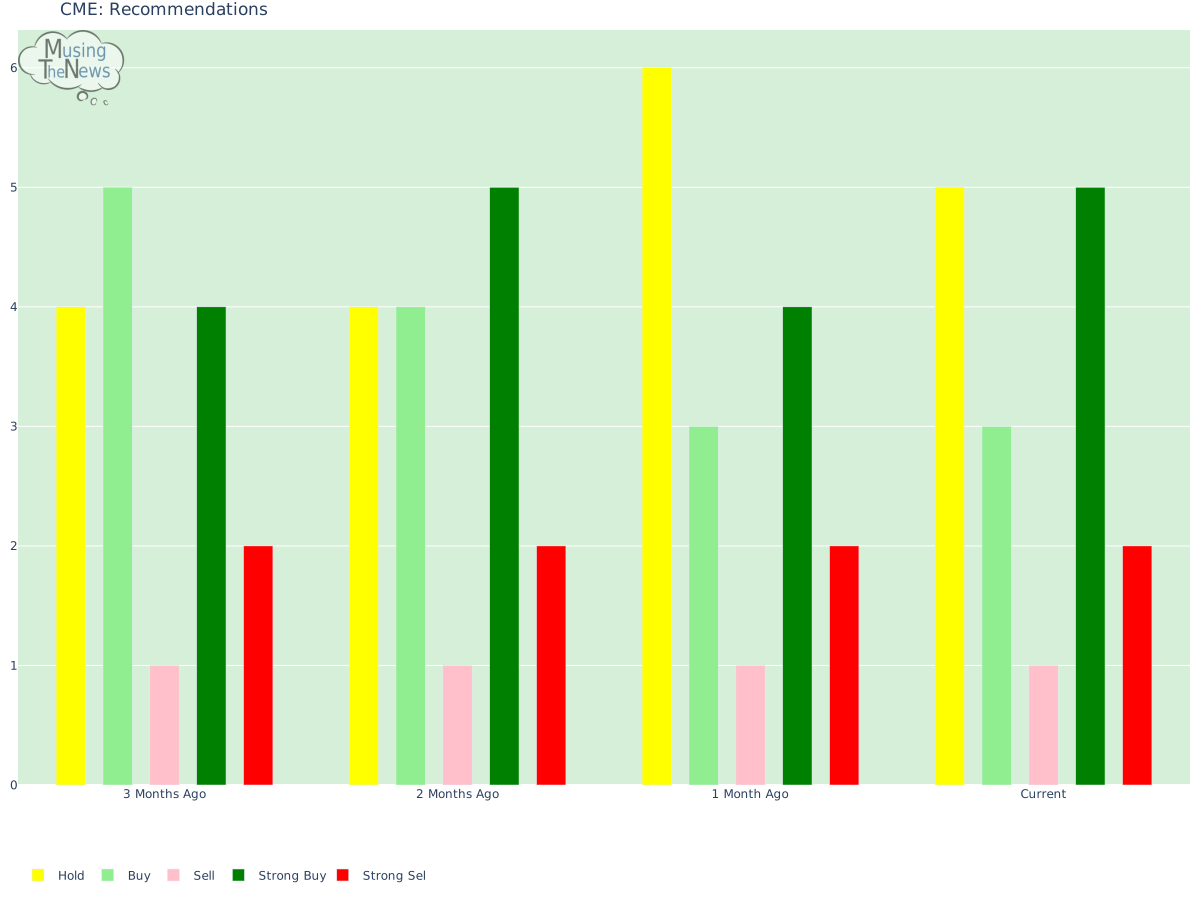
The analysts' recent buy bias for CME Group Inc. indicates strong confidence in the stock's future performance. This could encourage more investors to view CME Group Inc. as a worthwhile investment, positioning the company as a top choice for those seeking financial security and long-term growth opportunities.