More about Cardinal Health, Inc.
Regulatory Filings for Cardinal Health, Inc.
Fundamentals for Cardinal Health, Inc.

Diversification Shielded U.S. Banks

Repo, Debt and Risk: The Fed's Untold Warning for 2026

When Losing Money Pays: America's Broken Market Logic

The Hidden Time Bomb in AI Finance
Technicals for Cardinal Health, Inc.



*CAH makes the list of companies with the worst technicals at present.
Price Summary
In today's trading session, CAH's shares declined by -2.97%, marking a poor day.Cardinal Health, Inc.'s stock started the year at 227.3, climbed to a high of 229.85, fell to 220.38, and closed -2.97% down at 220.54, with 1663178 shares traded on 2026-07-22.
The peak price for the stock in the past 52 weeks is 239.71, with the lowest price being 146.04.
Technicals
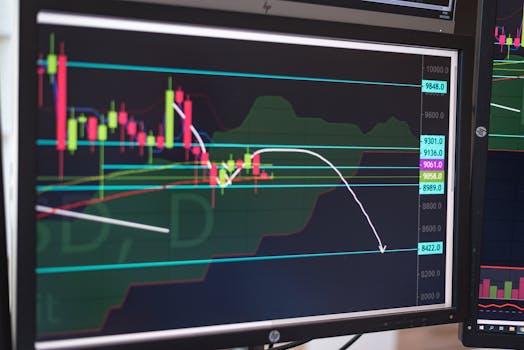
Support and Resistance: The price of 220.54 is supported at 217.78 and faces resistance at 226.32. This range suggests key levels for CAH where the price may stabilize, with 217.78 acting as a support and 226.32 as a cap on gains.
Aroon: Aroon's bearish trend remains strong, with Aroon Down still at the 100 level. This suggests ongoing downward pressure. However, this trend should be further explored using additional indicators to gain a clearer understanding of its long-term significance.

Bol. Bands: The current price has dipped below the lower Bollinger Band for CAH, suggesting the market might be oversold. This downward breach signals increased selling pressure, which could indicate that the bearish trend will persist. However, the drop below the lower band could also be a precursor to a reversal, as such levels often attract buyers looking to capitalize on potential price rebounds.

Parabolic SAR: The PSAR remains in a bearish mode, setting a strong resistance level that could impede any upward trends. This resistance indicates that the market may struggle to break higher, reflecting ongoing bearish sentiment for CAH.

Stochastic: The Stochastic K-line's position below the D-line and under 20 suggests a mildly bearish market condition. This setup indicates potential downside risk, but the bearish signal is not very strong. Traders should watch for further developments before making any decisions.

Tripple Moving Agerage: The current state of the Tripple MOVING AVG is neutral, offering no clear signals of movement in either direction. This suggests a potential pause in market activity, with no strong trend emerging at the moment.

When evaluating a company's technical indicators like price trends and trading volume, it's important to also assess its fundamentals. Key factors include the company's profitability, growth rate, and financial stability. Furthermore, considering the industry within which the company operates provides additional context, as factors like competition and market demand can affect performance. By combining this analysis, you can make more informed judgments about the company's future prospects.
If you have enjoyed reading, spread the word:
Good prospects:
Companies with the best and the worst technicals.
Latest Regulatory Filings for SP5
Companies with the best and the worst fundamentals.
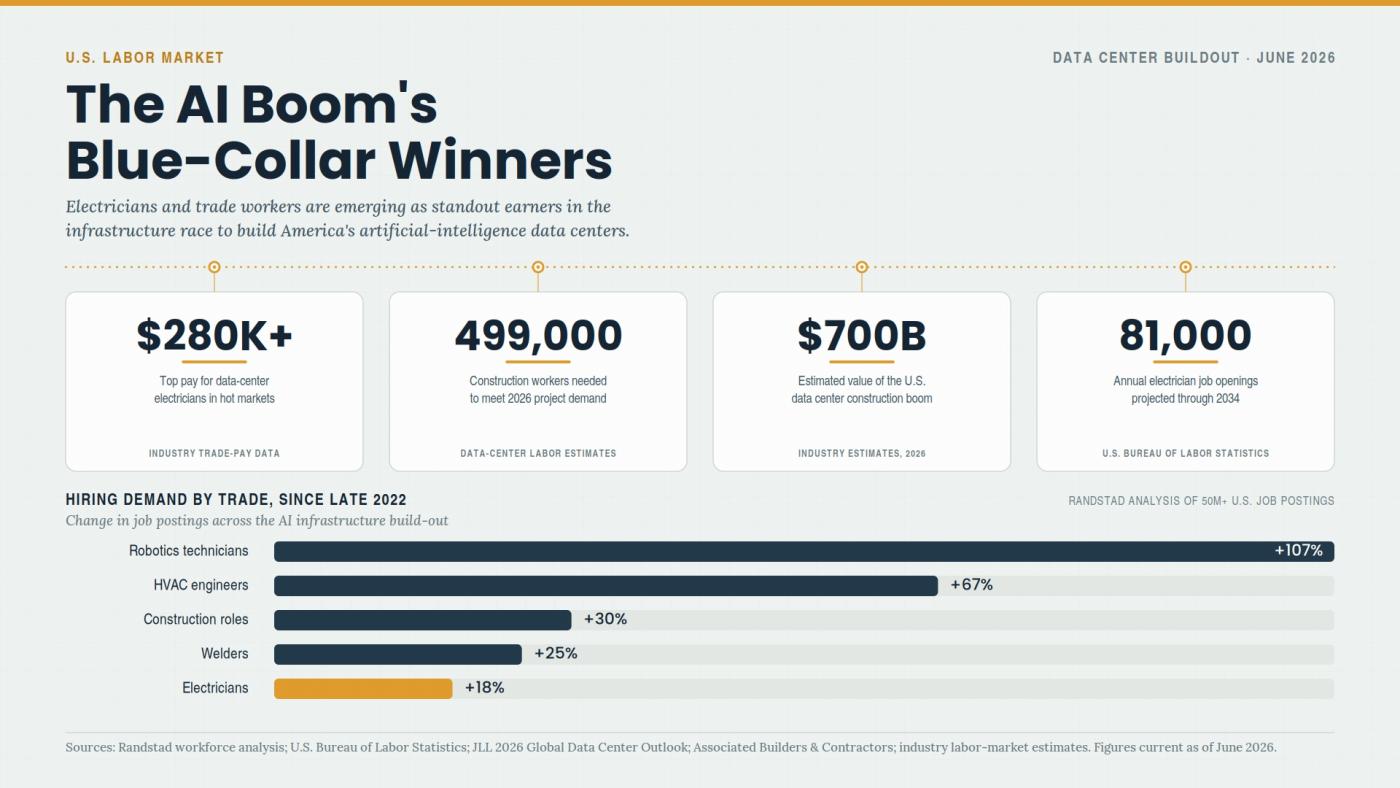
Why Electricians Now Out-Earn Software Engineers
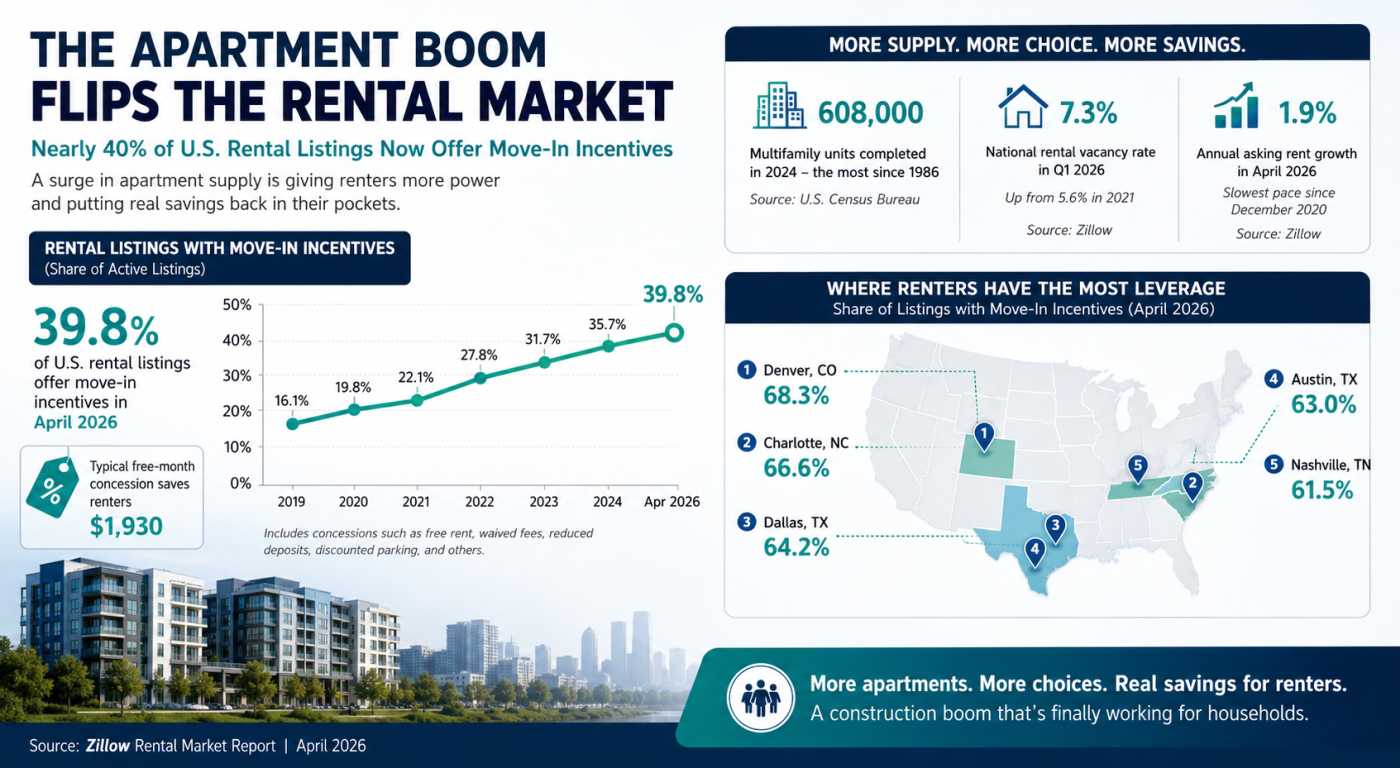
The Apartment Glut Changing America’s Rental Market
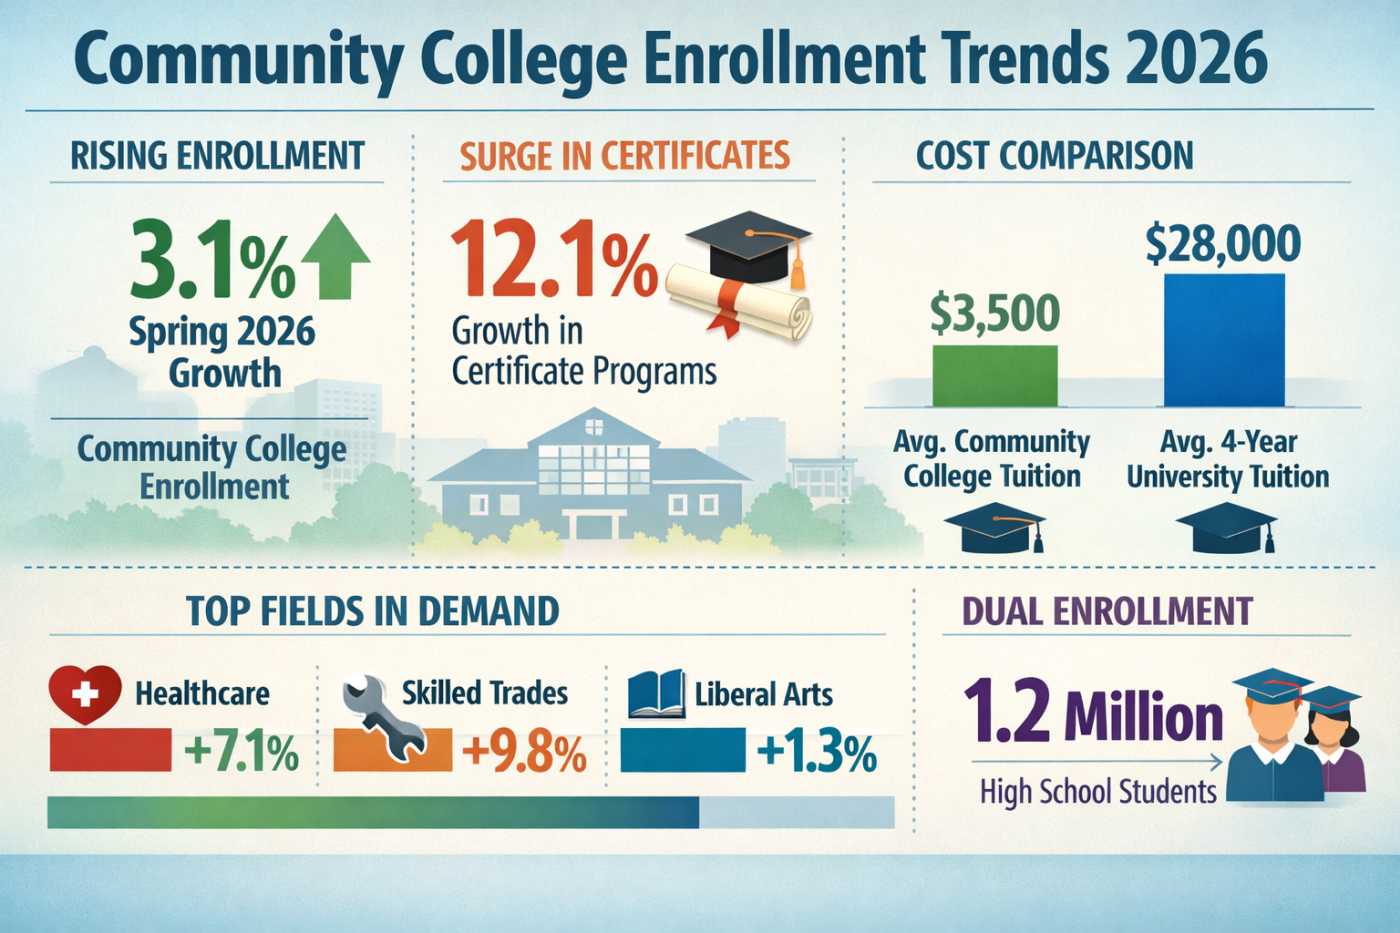
Why Community Colleges Are Winning Again