
More about The AES Corporation
Regulatory Filings for The AES Corporation
Fundamentals for The AES Corporation

Diversification Shielded U.S. Banks

Repo, Debt and Risk: The Fed's Untold Warning for 2026

When Losing Money Pays: America's Broken Market Logic

The Hidden Time Bomb in AI Finance
Technicals for The AES Corporation



Price Summary
On 2026-07-22, AES's stock opened at 14.83, reached a peak of 14.87, dropped to 14.82, and ended 0.2% up at 14.86, with a volume of 5817908 shares.Throughout the 52-week period, the stock hit a high of 17.28 and a low of 12.51.
Technicals
Support and Resistance: The current price for AES is 14.86, supported at 14.65 with resistance at 15.04. This indicates a trading range where 14.65 might prevent further declines, while 15.04 could hinder additional gains.
Aroon: Aroon's bullish trend continues, with Aroon Up at the 100 level, indicating strong market momentum. However, further analysis with other indicators is essential for AES to assess the trend's long-term viability and potential for continued growth.

Bol. Bands: The BOLL BANDS is showing a neutral stance, with no definitive indication of an upward or downward trend for AES. This neutral position suggests a period of indecision in the market, making it difficult to predict the next move.

Parabolic SAR: The PSAR for AES continues to signal a bullish outlook, establishing a crucial support level that may help sustain the current upward momentum. This level of support suggests that the market is likely to continue trending higher, providing a foundation for ongoing bullish movement.

Stochastic: With the K-line exceeding both the D-line and the 80 level, the stochastic indicator is showing a bullish signal. This suggests strong upward momentum, indicating that the market may continue to trend higher. Traders could view this as a sign of ongoing strength in the market.

Tripple Moving Agerage: The 20, 50, and 100 period moving averages are currently aligned bearishly, indicating a downtrend for AES. However, the slower SMAs seem to be losing steam, hinting at a possible change. This weakening of the bearish momentum could signal an upcoming shift towards a bullish direction, suggesting that the market may soon experience a reversal from its current trend.

Before focusing on a company's technical data, such as stock price movements, it's essential to analyze its fundamentals. These include factors like profitability, cash flow, and debt management. Additionally, considering the broader industry landscape—including market trends, competition, and regulatory changes—offers deeper insights. This comprehensive approach allows for a more meaningful interpretation of the company's technical indicators, providing a clearer picture of its financial health and future prospects.
If you have enjoyed reading, spread the word:
Good prospects:
Companies with the best and the worst technicals.
Latest Regulatory Filings for SP5
Companies with the best and the worst fundamentals.
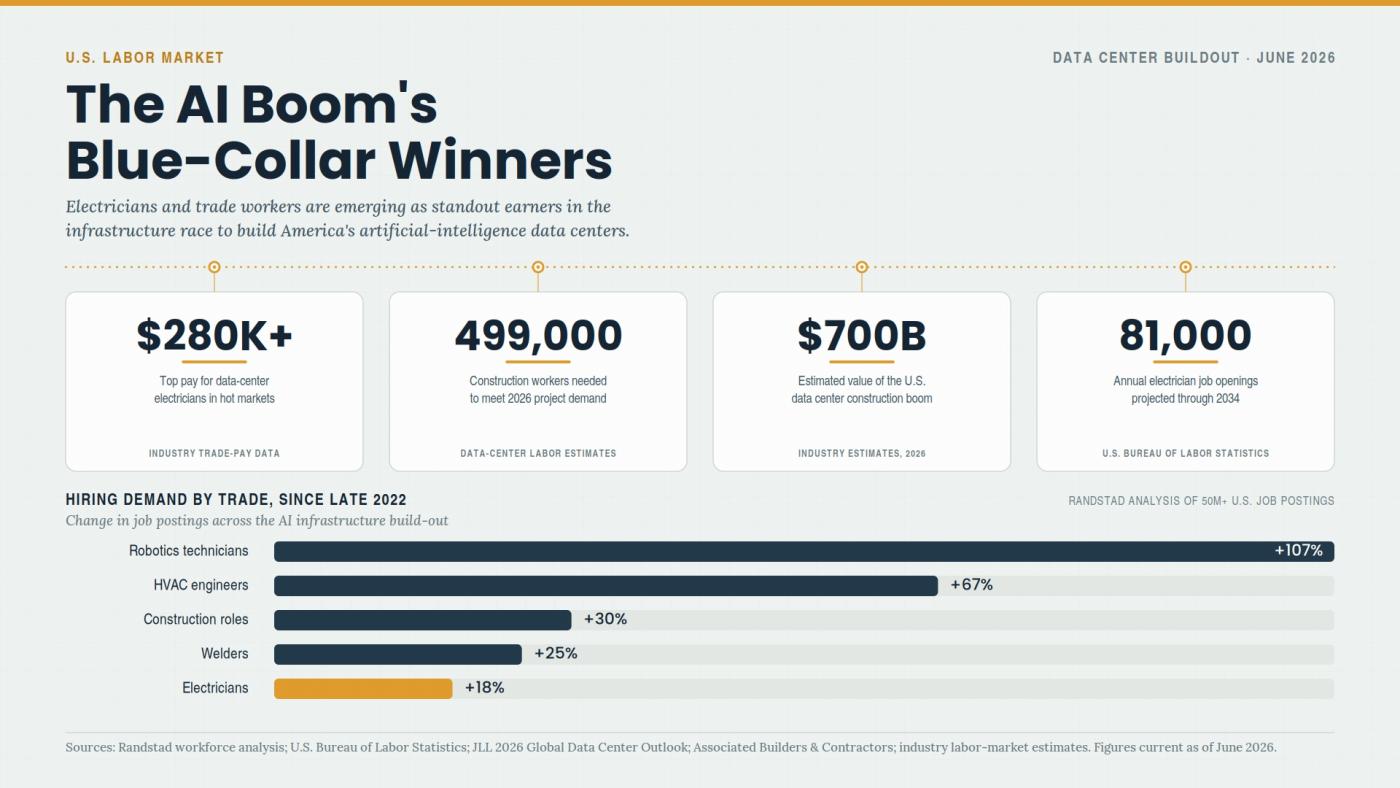
Why Electricians Now Out-Earn Software Engineers

The Apartment Glut Changing America’s Rental Market

Why Community Colleges Are Winning Again